BUY TODAY SELL TOMORROW for 5% - BTST STOCK OPTIONDON’T HAVE TIME TO MANAGE YOUR TRADES?
- Take BTST Stock Option trades at 3:25 pm every day
- Try to exit by taking 4-7% profit of each trade
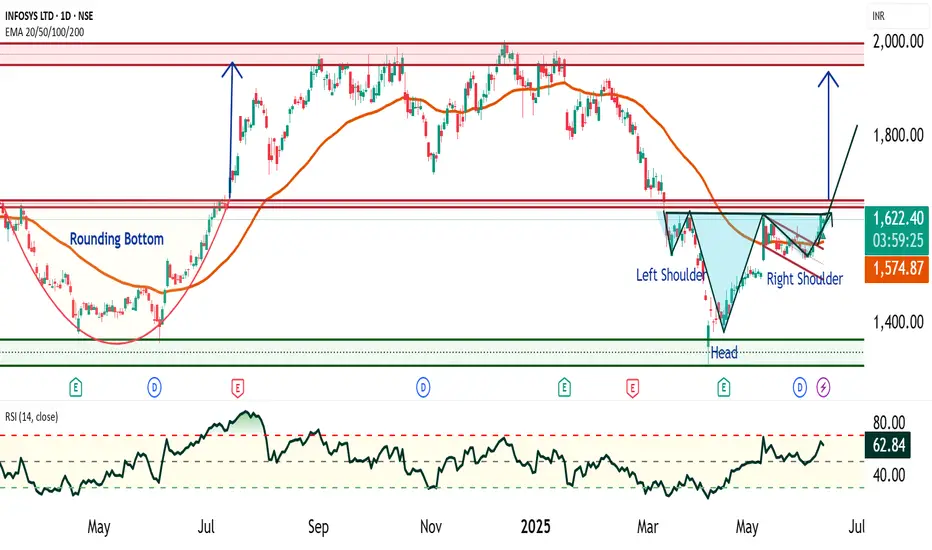
- Head & Shoulder Breakout in IIFL
BUY TODAY, SELL TOMORROW for 5%
I