How to use Head n Shoulder / Inv. Head n Shoulder Chart Pattern.Hello Friends,
Welcome to RK_Chaarts,
Today we are going to Learn how to use Head n Shoulder / Inverted Head n Shoulder (Reversal Chart Pattern) as a Professional Trader along with real terms to check, Confirm and apply.
• Where to find: After a strong uptrend (H&S) or After downtrend (Inverse H&S).
• Confirmation: Neckline breakout with increased volume.
• Trading Strategy: Enter after neckline break, set stop-loss below the right shoulder, Aim for a target equal to the height of the Head pattern.
• Supporting Checks: No major Resistance or Hurdle (50,100,200 EMAs) should be there in way towards Target.
This post is shared purely for educational purpose & it’s Not a trading advice.
I am not Sebi registered analyst.
My studies are for educational purpose only.
Please Consult your financial advisor before trading or investing.
I am not responsible for any kinds of your profits and your losses.
Most investors treat trading as a hobby because they have a full-time job doing something else.
However, If you treat trading like a business, it will pay you like a business.
If you treat like a hobby, hobbies don't pay, they cost you...!
Hope this post is helpful to community
Thanks
RK💕
Disclaimer and Risk Warning .
The analysis and discussion provided on in.tradingview.com is intended for educational purposes only and should not be relied upon for trading decisions. RK_Chaarts is not an investment adviser and the information provided here should not be taken as professional investment advice. Before buying or selling any investments, securities, or precious metals, it is recommended that you conduct your own due diligence. RK_Chaarts does not share in your profits and will not take responsibility for any losses you may incur. So Please Consult your financial advisor before trading or investing.
Head_and_shoulder
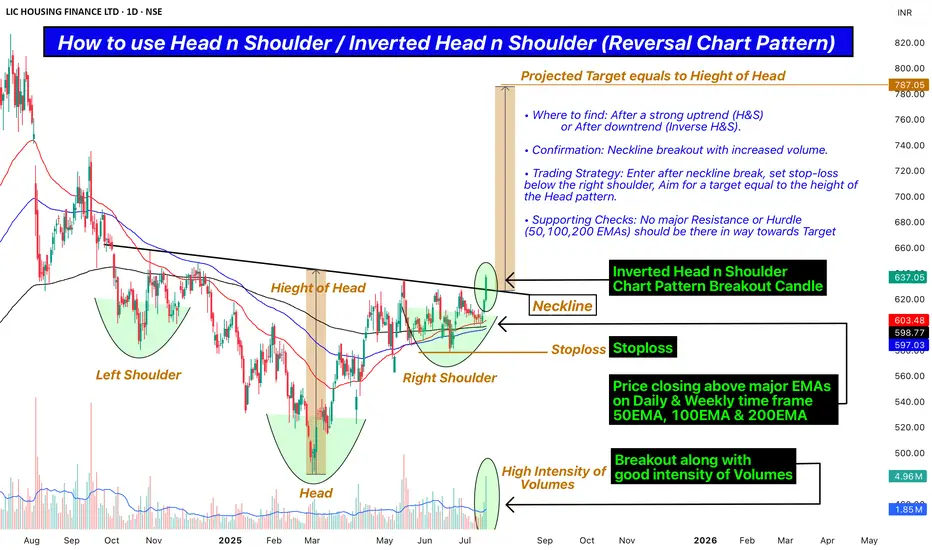
Chart says everything itself: Educational post
Please check all snaps shared here
Educational post
I am not Sebi registered analyst.
My studies are for educational purpose only.
Please Consult your financial advisor before trading or investing.
I am not responsible for any kinds of your profits and your losses.
Most investors treat trading as a hobby because they have a full-time job doing something else.
However, If you treat trading like a business, it will pay you like a business.
If you treat like a hobby, hobbies don't pay, they cost you...!
Hope this post is helpful to community
Thanks
RK💕
Disclaimer and Risk Warning.
The analysis and discussion provided on in.tradingview.com/u/RK_Charts/ is intended for educational purposes only and should not be relied upon for trading decisions. RK_Charts is not an investment adviser and the information provided here should not be taken as professional investment advice. Before buying or selling any investments, securities, or precious metals, it is recommended that you conduct your own due diligence. RK_Charts does not share in your profits and will not take responsibility for any losses you may incur. So Please Consult your financial advisor before trading or investing.

Head and ShoulderDistinct and clear patterns are usually good for learning price action.
Current H&S formed in bank nifty ticks all checkboxes.
1. It is formed after reasonable up trend.
2. Pattern appears clean.
3. Target is reaching a logical level of 200dma
4. Most of positive news are gone by and interest rate reduction is still 2~3 quarters delayed.
This may not be total trend reversal but around 4% downside is possible. While such move may not be useful for swing traders, it can create good buying opportunity in your favorite banking stock.

An Analysis in Harmony Top-Down Approach chart studyHello Friends,
Today, we have something special in store as we take a top-down approach to analyze a specific stock - Tata Communications in the world of trading. By employing this multi-time frame method, we'll be diving into various charts, starting from the big picture down to smaller timeframes.
Before we begin, please remember that trading carries risks, and past performance does not guarantee future results. The analysis we're about to discuss is for educational purposes only and not financial advice.
Alright, let's kick off our analysis with the big picture - the monthly chart of Tata Communications. Here, we've identified an exciting Elliott wave count - the third wave of the fifth wave. According to Elliott wave theory, markets move in a series of five waves in the direction of the main trend, followed by three waves in a corrective direction. The third wave is well known for its strength and often the longest in a trending market. So, on the monthly chart of Tata Communications, we're witnessing this powerful third wave within the fifth wave, indicating potential significant moves ahead for the stock.
Next, we'll move down to the weekly chart to gain more insights. On this timeframe, we observed a thrilling development - the "inverted head and shoulders" pattern. This pattern aligns perfectly with the larger Elliott wave count on the monthly chart, supporting the idea of a trend reversal and a potential new uptrend for Tata Communications.
Finally, we'll zoom in even closer to the daily chart. Here, we have another intriguing pattern - a "flag and pole" pattern in the forming stage. This daily pattern further reinforces the notion of an upcoming bullish move for Tata Communications, in line with both the weekly inverted head and shoulders breakout and the monthly Elliott wave count.
On daily time frame Flag and pole chart patterns, flag in formation and still breakout is pending
By utilizing the top-down approach, we've gained a comprehensive understanding of Tata Communications' potential direction. The monthly Elliott wave count provided us with the big picture, the weekly inverted head and shoulders confirmed the trend reversal, and the daily flag and pole pattern hinted at a continuation of the upward movement for the stock.
But remember, trading involves risks, and there are no guarantees. So, it's essential to approach it with caution and use risk management strategies to protect your capital.
In conclusion, we've taken a top-down approach to analyze Tata Communications, considering the monthly Elliott wave count, the weekly inverted head and shoulders breakout, and the daily flag and pole pattern in the forming stage. Keep a close eye on these patterns and the stock's price action, and remember to trade wisely and make well-informed decisions.
I am not Sebi registered analyst. My studies are for educational purpose only.
Please Consult your financial advisor before trading or investing. I am not responsible for any kinds of your profits and your losses.
Thank you for joining us on this exciting trading journey !
Most investors treat trading as a hobby because they have a full-time job doing something else.
However, If you treat trading like a business, it will pay you like a business.
If you treat like a hobby, hobbies don't pay, they cost you...!
Hope this post is helpful to community
Thanks
RK💕
Disclaimer and Risk Warning.
The analysis and discussion provided on in.tradingview.com is intended for educational purposes only and should not be relied upon for trading decisions. RK_Charts is not an investment adviser and the information provided here should not be taken as professional investment advice. Before buying or selling any investments, securities, or precious metals, it is recommended that you conduct your own due diligence. RK_Charts does not share in your profits and will not take responsibility for any losses you may incur. So Please Consult your financial advisor before trading or investing.

Intraday head and shoulder pattern trading This is a small video on how to calculate the target in the head and shoulder pattern which will allow us to place an alert using the tradingview tools. The tradingview tools make calculating the exact target based on the patterns a lot more easier. I hope this video helps the beginners, please note this is only for beginners and if you are already familiar with the patterns well then you may skip this.

Trading Reverse Head & Shoulder PatternWhat is Reverse head & shoulder ?
Ans:- The Reverse Head and Shoulders is a bullish reversal pattern that is formed in the stock market when an asset experiences a decline, followed by a moderate recovery, then another decline to a lower level, another recovery to near the original decline, and finally another decline to a level that is lower than the previous decline. The pattern is considered complete when the price rises above the neckline, which is the line connecting the highs of the two recoveries.
The pattern is named after its visual appearance, which resembles the human head and shoulders, but in reverse. The three troughs form the shoulders and the head, while the neckline serves as the confirmation point for a reversal. The height of the pattern can be used to estimate the potential upside for the asset once the reversal is confirmed.
The Reverse Head and Shoulders pattern is often seen as a positive sign for the market, indicating a potential end to the downtrend and a shift towards upward momentum. However, it is important to consider other factors such as market sentiment before making a trade based on this pattern.
Now how to trade Reverse Head & shoulder pattern?
Ans:- To trade this pattern we should follow:-
Identifying the pattern: To trade the Reverse Head and Shoulders pattern, you first need to identify it on a stock chart. Look for three troughs followed by a neckline that connects the highs of the two recoveries.
Confirming the pattern: Once the pattern is identified, you need to confirm it by waiting for the price to rise above the neckline. This is considered the confirmation point and signals the start of a potential upward trend.
Setting a target price: The height of the pattern can be used to estimate the potential upside for the asset. Measure the distance between the neckline and the lowest trough and add it to the neckline to determine a target price.
Placing a trade: Once the pattern is confirmed and the target price is set, you can place a long (buy) trade. It is recommended to use a stop loss order to protect your trade in case the pattern does not play out as expected.
Monitoring the trade: After placing the trade, it is important to monitor the stock price and adjust your stop loss if necessary. Close the trade once the target price is reached or if the stock price drops below the neckline, indicating a potential reversal.
It is important to keep in mind that no single pattern or indicator can guarantee success in the stock market. It is also recommended to consider other factors such as market sentiment and technical indicators before making a trade based on the Reverse Head and Shoulders pattern.
Pros:
Sign of a potential trend reversal: The Reverse Head and Shoulders pattern is often seen as a positive sign for the market, indicating a potential end to the downtrend and a shift towards upward momentum.
Estimation of potential upside: The height of the pattern can be used to estimate the potential upside for the asset, allowing traders to set realistic targets and determine their risk-reward ratio.
Relatively easy to identify: The Reverse Head and Shoulders pattern is relatively easy to identify and does not require complex analysis, making it accessible to traders of all levels.
Con:
No guarantee of success: No single pattern or indicator can guarantee success in the stock market, and the Reverse Head and Shoulders pattern is no exception. The pattern can be disrupted by external factors such as market sentiment, economic data releases, and geopolitical events.
False signals: The pattern is not always reliable, and false signals can occur if the price does not rise above the neckline or if the trend does not continue as expected.
Need for confirmation: The pattern is not considered complete until the price rises above the neckline, and traders must wait for this confirmation point before entering a trade. This can lead to missed opportunities or increased risk if the pattern does not play out as expected.
In conclusion, The Reverse Head and Shoulders pattern is a bullish reversal pattern in the stock market that is formed by a series of declines and recoveries and, but it should not be relied upon exclusively. It is important to consider other factors and to always manage risk when trading based on this pattern.

'CONTINUE' trading with 'CONTINUATION' pattern_2nd Edition_!!!In previous idea of continuation pattern, which comprise explanation of some continuation patterns like triangles, flags and pennants it
was stated that in next post I'll be back with patterns such as head & shoulder , double top and bottoms and we're back.
As we have discussed in the previous section, that market can be either in trending phase or in a range-bound
phase. No trend generally lasts forever in the market. After prolonged or medium or shorter duration up and
downtrend, the market often reverses and a move starts in the opposite direction of the prior move. Often we
find that well defined geometrical patterns are formed in the chart which provides good indication of price
reversals. These patterns are called reversal classical chart patterns. When they are formed as a bullish reversal
pattern they are said to be part of accumulation. On the other hand if they are formed at the top of a price
move just before bearish reversal, then they are part of distribution.
However, a geometrically shaped consolidation does not necessarily mean price reversal. Often price resumes
the erstwhile trend post the consolidation move. These are called continuation classical chart pattern. We will
discuss about few of the classical chart patterns in the following section.
-> Head & Shoulder -:
Head and Shoulder pattern is a bearish reversal pattern. This pattern appears after an uptrend. This pattern is
formed with three consecutive tops with middle one being higher than the other two. The middle top is called
the head and the two side peaks are called the shoulders. On joining the intermediate troughs, we get the
neck-line. On ultimate break below the neckline, usually a short trade is taken with a stop-loss above the top
of the nearest shoulder. The target is usually considered as the distance between the neckline and head,
projected from the point of break. If the volume in the down leg of the right shoulder is on the higher side and
break happens with high volume, the conviction is on the higher side for the reversal.
An Inverse Head and Shoulder is just mirror image of the Head and Shoulder pattern. This should appear
after a sustained down trend, the rule of stop loss and target are similar. This often acts as a very effective
bullish reversal pattern.
-> Double Tops and Bottoms -:
These chart patterns are well-known patterns that signal a trend reversal – these are considered to be one of
the most reliable patterns and are commonly used. These patterns are formed after a sustained trend and
signal to chartists that the trend is about to reverse. These patterns are created when price movement tests
support or resistance levels twice and is unable to break through. These patterns are often used to signal
intermediate and long-term trend reversals.
Double top:
Double bottom:
-> Mechanism of Continuation Pattern -:
Continuation patterns provide some logic to the price action. By knowing the patterns, a trader can create a trading plan to take advantage of common patterns. The patterns present trading opportunities that may not be seen using other methods.
Unfortunately, simply because the pattern is called a "continuation pattern" does not mean it is always reliable. A pattern may appear during a trend, but a trend reversal may still occur. It is also quite possible that, once we have drawn the pattern on our charts, the bounds may be slightly penetrated, but a full breakout does not occur. This is called a false breakout and could occur multiple times before the pattern is actually broken and a continuation or a reversal occurs. Rectangles, due to their popularity and easy visibility, are highly susceptible to false breakouts.
Patterns can also be subjective, as what one trader sees is not what another trader sees, or how another trader would draw or define the pattern in real time. This is not necessarily a bad thing, as it can provide traders with a unique perspective on the market. It will require time and practice for the trader to develop his or her skill in finding patterns, drawing them and formulating a plan on how to use them.
My Observation -: These geometrical patterns are formed after a trend in that particular stock, it generally resumes the previous trend after being out of the pattern but some times it reverses the previous trend hence, it is advised to wait for the conformation to play the pattern.
And we can use RSI for conformation i.e. if you are seeing pattern breakout then just check if RSI is greater than 60 and if not than the chances of fakeout is more also in case of breakdown just check if RSI is below 40 else it can reverse.
#Enjoy_trading

Head and Shoulder Almost a textbook reversal pattern is formation, might take few months to complete. Just for tracking

ACC STRONG INSIDE
ACC following the H&S Pattern
breakdown happen yesterday
300 points down side
What Does a Head and Shoulders Pattern Tell You?
A head and shoulders pattern is comprised of three component parts:
After long bullish trends, the price rises to a peak and subsequently declines to form a trough.
The price rises again to form a second high substantially above the initial peak and declines again.
The price rises a third time, but only to the level of the first peak, before declining once more.
The first and third peaks are shoulders, and the second peak forms the head. The line connecting the first and second troughs is called the neckline.
How Do I Identify a Head and Shoulders Pattern on a Chart?
The pattern is composed of a "left shoulder," a "head," then a "right shoulder" that shows a baseline with three peaks, the middle peak being the highest. The left shoulder is marked by price declines followed by a bottom, followed by a subsequent increase. The head is formed by price declines again forming a lower bottom. The right shoulder is then created when the price increases once again, then declines to form the right bottom.
What Does a Head and Shoulders Pattern Indicate?
The head and shoulders chart is said to depict a bullish-to-bearish trend reversal and signals that an upward trend is nearing its end. Investors consider it to be one of the most reliable trend reversal patterns.
How Can I Use the Head and Shoulders Pattern to Make Trading Decisions?
The most common entry point is a breakout of the neckline, with a stop above (market top) or below (market bottom) the right shoulder. The profit target is the difference between the high and low with the pattern added (market bottom) or subtracted (market top) from the breakout price. The system is not perfect, but it does provide a method of trading the markets based on logical price movements.

20/08/21 reversal patternhead & shoulder formes also DAY and WEEKLY candles also favour to this pattern try. may it's working 50% because today Friday weekly may influences the market so cation with the stop loss

head and shoulder in cadilac1. head and shoulder pattern formed in cadilahc.
2. this is for education purpose only , please don't take this a call.
3. explained everything clearly in chart.

📚Learn More💰Earn More - Inverted Head and Shoulders in USDJPY📚 LEARN MORE
💰 EARN MORE
With ForecastCity
Inverted Head and Shoulders Definition:
A head and shoulders pattern is also a trend reversal formation.
It is formed by a Valley (left shoulder), followed by a Lower Valley (head), and then another Higher Valley (right shoulder).
A “ Neckline ” is drawn by connecting the highest points of the two Peaks. Neckline resistance does not need to be strictly horizontal.
This illustrates that the downward trend is coming to an end .
When a Head and Shoulders formation is seen in a downtrend, it signifies a major reversal .
The pattern is confirmed once the price breaches the neckline resistance .
In this example, we can easily see the head and shoulders pattern.
How to Trade the Head and Shoulders Pattern :
ENTRY:
we put an entry order above the neckline.
TARGET:
We can also calculate a target by measuring the lowest point of the head to the neckline.
This distance is approximately how far the price will move after it breaks the neckline.
❤️ If you find this helpful and want more FREE forecasts in TradingView
. . . . . Please show your support back,
. . . . . . . . Hit the 👍 LIKE button,
. . . . . . . . . . Drop some feedback below in the comment!
❤️ Your Support is very much 🙏 appreciated! ❤️
💎 Want us to help you become a better Forex trader ?
Now, It's your turn !
Be sure to leave a comment let us know how you see this opportunity and forecast.
Trade well, ❤️
ForecastCity English Support Team ❤️

Bank Nifty H & S Chart Pattern !!NSE:BANKNIFTY
Hi Trader,
Follow Chart Instruction and do not be hurry for entry. Wait for proper entry setup for Buy/Sell.
If it is helpful for you, please show your support and hit the LIKE button.
Drop some feedback below in the comment!
It is educational/learning purpose only...
Trade well,

Intranet Setup for 27th JulyChart is self explanatory
If Gap up Long entry
If Gap down short entry
#Head_and_shoulder

EicherUnless the monthly candle manages a close above 15200 this bearish H&S breakdown is suggesting 11500-12000 (Ichimoku support + 62%) and if that gives way then all the way down to 5000. Please don't forget this is a monthly time frame outlook. It can take all the sweet time in the world to get there.

head and shoulder infy daily chart formed a head and shoulder pattern . it may fall from this range.

Elliot Wave Correction In Nifty Wid Head & Shoulders ConfirmatinNifty is in Elliot's wave since 2016, This is the last wave of correction. (Weekly Charts)
The best part is, a Head n Shoulder at the End, Which mostly occurs in Elliot Wave (if no harmonic chart patterns are found).
On a larger scale also, NIfty is in Elliot's wave on Monthly charts. (Haven't covered here)
Nifty after touching 11,200-300 can shoot around 9000-9400.
Hence the stocks in Indian Stock Markets will follow.


BAJAJ FINANCE : HEAD & SHOULDER with WOLFE's WAVEBAJAJ FINANCE has beautifully formed a inverse Head and Shoulder pattern on hourly chart which is further supported by Wolfe Wave. If stock goes above its previous day's high then it may go up with good momentum.
