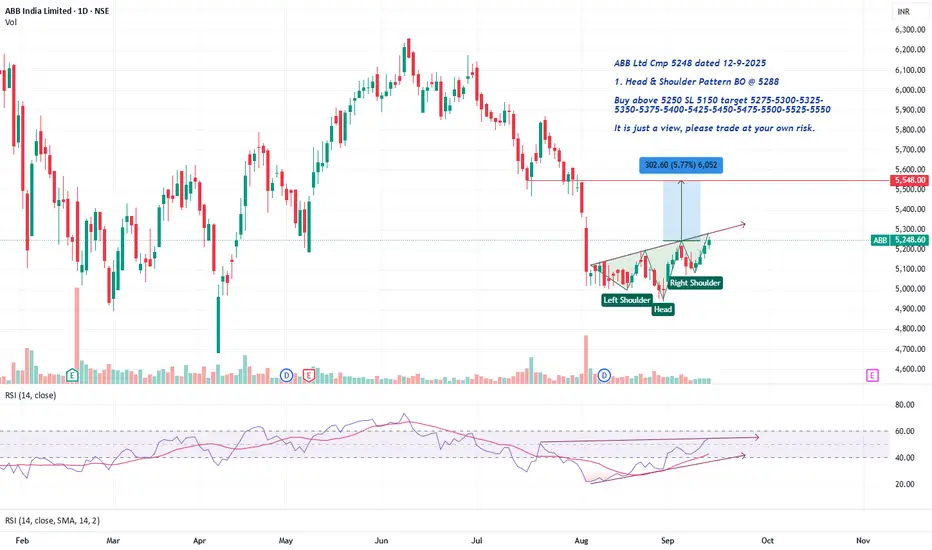
ABB Ltd Cmp 5248 Head & Shoulder Pattern BOABB Ltd Cmp 5248 dated 12-9-2025
1. Head & Shoulder Pattern BO @ 5288
Buy above 5250 SL 5150 target 5275-5300-5325-
5350-5375-5400-5425-5450-5475-5500-5525-5550
It is just a view, please trade at your own risk.
Head and Shoulders
bbtc bearishi think can go to below 1000 , already below 200 dma
Disclaimer- Just my view and opinion trade at your own risk not an investment advice these are only for educational purposes

Container Corporation of India Ltd – Head & Shoulders in PlayOn the monthly chart, CONCOR is showing a Head & Shoulders formation. The neckline around ₹480–500 is the key level to watch.
A breakdown below the neckline could confirm bearish continuation.
A successful hold above it may simply lead to sideways consolidation instead of a full breakdown.
The neckline is the make-or-break zone for the stock in the coming months.
Disclaimer: This analysis is for educational purposes only and does not constitute investment advice. Please do your own research (DYOR) before making any trading decisions.

IHNS AND CUP AND HANDLE IN HUDCOThe Stock Had Formed Cup And Handle & Inverse Head and Shoulder. The first 4 targets of Cup and Handle had been met. Now it has corrected and making Inverse Head & Shoulder in weekly Timeframe. Once it breaks out of the Neckline, it may hit the IHNS target of 348. And than Target 5 of Cup & Handle at 406 area. Lets see how it unfolds .Rest targets will be updated as chart unfolds. All Targets mention are Approximate. Good luck. TY .
ITS JUST PURELY FOR LEARNING AND EDUCATIONAL PURPOSE. Please Consult your financial advisor before trading or investing. I am not responsible for any kinds of your profits and your losses. THANK YOU.. JMK

Astral ltd Cmp 1462 H&S PatternAstral ltd Cmp 1462 dated 8-9-2025
1. H&S pattern BO above 1475
Buy above 1475 SL 1400 target 1490-1500-1510-
1525-1540-1550-1575-1590-1600-1610-1625-1650
1680
It is just a view, please trade at your own risk.

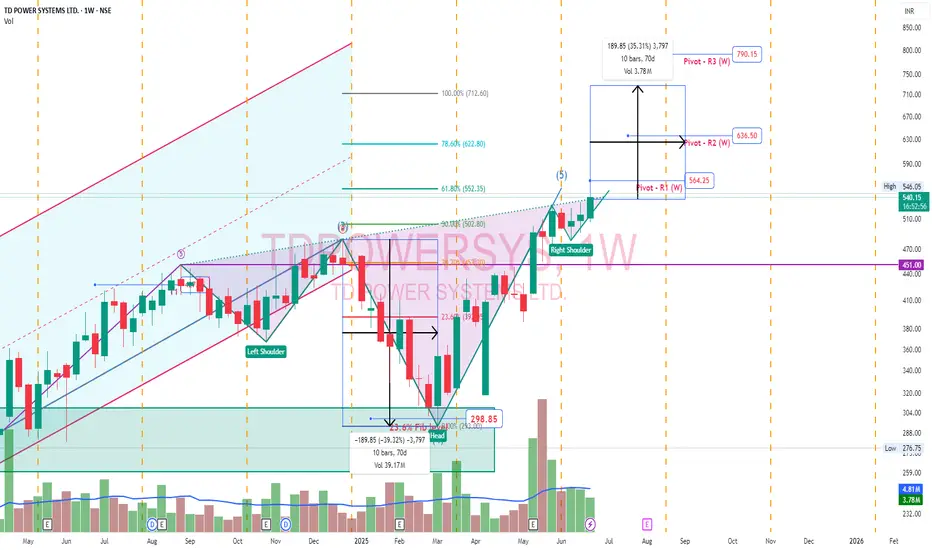
TdPowerSystem - Inverted Head & ShoulderTD Power Systems secured a ₹67 crore export order for traction motor components. This order is for delivery between 2026 and 2027
Inverted Head and Shoulder pattern. Pivot points plotted. Head would be ideal target. Right shoulder low would be long term stoploss.
Motherson Sumi Wiring - Double Bottom & Head & Shoulder PatternMotherson Sumi Wiring is looking for a 50% jump from current price. Following are the factors:
Technical Analysis:
1. On weekly time frame, it is making a Double Bottom Pattern
2. On Weekly time frame it is making a Head & Shoulder Pattern
3. A confluence point along with strong weekly candle will take this price upwards
Fundamental Analysis:
1. Strong player in harness wiring
2. Supplying in top 10 automobile models - auto sector is in strong uptrend
3. New factories - Haryana, Pune and Gujarat - already clocked 200cr from these green field projects
A must in your portfolio.
Keep following @Cleaneasycharts as we provide "Right Stocks at Right Time at Right Price"
Cheers!!

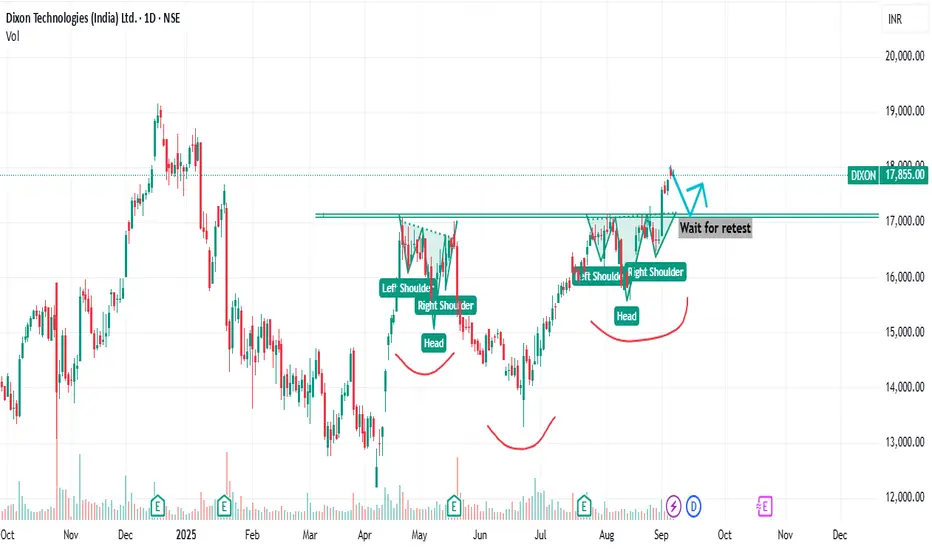
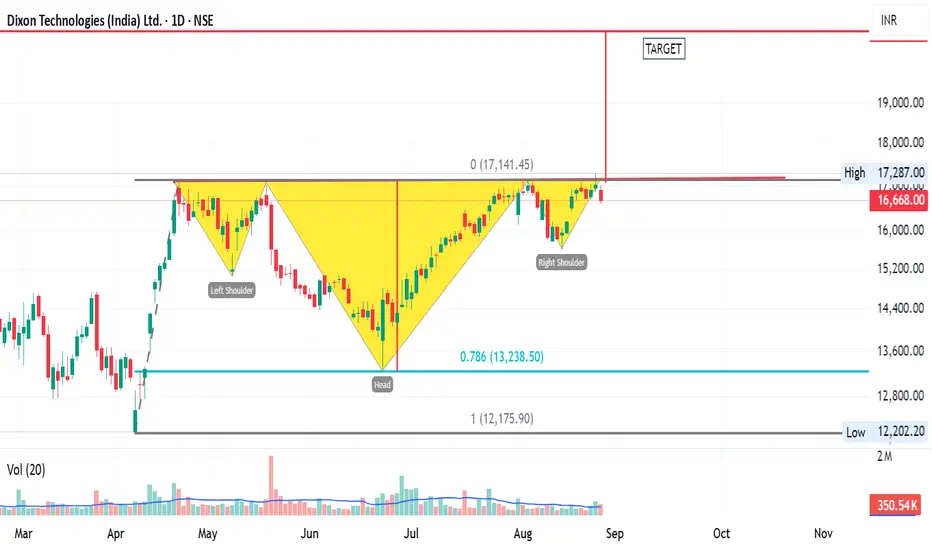
Multiple times testing breakout of H&SNSE:DIXON
Tested multiple time foe breakout, but this time shown the breakout wait for price to retest
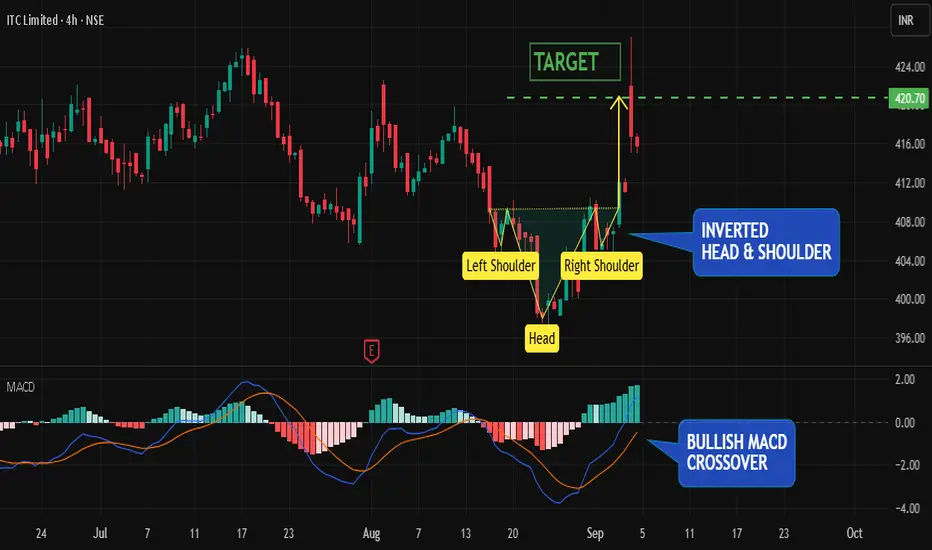
ITC Breaks Higher on Inverted Head & Shoulders Breakout-> Inverted Head & Shoulders Pattern -
ITC recently completed an Inverted Head & Shoulders formation , a strong bullish reversal pattern. The breakout above the neckline signaled renewed buying interest, and recent price action confirmed that momentum with a decisive upward move.
-> Bullish MACD Crossover -
Adding strength to the breakout, the MACD line crossed above the Signal line few days back, confirming a bullish crossover. This technical indicator reinforces the positive sentiment and indicates strong momentum building in favor of the bulls. The combination of pattern breakout and indicator alignment explains recent upward surge.
=> NOTE -
Bullish momentum of this pattern is over as target has been reached
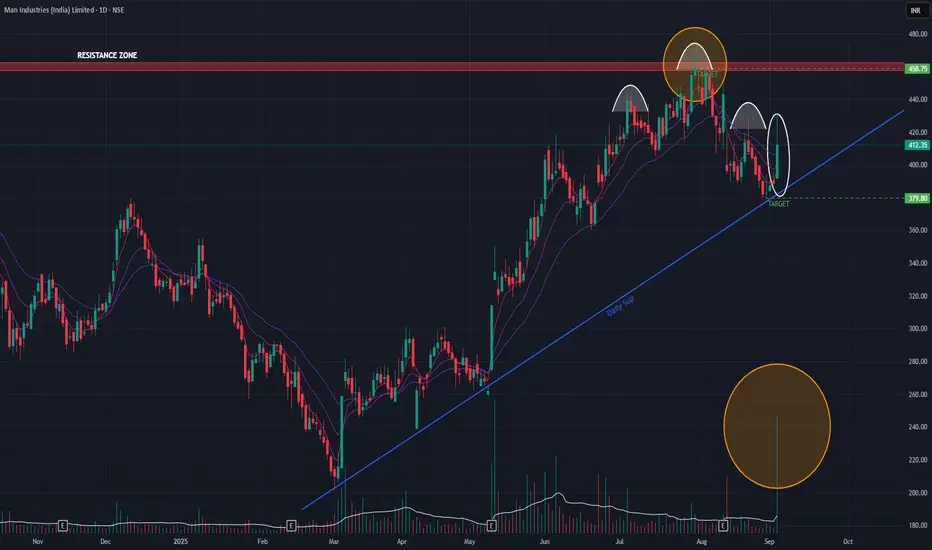
Man Industries (Daily Timeframe) - Upside or Downside??Man industries has been on an uptrend since March 03, 2025 and it tried to BreakOut of the key resistance zone, but invain. Today the stock gained 6% with huge volume. Since March 03, 2025, the stock has been respecting the angular support trendline while making Higher Lows. If we observe carefully, an H&S pattern is formed at the top which indicates a bearish trend. Short-term EMAs are also in Negative Cross-over state.
If the stock gains momentum on the upside, then it may rise to the range of 458. On the downside, the stock may reach the immediate support of 379.
To monitor.
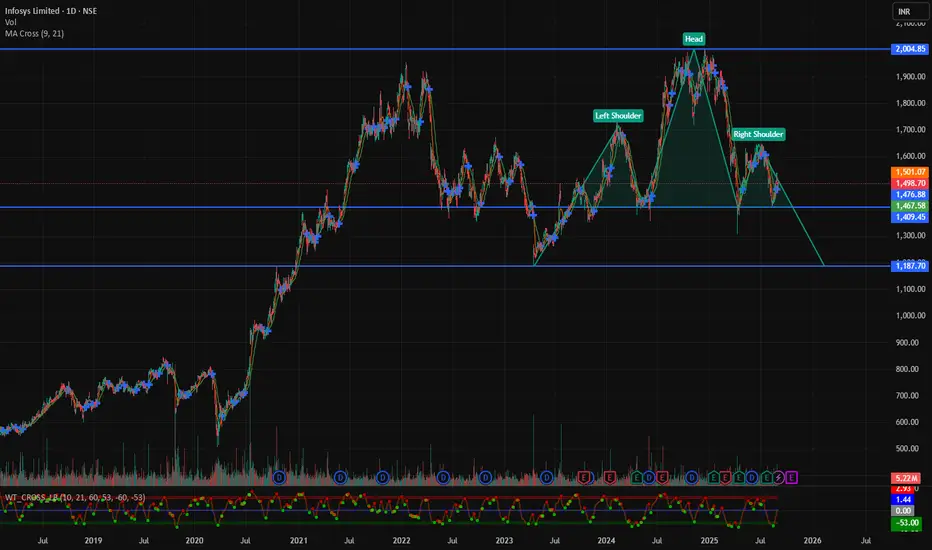
INFY showing head and shoulders pattern.
INFY might fall down to 1100 in spite of being fundamentally undervalued.
The stock might get carried away by weak nifty.
Crash of 25% possible.
Nifty Head & Shoulders Daily ChartsNifty Needs to Hold the Crucial Breakdown point of 24420.
Any Breakdown below this and holding in hourly Chart would be a confirmation of a bearish breakdown till 24000
With recent Rampage on tariffs it might be possible. Time to brace

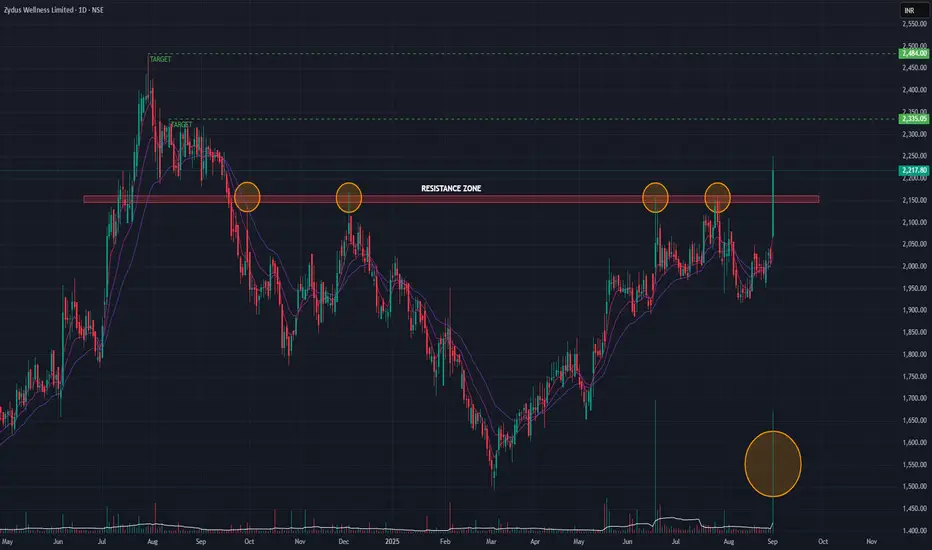
Zydus Wellness (Daily Timeframe) - Will it make new ATH?Zydus Wellness, ever since it made the All Time High, the stock was in a downtrend and then sideways for more than a year. Though it tried to breakout a key resistance level (as marked) multiple times, it could not breach the resistance zone. Today, it brokeout of the resistance zone with huge volume burst. The next few days of the stock moves in a positive direction, then it may reach 2335 levels which could be the first target.
Checking the weekly timeframe, we can see an inverted H&S pattern and without today's breakout, the stock has broken out of the H&S neckline. If we consider H&S pattern breakout, then the stock may reach new ATHs.
Inverse Head and Shoulder forming in DixonThe stock has formed Inverse Head and Shoulder pattern in daily time frame. But yet the breakout has not been done. It has retraced 78.6% of its last fall and bounced from there. Waiting for the breakout ,which hope should be done in very few days. lets see how it unfolds. Good luck and All the best. JUST FOR LEARNING AND EDUCATIONAL PURPOSE. Ty. JMK
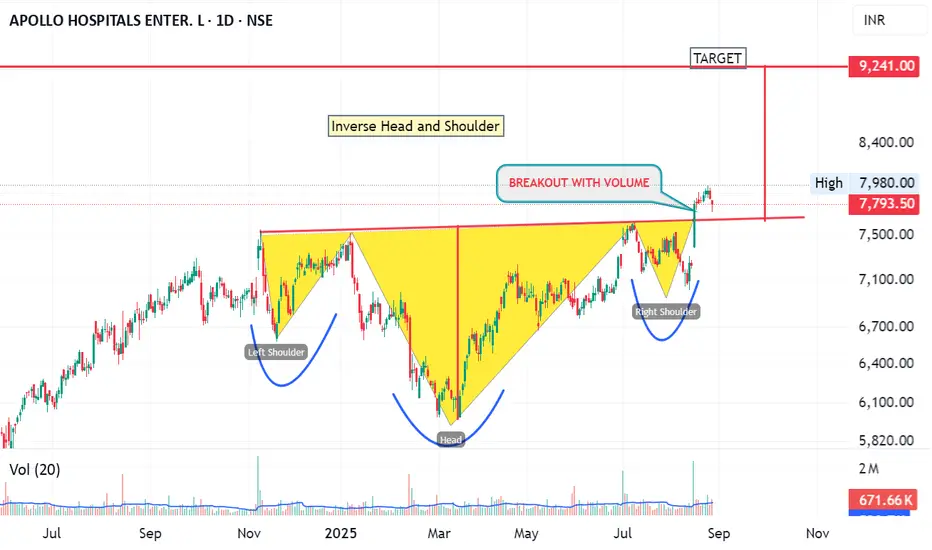
Inverse Head And Shoulder in Apollo HospitalsInverse Head and Shoulder pattern has been formed in Apollo Hospitals with a good volume breakout.Target is around 9241 appr.. With stoploss near 7000 levels. lets see how it unfolds. Good luck and All the best. Ty. JMK
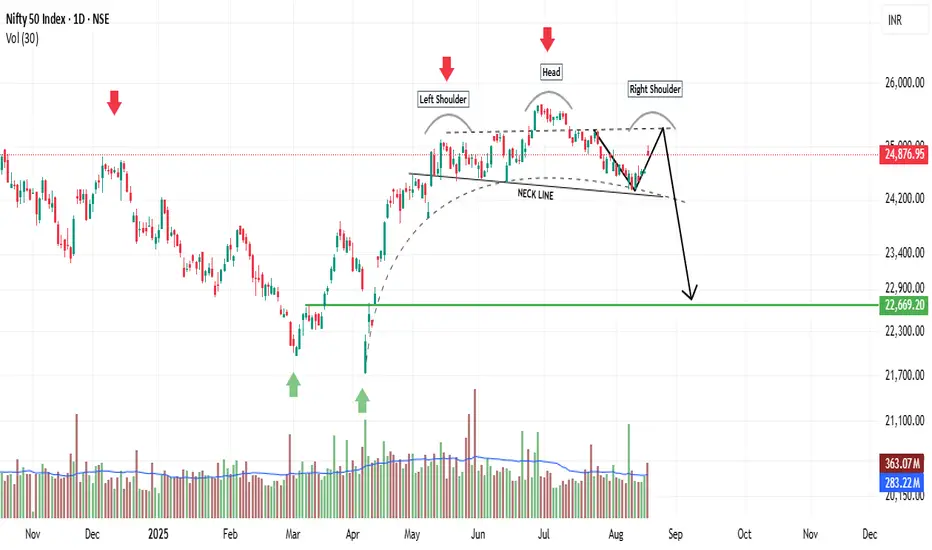
NIFTY50 - Head & Shoulders Pattern Signals Bearish RiskIn the 30-minute chart of NIFTY 50, a classic Head & Shoulders pattern has clearly emerged, which could act as a potential trend reversal signal. This pattern often appears near the end of a bullish phase and can warn traders of a short-term or medium-term top.
The Left Shoulder formed around 20th August, followed by a sharp rally into the Head near 25,150 levels on 22nd August. The price then retraced to the neckline support zone around 24,850, bounced to create the Right Shoulder, and is now hovering just above this critical support.
Support Zone Becomes a Decider
The support zone between 24,850 and 24,880 has now become the key level to watch. A clean break below this neckline support could activate the pattern, confirming a bearish breakdown with a projected target near 24,600 and possibly extending towards 24,450 if momentum builds.
However, the pattern is not yet confirmed. Price is still within the formation, and a strong bounce from this support level could invalidate the breakdown scenario, potentially triggering a short-covering rally.
What Traders Should Monitor
- Breakdown Confirmation: A 30-min candle closing below 24,850 with increasing volume is necessary to confirm the bearish setup.
- Invalidation Point: If the index breaks above 25,050, the right shoulder fails, and the pattern gets invalidated.
- Target Calculation: The vertical distance from the Head (25,150) to the neckline (24,850) is approx. 300 points, which gives a downside target near 24,550.
Risk Management
- Aggressive Sellers: Can enter short below 24,850 on confirmation, keeping a tight SL above 25,000.
- Conservative Approach: Wait for retest of broken support or enter only if price starts forming lower highs below the neckline.
- No Entry Yet: The structure is not triggered yet. Premature trades can lead to whipsaws.
Conclusion
This Head & Shoulders setup in NIFTY 50 is worth tracking closely. If confirmed, it can offer a high-probability short trade in the coming sessions. However, until the neckline breaks with conviction, traders must maintain caution and avoid early entries. The market is currently at a make-or-break point, and the next move will likely set the tone for the week ahead.

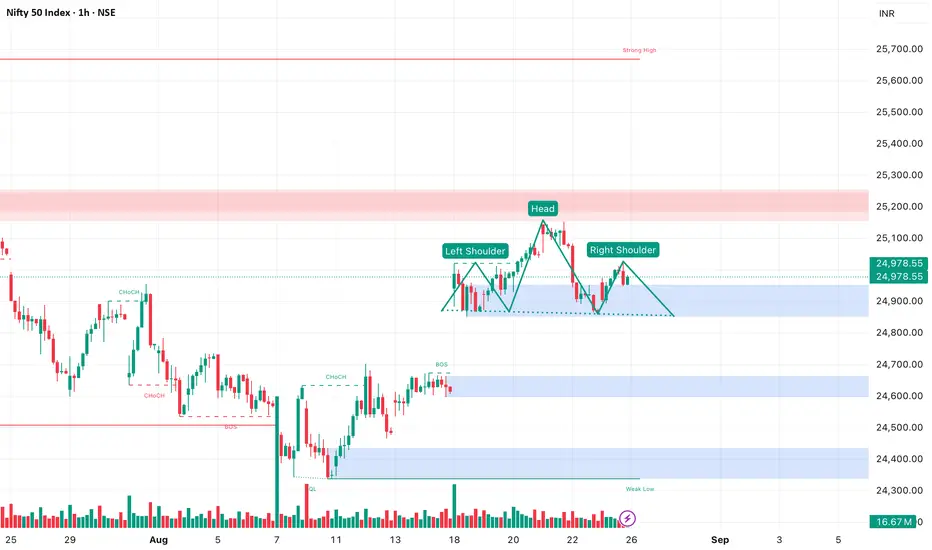
“Nifty 1H Analysis: Head & Shoulders Setup + Unfilled Gap”Nifty on the 1H timeframe is showing signs of a possible Head & Shoulders formation, which could indicate a short-term reversal if the neckline breaks. Currently, price action is between neckline and the right shoulder. Traders should watch the neckline level closely for confirmation.
📌 Key Note: There’s also an unfilled gap left around the 22,660–24,850 zone, which may act as a magnet for price action after H&S neckline breakout.
⚠️ This is not financial advice — just my personal market observation. Manage risk accordingly.
#Nifty #Nifty50 #TechnicalAnalysis #HeadAndShoulders #PriceAction #GapTrading #NSEIndia #StockMarketIndia #IndexTrading #ChartPatterns #SwingTrading
NIFTY About to crash? H&S Breakdown?After buying rallying from 21743 to 25669 Nifty 50 is showing LL LH formation.
A Head & Shoulders (H&S) pattern on the daily charts is being formed. The right shoulder just got rejected at the same zone where the left shoulder was formed.
Lower High formation: The Previous high of 25250 is not breached, and a new lower high formed at 25150.
H&S Pattern visible: Head at ~25669, shoulders around ~25200. Base of H&S can be considered at 24450.
H&S Target: Possible downmove of 1200 points (distance from base to head) downside till 23250 . Consequently, this is also a 61.8% retracement of the full buying rally
Weekly Gap Pending: 24600–24630 is the first target due to the gap.
Next big support: 24000, which is a psychological round number + pending gap. This is a likely bounce area if 24,450 doesn’t hold.
More support:
23750: 50% Fibonacci level of buying trend
22830: Weekly gap

Nifty IT Index 1WLooks like forming Head & shoulder pattern in weekly chart and confirmation is below 32000 based upon weekly closing and it reflects on some IT stocks also

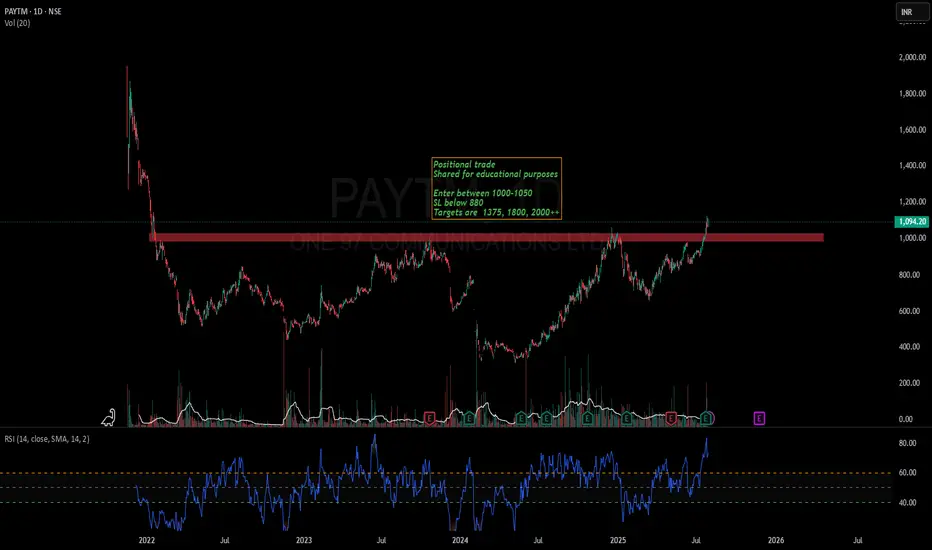
Paytm-A new ATH is coming soonPaytm has finally closed above its long term resistance of 1000.
Stock has potential to cross 2000 in near future
Keep stock in watchlist
Stock has also formed a kind of inverted head and shoulder pattern.
Not a recommendation. Watch and learn.
Inv Head and Shoulder in Supreme industriesVery good reversal in supreme industries.
It can reach nr All time high.
This has also bounced nr weekly 200ma
Since it is spotted on weekly targets can come in 4~6 months time.

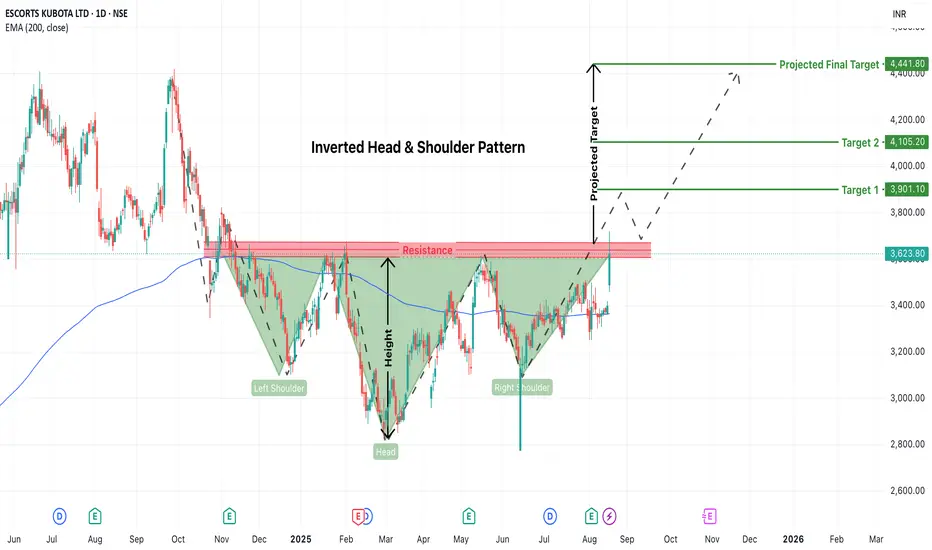
ESCORTS Potential Breakout Alert: Inverted Head & ShoulderThe chart of ESCORTS KUBOTA LTD (daily timeframe) is currently displaying a well-formed Inverted Head and Shoulder pattern, a powerful reversal setup often seen at the end of prolonged downtrends. This pattern suggests a shift in momentum from bearish to bullish—but the key breakout level still remains unconfirmed.
The left shoulder formed around November 2024, the head during March 2025, and the right shoulder recently shaped up through June and July 2025. The neckline resistance, drawn near the ₹3,580–₹3,620 zone, has been tested multiple times but has not yet been breached with conviction. A successful breakout above this resistance zone with strong volume would validate the pattern and signal a potential upside move.
At the moment, the price is hovering just around the neckline, attempting to build enough momentum to push through. This indicates a decision point—either the bulls gather strength to break out and push the stock higher, or the neckline acts as a ceiling, resulting in another round of consolidation or even a reversal.
Until confirmation, it remains a watchlist stock rather than an immediate entry.
Head and shoulders pattern in NiftyThe head and shoulders pattern is a technical analysis chart pattern used in trading to predict potential reversals in price trends. It’s primarily a bearish reversal pattern that appears after an uptrend, signaling that the price may soon decline.
In the NIFTY
The pattern forms during an established uptrend, where prices are consistently making higher highs and higher lows from 07 April,2025
Left Shoulder: The price rises to a peak (a high) and then declines to a support level (a low), forming the first shoulder.( NEAR 25147-25253)
Head: The price rises again, surpassing the left shoulder’s high, reaching the highest point (the head), and then declines back to a similar support level as the left shoulder.(NEAR 25670)
Right Shoulder: The price rises once more but fails to reach the head’s high, forming a lower peak (the right shoulder), and then declines again. (NEAR 25100-25250)
Neckline: The line connecting the lows of the left shoulder, head, and right shoulder acts as a support level. It can be horizontal, sloped upward, or sloped downward, depending on the price action.( NEAR 24300)
Breakout Confirmation
The pattern is confirmed when the price breaks below the neckline after forming the right shoulder in a bearish head and shoulders pattern. This breakout signals that the uptrend is reversing into a downtrend.
So, I expect a good bearish move end of the week.