BTC Head & Shoulders Alert – Possible Breakdown!🚨 BTC Head & Shoulders Alert – Possible Breakdown! 🚨
Bitcoin is showing a clear Head & Shoulders pattern on the 15m chart.
Price is hovering near the $118,500 neckline, with sellers trying to push lower.
🔹 Key Levels:
Pattern: Head & Shoulders – bearish reversal setup
Breakdown Zone: Around $118,500
Immediate Support: $117,637
Major Target: $116,605 (measured move from pattern)
Invalidation: A close above $118,913 could flip bias bullish
📌 Plan:
Watch if BTC sustains below $118,500. If confirmed, bears could aim for $117,600 and then $116,600. Bulls need to reclaim $118,913 to negate the setup.
#Bitcoin #BTC #CryptoTrading #HeadAndShoulders #BTCAnalysis #PriceAction #CryptoSignals #BitcoinPrice #TradingSetup #CryptoCommunity #DayTrading #TechnicalAnalysis #CryptoMarkets
Head and Shoulders

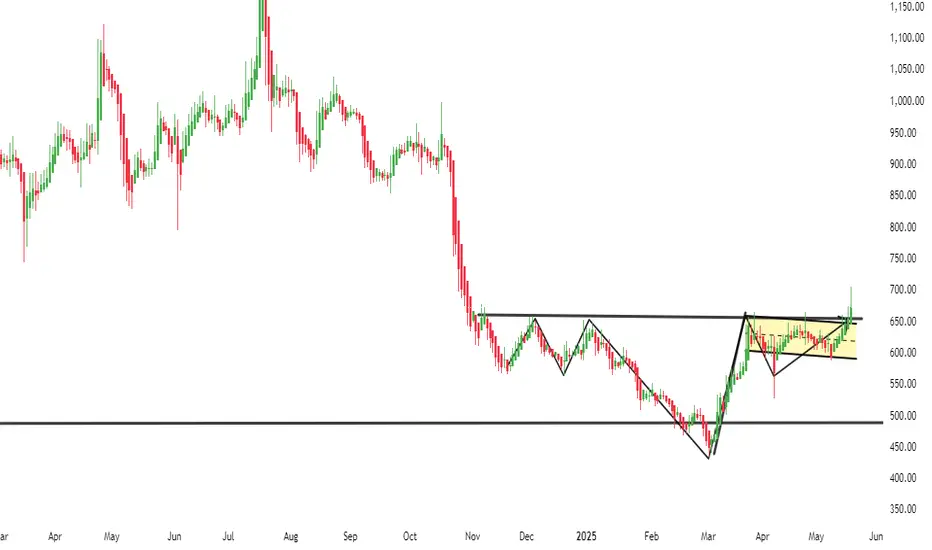
CHENNAI PETRO-BLEND OF TECHNOFUNDABuy CHENNAI PETRO 680 TILL 610 FOR target of 740 and 850. Classic blend of fundamental a technical analysis. Bullish flag and inverse head & shoulder breakout happening at 630 levels.
Also available near P to B/V with dividend yield above 8%.
view invalid below 580.
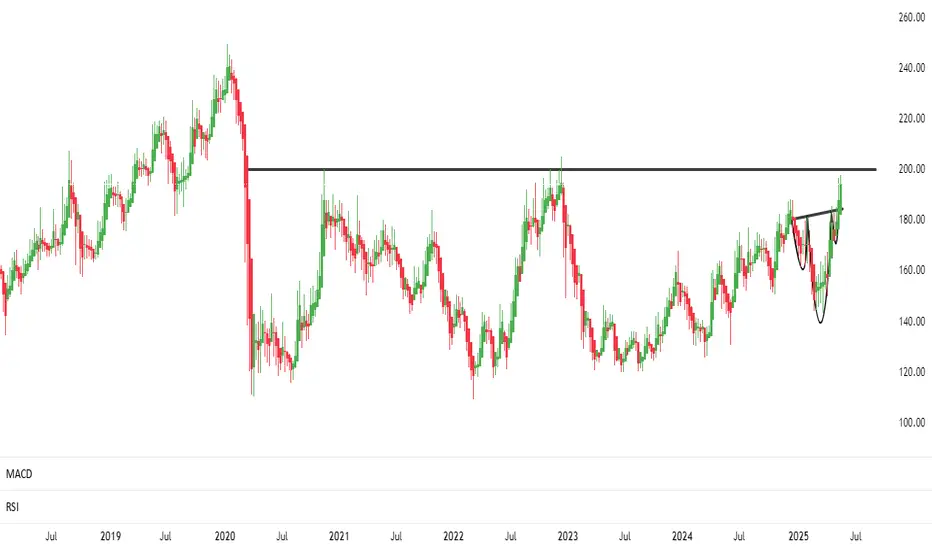
CITY UNION BANK- BREAKOUT HAPPENINGCUB 196, breakout happening with inverse h&s pattern. Stock having resistance at multi year range of 202-205. Above that stock is ready for 240 levels.
short to medium term trend is bullish now.
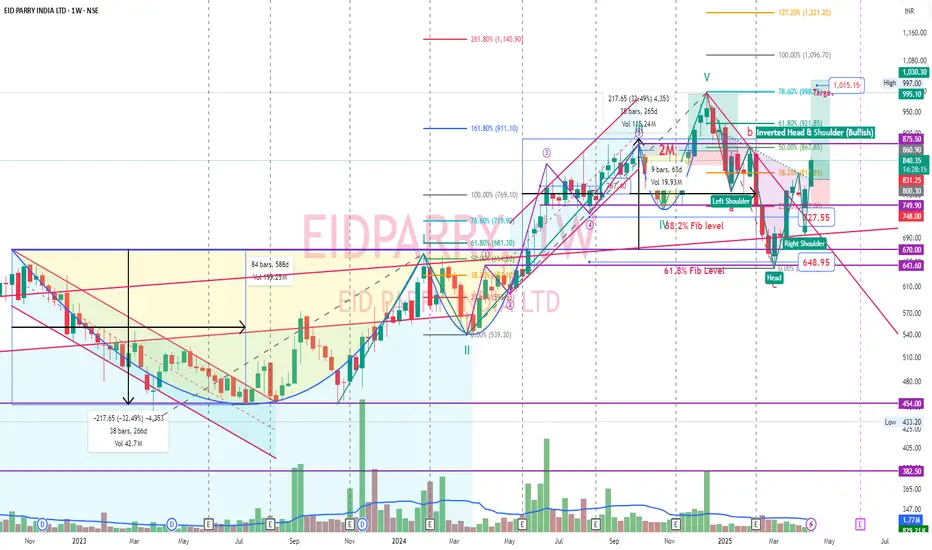
EID Parry - Inverted Head and Shoulder - BullishEID Parry is one of the top fundamental company in sugar industry. And EID parry is among the Murugappa group of companies. One should watch Murugappa group of companies. They are all very good.
Seeking to curb carbon emissions, India aims to increase the share of ethanol in gasoline to 20 percent by 2025-26, from 13 percent -14 percent now. Indian sugar mills such as E.I.D.-Parry Balrampur Chini Mills Shree Renuka Bajaj Hindusthan and Dwarikesh Sugar have increased their ethanol production capacity in the last few years.
After reaching Cup & handle target, stock just completed correction cycle and now made inverted head and shoulder bullish pattern. Head height of 230 points is the target after breakout which comes around 1015 where Pivot R3 also there in daily timeframe.
Weekly RSI has made double bottom and is looking good. MaCD is on the rise. Volume was good on breakout on Apr 15 making inverted head and shoulder bullish pattern in daily timeframe.
Custom Index - Sugar - Inverted H&SMade custom index with sugar after hitting previous targets now inverted head and shoulder in progress. Holding EID parry. Ethanol blending story plays well.
India hits 20% ethanol blending milestone in early 2025—six years ahead of the original target of 2030

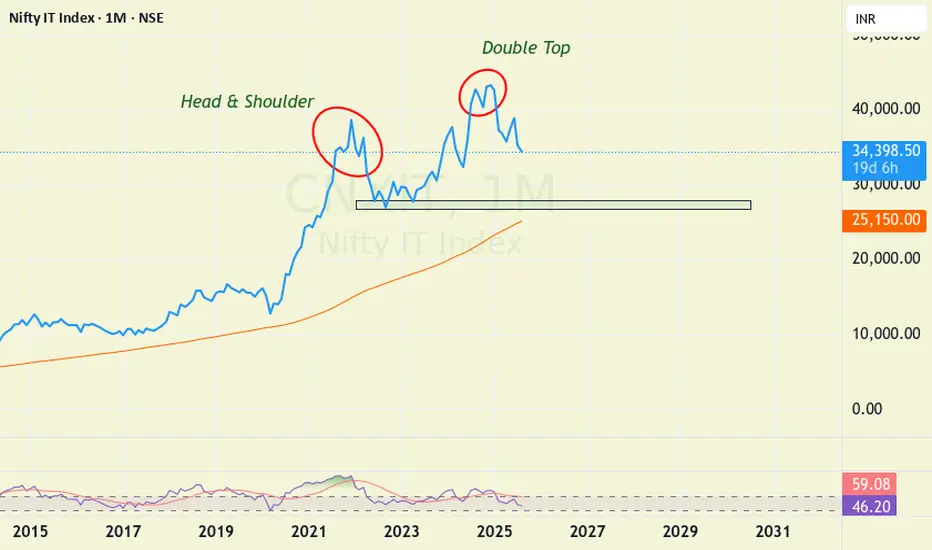
Bearish patterns in Nifty ITOn monthly we see multiple bearish patterns in IT index.
Over long term we can see that this index takes support near 100 SMA on monthly.
Currently this index is in down trend and in worst case can see support nr 29000 levels. Which also coincides with earlier buying zone.
I would avoid IT till I find some good bottoming out pattern.
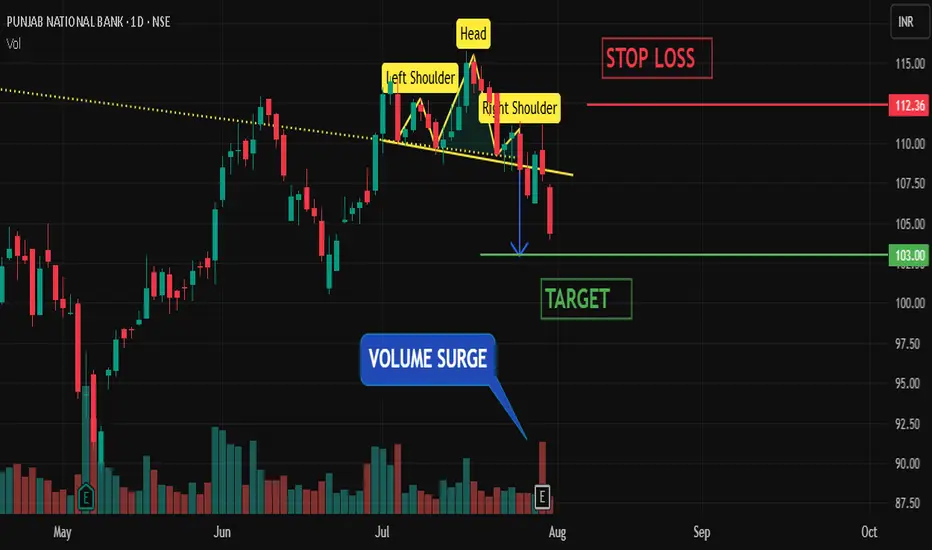
PNB Breakdown Alert: Further Downside Likely📊 TECHNICAL INDICATOR ANALYSIS – PNB BEARISH OUTLOOK
🔻 1. HEAD & SHOULDERS PATTERN FORMATION
PNB has formed a CLASSIC HEAD AND SHOULDERS PATTERN, a strong bearish reversal signal. The breakdown below the neckline confirms the end of the previous uptrend and suggests a shift in sentiment toward the downside.
📉 2. VOLUME SURGE ON BREAKDOWN :
A SIGNIFICANT SPIKE IN VOLUME was observed during the breakdown, reinforcing the bearish pattern. Volume confirmation is crucial, and in this case, it shows that sellers are aggressively stepping in to drive the price lower.
📉 3. BEARISH MACD CROSSOVER :
The MACD LINE HAS CROSSED BELOW THE SIGNAL LINE, a key momentum-based sell signal. This bearish crossover aligns with the breakdown and volume, indicating that downside momentum is likely to accelerate.
🎯 TRADE SETUP :
✅ TARGET: ₹103
❌ STOP LOSS: ₹112.5
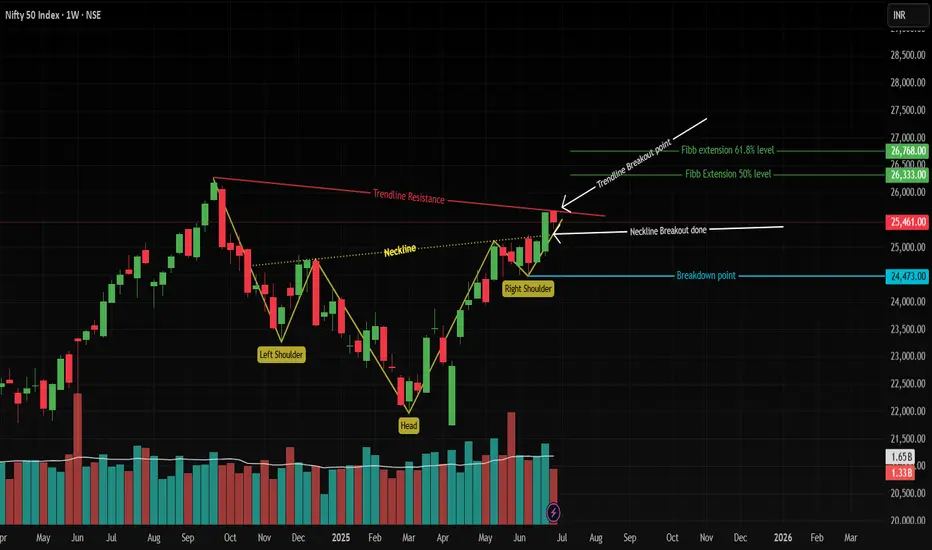
Nifty 50 Weekly: Inverted H&S Breakout Confirmation Awaited!Pattern & Breakout:
Inverted Head & Shoulders formed on the weekly chart (bullish reversal pattern). ✅
Neckline breakout occurred last week, but confirmation pending! This week failed to close above breakout level.
Confluence Alert: Weekly close above breakout level = Trendline resistance (red) breakout! 🚀
Targets (If Confirmed):
50% Fib extension: 26,333 📈
61.8% Fib extension: 26,768 🎯
(Fib drawn from 3rd March 2025 swing)
Key Invalidation:
Right Shoulder Low: 24,473 (blue line). Break below = pattern failed! ⚠️
Action Plan:
Wait for weekly close ABOVE neckline breakout.
Enter longs on confirmation (targets: 26,333 → 26,768).
Stop loss: Below 24,473.
Disclaimer:
This analysis is for educational purposes only. Trade at your own risk. Past performance isn’t indicative of future results. Always conduct your own research or consult a financial advisor. 📉💰
Boost visibility: 👍 Like | 💬 Comment | 🔔 Follow
RBL BANK CUP AND HANDLEThe Stock Has Formed Cup And Handle. It is near its major resistance, its consolidating below it,so waiting for the breakout. Once the breakout is done, it may see its first target as marked, rest targets will be marked as the charts unfold. so its awaited for the breakout. Hoping the best.
Also Inverse Head & Shoulder forming,which will be completed at the first target.good luck. ty. JMK

HEROMOTOCO Breakout Alert: Inverted Head & Shoulder PatternHero MotoCorp Ltd has formed a classic Inverted Head and Shoulders pattern on the daily timeframe, a strong indication of a potential bullish trend reversal. This pattern, combined with a breakout above the neckline and support from the 200 EMA, presents a high-probability long setup. This post details the trade plan, key levels, and conditions to validate or invalidate the move.
Chart Analysis Summary:
The stock closed at ₹4,535.90 with a powerful bullish candle, up by 5.20% for the day. This breakout move has occurred after months of consolidation and pattern development. The 200 EMA, which acted as dynamic resistance around ₹4,294, has now been breached with strong momentum, adding further bullish confidence.
The left shoulder of this pattern formed around November–December 2024, the head bottomed out near April 2025, and the right shoulder was developed during June–July 2025. The neckline, placed between ₹4,500 and ₹4,550, was the final resistance, which has now been broken decisively.
Trade Plan & Entry Strategy
If you’ve missed the breakout candle, don’t worry. The ideal approach now is to wait for a retest of the neckline zone, which lies around ₹4,500–₹4,550. If price comes down and finds support here, then traders should watch for bullish candlestick patterns on lower timeframes (like 1H or 4H) before entering. This ensures a high-probability entry with manageable risk.
For aggressive traders, early entries can be considered at current levels, but only with strict risk management and stop-loss placement below the neckline or the last swing low. If the retest holds and bullish momentum continues, this setup has the potential to deliver a clean rally.
Target Zones
The first target for this setup is ₹5,000, which acts as an important psychological and technical resistance. It’s a good point for partial profit booking or trailing stop adjustments. The final projected target based on the height of the pattern is ₹5,480. This level marks the completion of the measured move and can be used for full profit booking if the trend remains intact.
Risk & Invalidation Level
This setup will be considered invalid if the price drops and closes below ₹4,200, which is the base of the right shoulder. A breakdown below this support would indicate that the bullish structure has failed, and the stock may revisit lower zones.
Why This Setup is High-Quality
The Inverted Head & Shoulders is one of the most reliable reversal patterns in technical analysis. In this case, the breakout is supported by strong volume (not shown in the chart), a decisive close above the neckline, and a 200 EMA crossover, all of which provide strong technical confluence. The structure is clean, and the breakout level is clearly defined. Risk is limited and reward is substantial — a great setup for swing or positional trades.
Hero MotoCorp is showing early signs of a potential trend reversal after months of correction and consolidation. The breakout from the Inverted Head & Shoulders pattern offers a golden opportunity for traders looking for bullish setups. If the neckline retest confirms, this trade can offer a great reward-to-risk ratio targeting 5,000 and beyond. As always, patience and disciplined execution are key.

BATAINDIA LONGThe Elliott Wave Theory's description of the structure and pattern of price movements in financial markets is known as the Elliott Wave Structure.
The Elliott Wave analysis indicates that the stock has completed waves (i) and (ii), which are shown as blue numbers on the daily chart. Wave (iii) appears to be underway at this time.
Wave (iii), also known as the impulse wave, unfolded into five waves, which are illustrated in red.
Wave levels are depicted on the chart.
An inverted Head and Shoulder Pattern is formed on the chart and the target is shown on the chart. (The Inverted Head and Shoulder Pattern is a bullish reversal pattern).
Level of Invalidation
The invalidation level of 1269 has been identified as the start point of wave (i). If the price falls below this level, it means that the projected Elliott Wave pattern is not as it appears.
I'm not a registered Sebi analyst. My research is done solely for academic purposes.
Please consult your financial advisor before trading or investing. I bear no responsibility for your profits or losses.
Regards,
Dr Vineet

Lauruslabs-It can fly towards ATH again!Lauruslabs has given a good breakout of trendline and horizontal resistance with volume.
Stock is looking strong for a reversal and can fly towards ATH if market supports.
Keep in watchlist.

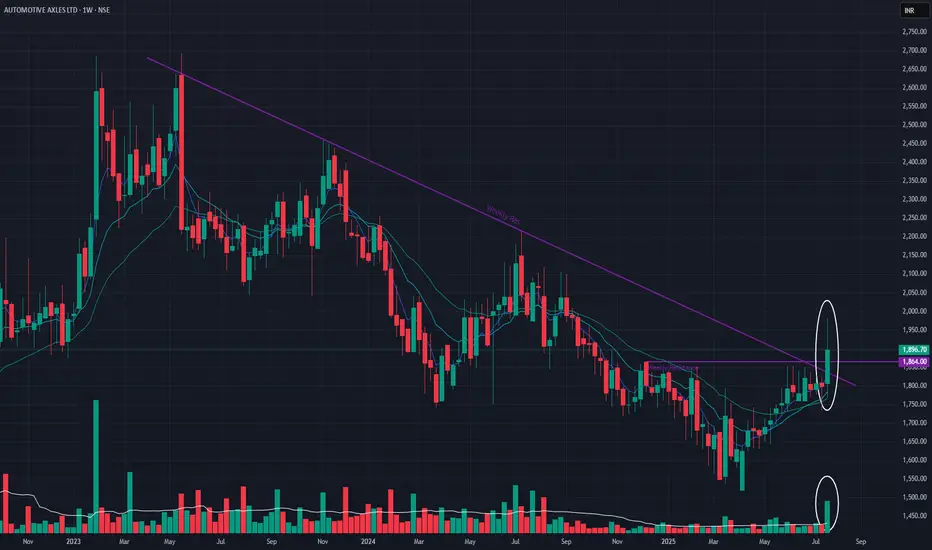
Automotive Axles Ltd (Weekly Timeframe) - Potential Reversal ??After the Double Top formation (May 15, 2023) in weekly timeframe, the stock has been in a downtrend. With this week's price action, the stock seems to BreakOut of a Weekly resistance zone with good volume. EMAs are also in positive state.
A Long-term angular resistance BreakOut along with Short-term resistance BreakOut makes this more significant to consider as a reversal sign. Watchout for next week's price action to determine if the reversal signs are intact or not. If it does, then the next target maybe 2,100.
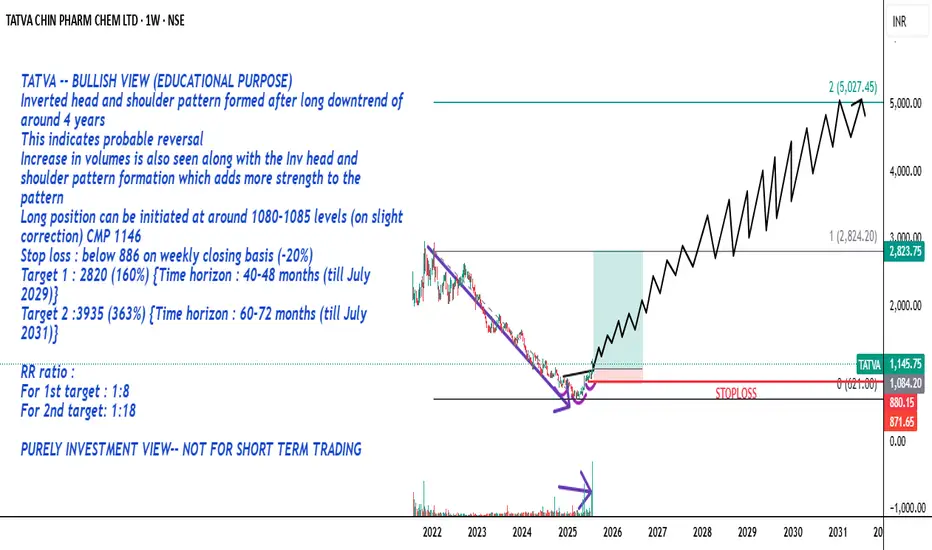
TATVA-- BULLISH VIEW (EDUCATIONAL PURPOSE)-- PRICE PATTERNTATVA -- BULLISH VIEW (EDUCATIONAL PURPOSE)
Inverted head and shoulder pattern formed after long downtrend of around 4 years
This indicates probable reversal
Increase in volumes is also seen along with the Inv head and shoulder pattern formation which adds more strength to the pattern
Long position can be initiated at around 1080-1085 levels (on slight correction) CMP 1146
Stop loss : below 886 on weekly closing basis (-20%)
Target 1 : 2820 (160%) {Time horizon : 40-48 months (till July 2029)}
Target 2 :3935 (363%) {Time horizon : 60-72 months (till July 2031)}
RR ratio :
For 1st target : 1:8
For 2nd target: 1:18
PURELY INVESTMENT VIEW-- NOT FOR SHORT TERM TRADING
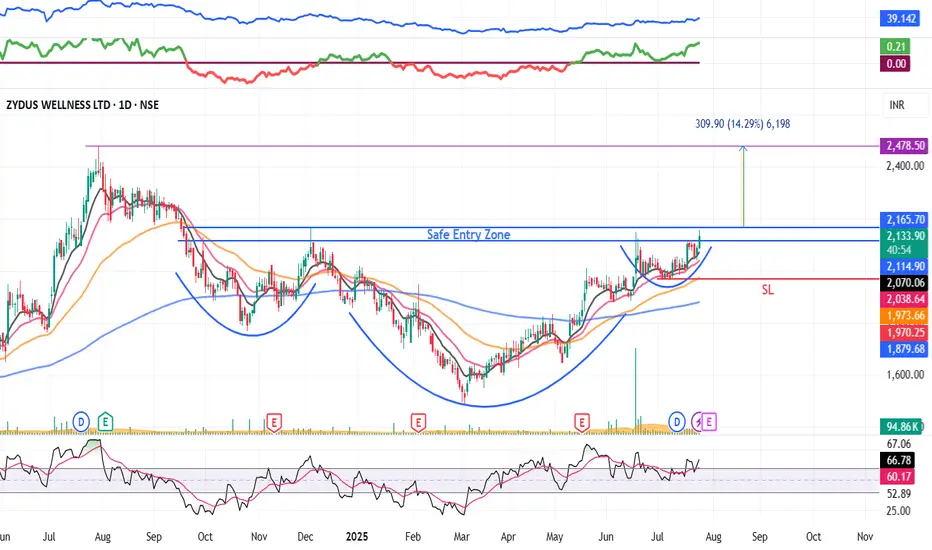
ZYDUSWELL : Inverse Head & Shoulder chart pattern#ZYDUSWELL #patterntrading #chartpattern #breakouttrading #inverseheadandshoulder #trendingstock
ZYDUSWELL : Swing Trade
>> Breakout candidate
>> Inverse Head & shoulder pattern
>> Trending stock
>> Good Strength & Volume
Swing Traders can lock profit at 10% and keep trailing
Pls comment, Boost & follow for more such Analysis
Disc : Charts shared are for Learning purpose and not a Trade recommendation. Consult a SEBI Registered advisor before taking position in it
JINDALSTEL : pattern breakout#JINDALSTEL #patterntrading #chartpatternbreakout #swingtrading
JINDALSTEL : Swing Trading
>> Breakout soon
>> Inverse Head & Shoulder pattern
>> Good Strength & Volumes Buildup
>> Trending setup
Swing Traders can lock profits at 10% and keep Trailing
Pls boost, Comment & Follow for more Analysis
Disc : Charts shared are for Learning purpose and not a Trade recommendation. Pls consult your Financial Advisor or a SEBI Registered Advisor before taking position in it

A possible Head and Shoulder formation in BankniftyChance of a head and shoulder formation on the hourly chart of the Index.
If the market clears the resistance line around 57300, it can form another high or test the recent high made.
On the lower side, there is are support and it may respect the support levels.
Major support levels :- 56800, 56640
Resistance levels :- 57285, 57600
Wait for the market to move above the neck line for any bullish trade to enter in the index. Else bearish trade can be initiated below 56650 levels.
Watch for the price action near the price levels before entering the trade.

AARTIDRUGS | Inverted Head & ShouldersAarti Drugs (#NSE: #AARTIDRUGS) based on the chart and investment notes.
🔍 Technical Analysis:
🧠 Pattern:
Inverted Head & Shoulders (H&S) – Classic reversal pattern.
Breakout confirmed above the neckline (~₹496), now retesting and holding above ₹523.
Projection: Neckline to Head depth: ~₹184
Target: ₹496 + ₹184 = ₹680–685
🔑 Key Levels:
Support: ₹482(neckline), then ₹440–450
Resistance: ₹644.50 (historical), then ₹683–685 (pattern target)
Volume: Decent rise during breakout, confirming strength.
📉 Risk:
If the price breaks back below ₹496 with volume, the setup weakens.
Keep stop-loss below ₹468 swing low.
💹 Fundamental Insights :
Metric Comment
🏗️ Capex ₹600 Cr completed, expansion nearly done 🔁 Turnover 2.5x → Significant revenue efficiency 💰 Revenue Impact ₹1500 Cr new capacity to kick in 📈 Margin Expansion - Utilization to improve → better margins
💹 Return Ratios RoCE and RoE likely to improve
💵 Shareholder Returns 15–30% of PAT to be distributed
🧠 Interpretation:
Capex cycle ending = lower costs + higher output.
ROCE + RoE expansion + PAT payout = strong re-rating candidate.
Operating leverage + volume growth = multi-quarter compounding story.
📆 What to Expect Next Week (22–26 July 2025):
Scenario Expectation
📈 Bullish (likely)
Follow-through rally toward ₹550–₹575 in short term
🔄 Sideways
Retest ₹496–510 zone before heading higher
📉 Bearish (low chance)
Breakdown below ₹496 would delay the up move
✅ Summary:
Factor Signal Chart
✅ Inverted H&S breakout
Fundamentals
✅ Strong capex-led growth + margin + return expansion
Volume
✅ Supporting breakout
Risk Management
Use SL below ₹468
Short-term Target
₹550–575
Medium-term Target
₹644–683


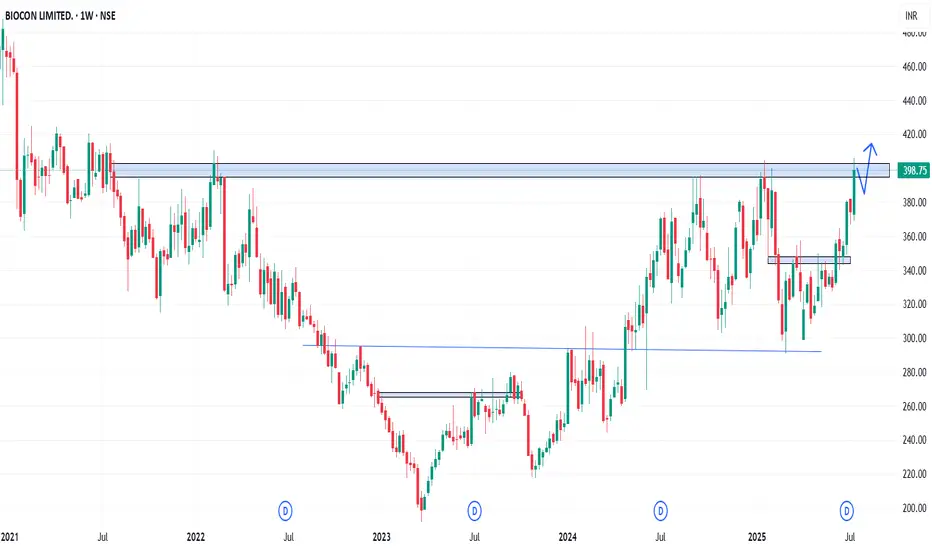
BIOCON - Weekly AnalysisIn the Weekly Chart of BIOCON ,
we can see that, it is about to give Inverted Head & Shoulder.
Expected momentum are shown in chart.
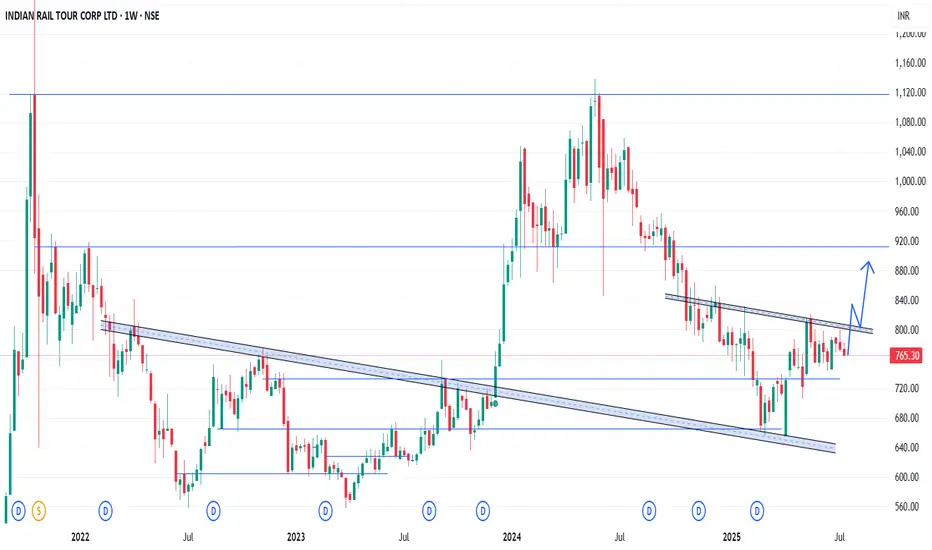
IRCTC - Weekly AnalysisIn the Weekly Chart of IRCTC ,
we can see that, it is about to give Inverted Head & Shoulder.
Expected momentum are shown in chart.
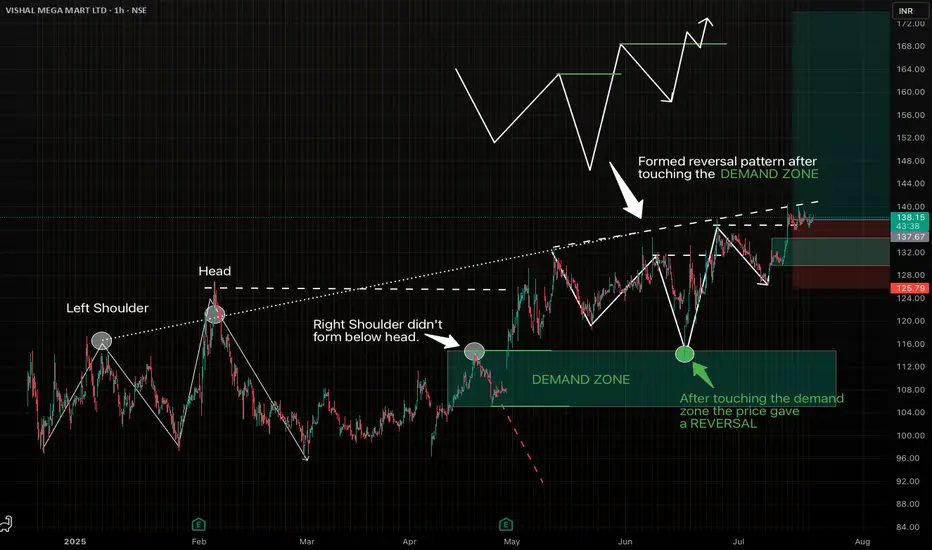
Strong reversal pattern on VMM. Looks good for swing trade.Spotted a beautiful setup on VISHAL MEGA MART LTD (1H Chart), following my favourite "Elevated Right Shoulder" pattern.
- The Left Shoulder and Head formed clearly.
- The Right Shoulder didn't go below the head, indicating ultra bullish structure and formed a demand zone.
- Price touched the Demand Zone and gave a perfect reversal.
-Clean entry with favourable risk-reward.
Let's see how it plays out.
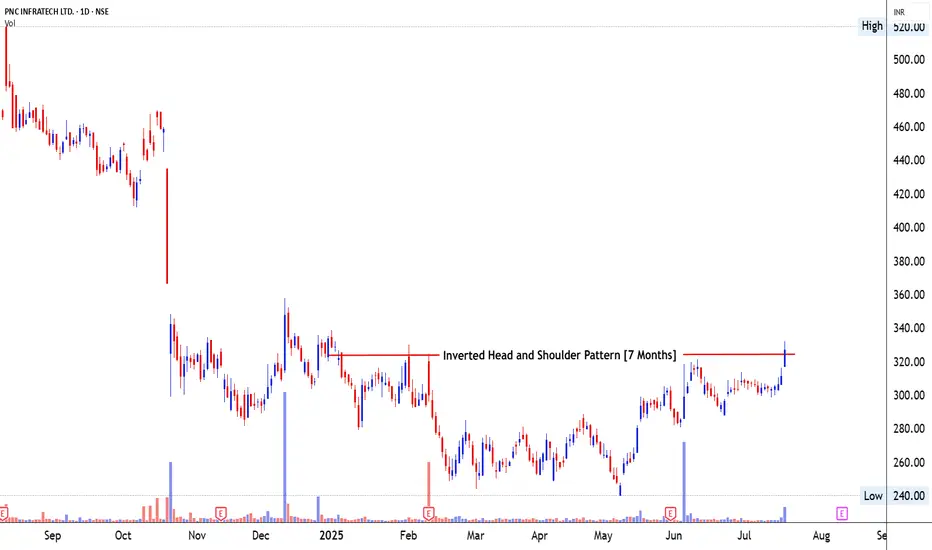
PNC Infra- Inverted Head and Shoulder Pattern1⃣ Pattern Structure & Breakout Development 📈
📐 Pattern Identification : Inverted Head and Shoulder Pattern – a powerful bottom reversal pattern, signaling the end of a prolonged downtrend and readiness for upside expansion.
⏳ Time Taken in Formation : The pattern matured over 7 months (from December 2024 to July 2025). This is an ideal duration on the daily chart, allowing institutional buildup and accumulation phases to complete.
📊 Price Trend Before the Pattern: The stock had been in a downtrend, falling from ₹410 to a bottom near ₹240. This decline created the structural base for the left shoulder, head, and right shoulder.
📦 Price Movement Inside the Pattern:
Left Shoulder: Dec 2024–Jan 2025; shallow decline and mild recovery.
Head: Mar 2025; price dropped to the lowest point near ₹240 with sharp volatility.
Right Shoulder: May–July 2025; a higher low formation, tight consolidation, and buildup under neckline resistance – ideal structural behavior before breakout.
🚀 Breakout Zone & Behavior : The neckline near ₹312 has now been decisively broken with a strong bullish candle closing at ₹330.50, confirming a clean breakout with momentum.
2⃣ Volume Behavior & Breakout Validity 🔍
📉 Volume During the Pattern : During the body of the pattern (especially March to May), volume remained below average, indicating supply exhaustion and absorption from stronger hands.
📈 Volume Before the Breakout: Noticeable volume rise in the right shoulder phase, suggesting institutional entry ahead of breakout — a positive preparatory signal.
💥 Volume on Breakout Candle: Today’s breakout came with 2.2M shares traded, one of the highest volume bars in the last 3 months — a key confirmation of genuine breakout strength.
🔮 Volume After Breakout – What to Expect: Sustained high volume in the next 2–3 days will help validate follow-through. If volume contracts but price holds above ₹312–₹315, a healthy retest may offer secondary entry.
3⃣ Candlestick Dynamics & Trap Awareness 🕯️
🔥 Candles Formed Before Breakout: Price showed gradual higher lows, small-bodied candles, and a tight range under resistance — classic signs of energy buildup before breakout.
💎 Breakout Candle Characteristics: Today's candle is a bullish marubozu — full body, minimal wick, closing near day’s high. This reflects strong buyer conviction and zero rejection at breakout point.
⚠️ Impact of the Breakout Candle: A textbook breakout — no signs of trap or exhaustion. However, traders must monitor whether price sustains above ₹312–₹315 in the coming sessions.
4⃣ Trade Setup – Entry, Exit & Risk Strategy 🛍️
🛡️ Safe Entry: Enter on retest near ₹315–₹318 with bullish candle confirmation — allows entry with structure-based stop-loss.
⚡ Aggressive Entry: Enter at current levels (₹330.50) on strength, with a tight stop below breakout zone.
🎯 Target Zones (Measured Move):
Pattern Height: ₹312 (neckline) – ₹240 (head) = ₹72
Target 1: ₹312 + ₹72 = ₹384
Target 2: ₹410 (previous supply zone and gap resistance)
🚩 Stop-loss Placement :
Safe: SL below breakout zone ~₹308
Aggressive: SL near swing low ~₹315
⚖️ Risk**:Reward**** Planning:**
Safe: Entry ₹318 / SL ₹308 / Target ₹384 → R**:R**** ≈ 1:6.6**
Aggressive: Entry ₹330.50 / SL ₹315 / Target ₹384 → R**:R**** ≈ 1:3.6**
5⃣ SEBI Disclosure – Educational Purpose Only 📜
“This report is for educational purposes only and does not offer investment advice. Mr. Chartist (Rohit Singh) is a SEBI Registered Research Analyst under the Investology (INH000012376). Please consult a SEBI-registered advisor before taking any investment decisions. All investments carry risk. Past performance is not a guarantee of future results.”