Inverse Head and Shoulders Pattern - IOCIndian Oil Corporation
Indian Oil Corporation Ltd is a Maharatna Company controlled by GOI that has business interests straddling the entire hydrocarbon value chain - from Refining, Pipeline transportation and marketing of Petroleum products to R&D, Exploration & production, marketing of natural gas and petrochemicals. It has the leadership position in the Oil refining & petroleum marketing sector of India.
Current Price ₹ 143
Stock P/E 16.7
Industry PE 20.2
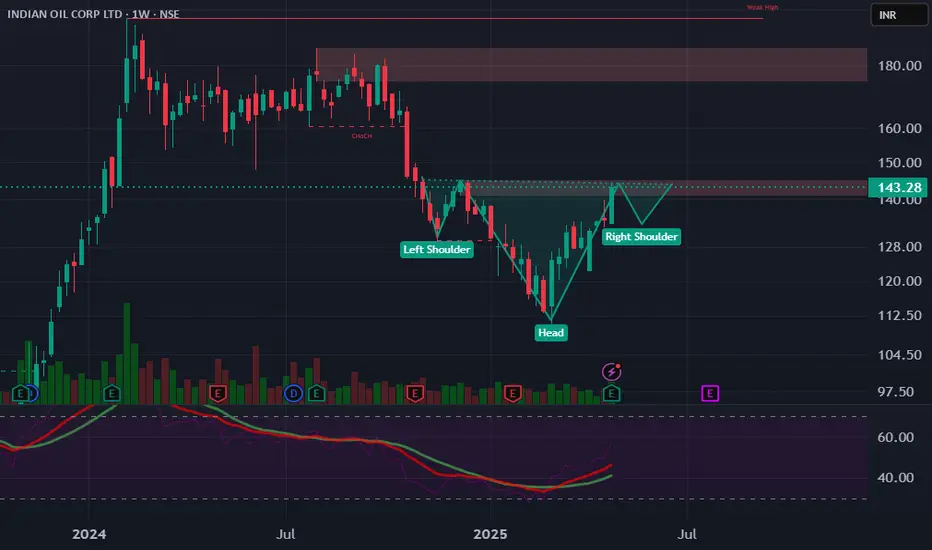
Stock now trade November 2024 onwards stock pattern formed. May month pattern completed shortly. Once pattern completed Next Final Target 180+
IOC pattern Inverse head and shoulder pattern complete may month end, shortly breakout will happen. Now stock trade 143 shortly will come down right shoulder 130 below and next upside move 145 . Once close 145 above start uptrend.
Final Target 180+
Head and Shoulders
IOCHello & welcome to this analysis
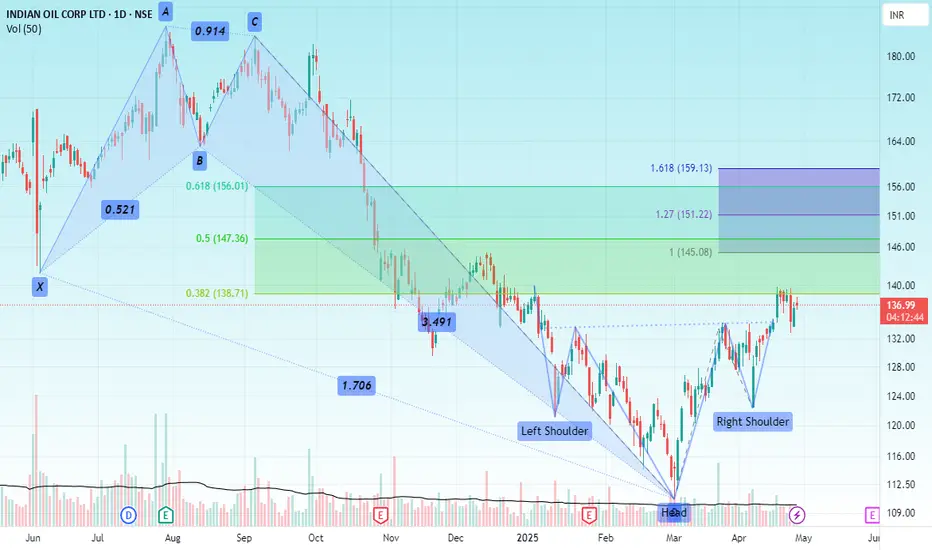
A deep 6 months correction lead to the formation of a Bullish Harmonic Crab pattern in March 2025 post which during accumulation (consolidation) phase formed an Inverse Head & Shoulder.
A 38% retracement of the bullish harmonic pattern has been done and now its completing a pullback of the IHS breakout by retesting the neckline.
Potential upside levels are 145 and 160 for both the IHS & Bullish Harmonic Crab
All the best
HEAD & SHOULDERS IN GOLD - WATCH THAT NECKLINESymbol - XAUUSD
CMP - 3288
Gold, after a sharp decline, is now trading and consolidating at important levels. The recent movement follows a strong sell-off as geopolitical and tariff-related issues between the US and China began to ease. This decline pushed gold back from its all-time high of 3500, with the metal currently hovering near key support.
The market remains cautious, with attention shifting toward potential shifts in FED policy and broader macroeconomic cues.
A Head & Shoulders pattern is in formation, with gold currently testing its neckline around the critical support zone of 3300–3287. A breakdown and retest of this level may trigger further downside momentum, potentially opening the path toward 3220 and 3075 on a positional basis.
Key Resistance Levels: 3300, 3317
Key Support Levels: 3288, 3215, 3122, 3075
From a technical perspective, gold remains within a corrective structure, maintaining a bearish outlook. Attention is now on the Head & Shoulders neckline - if it breaks to the downside and retests, short positions can be initiated.

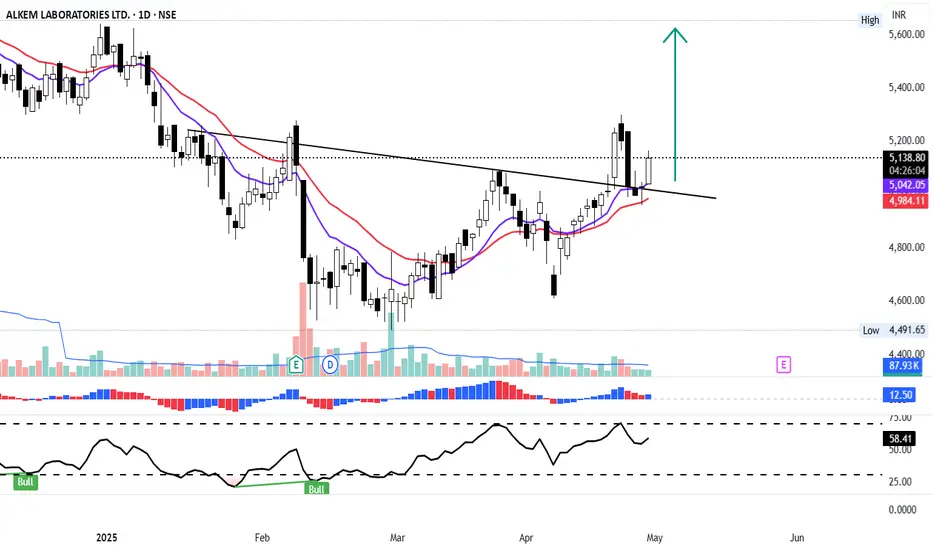
Head N Shoulder Breakout in Alkem Labs. Ready for the upmoveAlkem Labs broke the neckline of Inverted Head and Shoulder on the daily chart, retested the neckline and it is looking good for a decent run. The HNS target comes to Rs.5616, which is a good 11.29% from the CMP of Rs. 5146.
The Inverted Head and Shoulders pattern is a bullish reversal chart pattern in technical analysis, signaling a potential shift from a downtrend to an uptrend.
Moreover, the stock is above trading above 11 & 22 DEMA which signifies good uptrend and momentum.
MACD is above zero line and RSI is at 58 indicating strength and momentum.
One can keep an eye on this stock for decent 11% return in short term. It will report its Q4'25 earnings on 29th May,2025. The expected revenue is 31.68B.
Keep investing!!!
Garden Reach Shipbuilders (GRSE) Bullish Inv HnS BO with volumeThanks for sharing the chart of **Garden Reach Shipbuilders (GRSE)**.
Strong **bullish setup** supported by two technical patterns:
1. **Falling Wedge Pattern (Breakout)** – A classic bullish reversal pattern, and it has broken out with strong volume.
2. **Inverted Head and Shoulders** – Another bullish reversal formation that also broke out around ₹1,730–₹1,750 zone, confirmed with high volume.
### Key Highlights:
- **Breakout Confirmation**: Price closed at ₹1,957.80, up **+11.90%**, with strong volume (17.64M).
- **Targets**: Based on pattern projections, potential target zones are:
- ₹2,354.10 (Inverted H&S breakout)
- ₹2,833.80 (Falling wedge pattern breakout)
- **Support Zone**: ₹1,730 acts as a strong support now (previous resistance).
This confluence of two bullish patterns with a volume spike significantly increases the probability of continued upward momentum.

NIFTY DEFENCE "⚙️ NIFTY IND DEFENCE and the Head and Shoulders pattern—what's next?
The daily chart reveals a Head and Shoulders pattern in development for NIFTY IND DEFENCE. If this bearish reversal plays out, it could signal a potential shift in the trend. ⬇️
✅ Want to stay ahead with insights like this? Join my channel now for expert analysis and actionable updates to elevate your trading game!"

POWER GRID - INVERSE HEAD & SHOULDERS BREAKOUTSymbol - POWERGRID
Power Grid Corporation of India Ltd. is a Maha-ratna Public Sector Enterprise and a key player in the Indian power transmission sector. It operates as a central transmission utility and is involved in the planning, implementation, and maintenance of transmission systems across the country.
Recently, the stock has exhibited a notable bullish breakout after forming an Inverse Head and Shoulders pattern. A classic reversal formation signaling a shift from a downtrend to an uptrend. Following the breakout, the stock may witness a retest of the neckline zone, which now acts as a support area - around 300 to 303 range. This zone offers a favorable risk-reward entry for positional investors anticipating further upside.
The projected target from this breakout lies near the 350-355 zone, offering a potential 17-20% upside from current levels, based on the height of the pattern added to the breakout point.
For prudent risk management, a stop loss below 280 is advisable, just below the right shoulder, to protect against unexpected downside.
Overall, the breakout of a well-formed Inverse Head and Shoulders on a higher time frame charts presents a bullish outlook for Power Grid, making it a strong candidate for medium-term investment consideration.
Disclaimer: The information provided here should not be construed as a buy or sell recommendation. It reflects my personal analysis and my trading position. Please consider this trading idea for educational purposes only. Thank you!

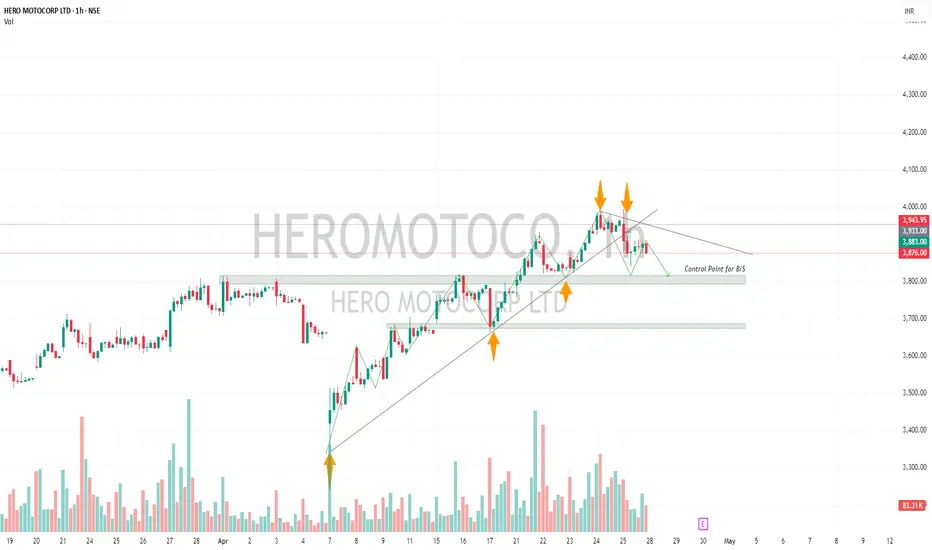
HEROMOTOCO-Positional Short Trade Stock upside taking support from trendline. Friday's session 25'th April The stock has shown weakness potential trend reversal.
There are two possibilities:
1)Head and Shoulder Pattern
2)Descending Tringle Pattern
For both the possibilities it the neckline/Support zone 3800 needs to break. If that happens it may test 3680.
If opens gap up Above 3960 Avoid!
Please don't forget click on follow button so you won't miss any upcoming ideas.
Any confusion, feel free to drop msg. Happy to help :)
This is only for educational purpose, please manage your risk accordingly.
(NSE:SUNPHARMA) Inverted H&S Breakout Eyes New ATH Chart Analysis:
Sun Pharma has formed a textbook Inverted Head & Shoulders (H&S) pattern on the daily timeframe, signaling a strong bullish reversal. The pattern completed with a clean breakout above the neckline at ₹1,820 , accompanied by a surge in trading volume (highest in 2 weeks). This validates buyer conviction and sets the stage for a sustained upward move.
Key Levels:
Neckline: ₹1,820
Resistance Targets:
Target 1: ₹1,910
Target 2: ₹1,960 (All-Time High, ATH)
Support Zone:1,750
Trade Setup:
Entry Zone: ₹1,820–1,835 (post-breakout retest opportunity)
Stop Loss: ₹1,750 (below the right shoulder to avoid false breaks)
Why This Works?
✅ Pure Price Action Focus: The analysis relies solely on pattern structure, volume, and key levels—no indicators cluttering the chart.
✅ Volume Confirmation: Breakout supported by above average volume, reinforcing bullish momentum.
✅ Pattern Perfection: Classic Inverted H&S structure with well-defined neckline and symmetry.
✅ Breakout Conviction: Price closed decisively above ₹1,820, indicating strong follow-through.
For Indicator Users:
Traders who incorporate tools like RSI or Moving Averages can cross-verify this setup with their preferred strategies. For instance, the breakout aligns with bullish momentum on higher timeframes.
Risk Management:
Trail stops to lock profits as price approaches ₹1,910.
Partial profit booking at ₹1,910 (T1) recommended.
Conclusion:
Sun Pharma’s breakout above ₹1,820 opens the door for a rally toward its ATH. Pure price action traders can leverage the clean setup, while others may combine it with their preferred indicators. Focus on the neckline (₹1,820–1,835) for potential entries, and maintain strict risk management.
*This analysis is for educational purposes only and does not constitute financial advice, investment recommendation, or an offer to buy/sell securities. Trading involves substantial risk of loss, and past performance is not indicative of future results.

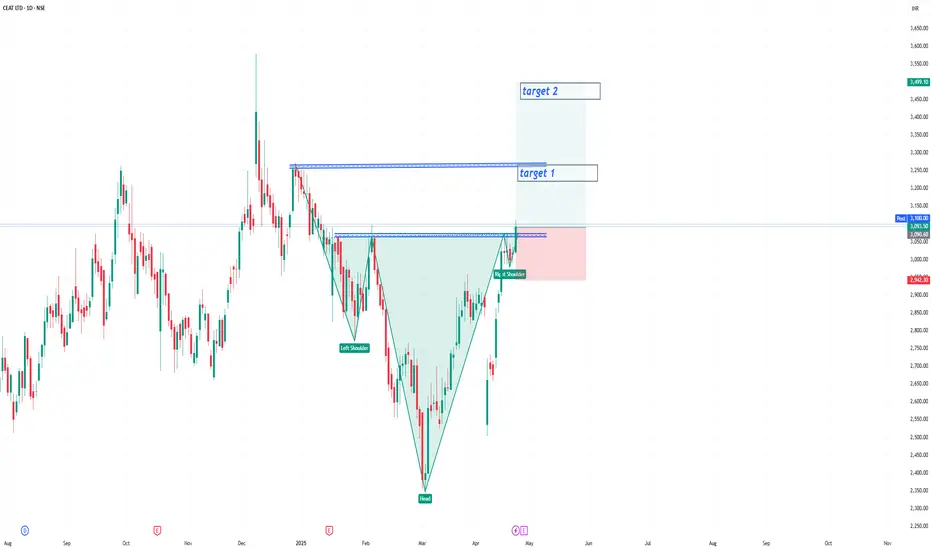
CEAT Ltd | Cup and Handle Breakout | Targets Ahead CEAT Ltd has formed a classic Cup & Handle pattern on the daily chart, indicating a strong bullish continuation setup.
Breakout supported by increasing volume
Retest zone: 3,000 – 3,050 (Good entry opportunity)
SL: 2,870 (below handle support)
📈 Targets:
T1: 3,300
T2: 3,500
T3: 3,900 (measured move target)
💡 Bias: Bullish continuation | Swing to Positional
🕒 Timeframe: Daily Chart
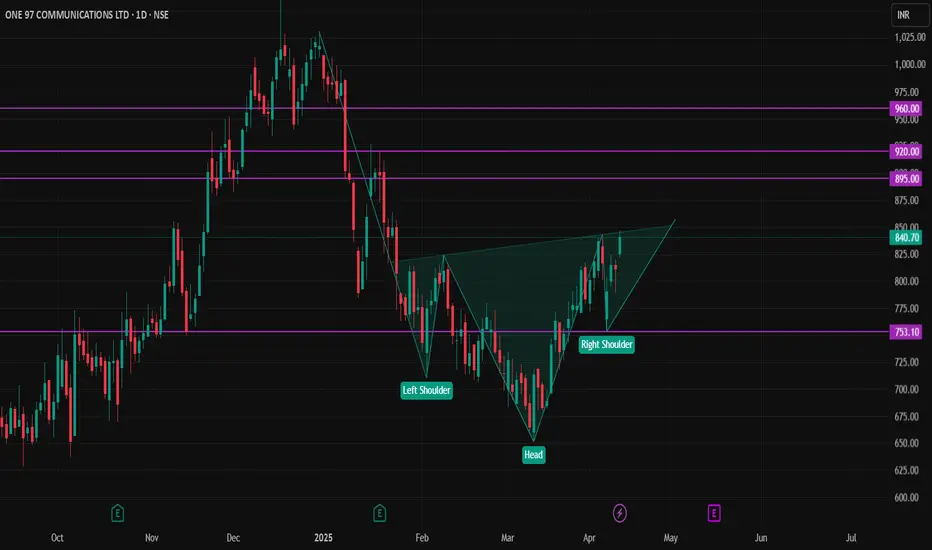
PAYTM STOCKNSE:PAYTM Stock is waiting for breakout the inverted head and shoulders pattern.
buy sustain above 750 rupees,
Target 1 is 885 to 895 rupees,
Target 2 is 915 to 920 rupees,
Target 3 is 950 to 960 rupees,
Stoploss close below 750 rupees atleast 1 day candle.
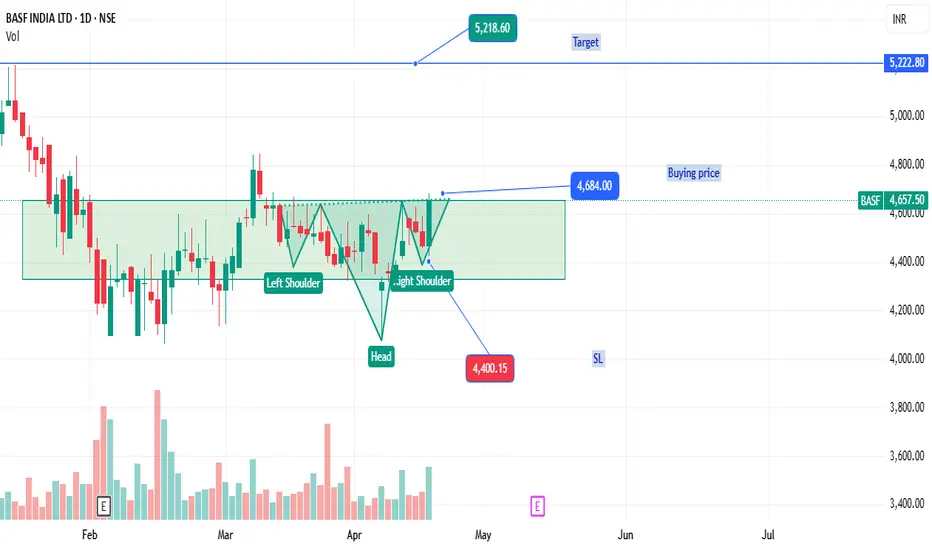
BASF: LONGNSE:BASF
Formed base support, Hammer on 7 Apr 2025 and Bullish candle on 21 Apr 2025, the last bullish candle of 21 Apr has engulf the previous 3 candle with increase in volume, if you look closely, it has also formed Inverted H&S pattern.
All levels are marked on chart
SBIN Upside potential with a Bullish Bias The Bank Index has been performing since few days
Also structure level SBIN is poised for an upmove, it has a pattern Inverse Head & Shoulders which is a bullish pattern and with a significant upside technically
Suggested to Buy at CMP or wait to retrace at 780s zone
SL 750s zone
Target 870s zone

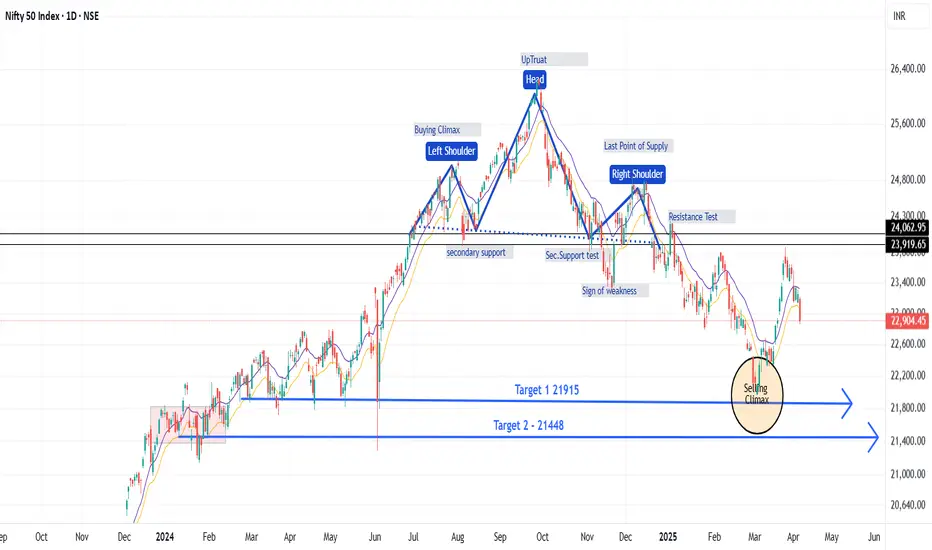
Nifty a WyCKoff analysis Nifty 22904 - Has broken Head and shoulder pattern in Daily chart suggests a target of 21915 as target 1 and secondary target of 21448.
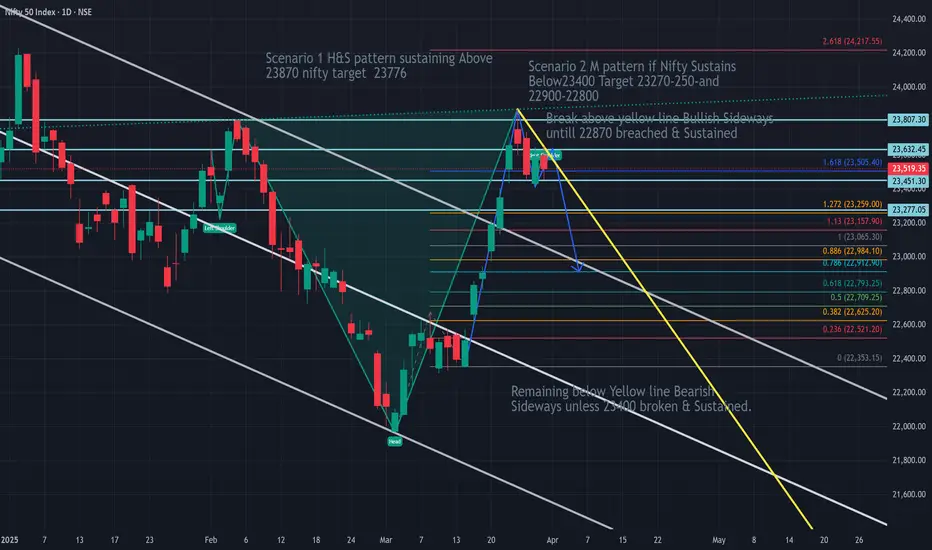
Nifty Weekly ViewNifty is Forming either H&S or M pattern. If Nifty breaks & sustains 23870 and H&S pattern is confirmed then target will be 25750.
If Nifty breaks and Sustains below 23400 then M pattern is confirmed and in that case nifty may test 22800 level.
On chart please read H&S target as 25750.
Union Bank of India - Inverse Head & Shoulders Breakout!Union Bank of India (NSE: UNIONBANK)—Inverse Head & Shoulders Breakout! 🚀
📈 Chart Overview:
The stock has formed a multiple inverse head & shoulders pattern, indicating a strong bullish reversal.
A downtrend resistance has been breached, confirming bullish momentum.
🔍 Key Levels:
Resistance Levels: ₹140, ₹150
Support Levels: ₹125, ₹120
📊 Observations:
Volume spike supports the breakout, signaling strong buying interest.
RSI at 66.34, approaching overbought levels but still has room for further upside.
Sustaining above ₹130.02 will confirm further bullishness.
🚀 Trading View:
A breakout above ₹135 could lead to a further rally toward ₹140-₹150.
Any retest of ₹130.02 can act as a potential buying opportunity.
📌 Disclaimer: This is for educational purposes only. Always conduct your research before making any investment decisions.

Sun Pharma's Inverse Head and Shoulders: Bullish Setup Ahead!Hello Traders! Today, we’re taking a look at Sun Pharmaceutical and a potential Inverse Head and Shoulders pattern that's setting up on the chart. This pattern is a classic bullish reversal setup that indicates the stock could be gearing up for an upward move, especially if the neckline breakout gets confirmed. The price has already formed the left shoulder , the head , and now we’re watching the right shoulder develop.
Once the neckline breakout happens, we’ll have a solid confirmation of the bullish move. This would give us an opportunity for fresh entries, while those already in the trade can hold their positions with a trailing stop loss . A piercing line candlestick pattern is also forming, showing increased buying interest at the right shoulder , adding more confidence to this setup.
For the entry, keep an eye on the range around 1730-1713 , with a stop loss set at 1684 to protect from unexpected moves. The targets for this trade are 1748 for short-term gains, 1792 for medium-term moves, and the final long-term target of 1587 . If this pattern confirms, we could see a nice rally in Sun Pharma . Let’s stay sharp and manage risk effectively as we watch this pattern unfold!
Disclaimer:- This analysis is for educational purposes only. Please trade responsibly and consult a financial advisor before making any decisions.
If you found this analysis helpful, don’t forget to like, follow, and share your thoughts in the comments below! Your support keeps me motivated to share more insights. Let’s grow and learn together—happy trading!

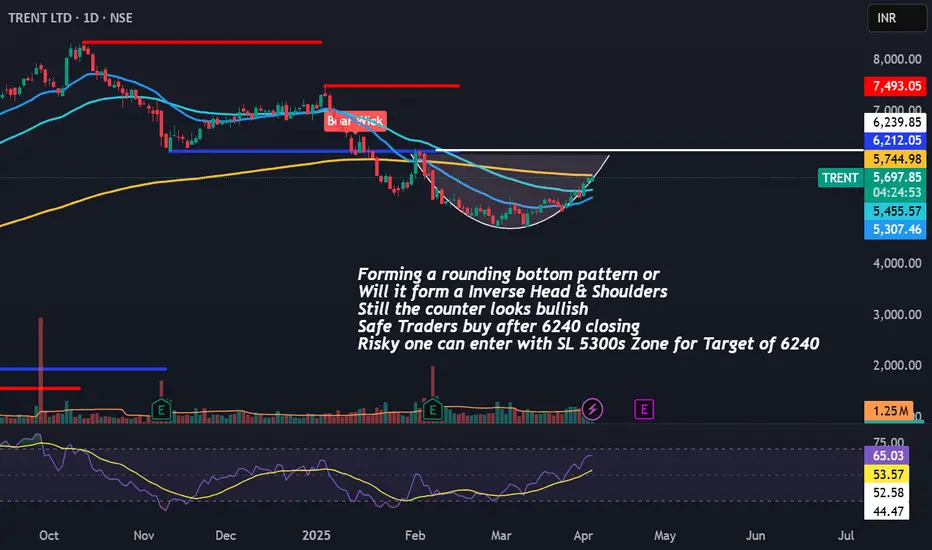
Trent Bullish Bias Target of 6240/-Forming a rounding bottom pattern or
Will it form a Inverse Head & Shoulders
Still the counter looks bullish
Safe Traders buy after 6240 closing
Risky one can enter with SL 5300s Zone for Target of 6240
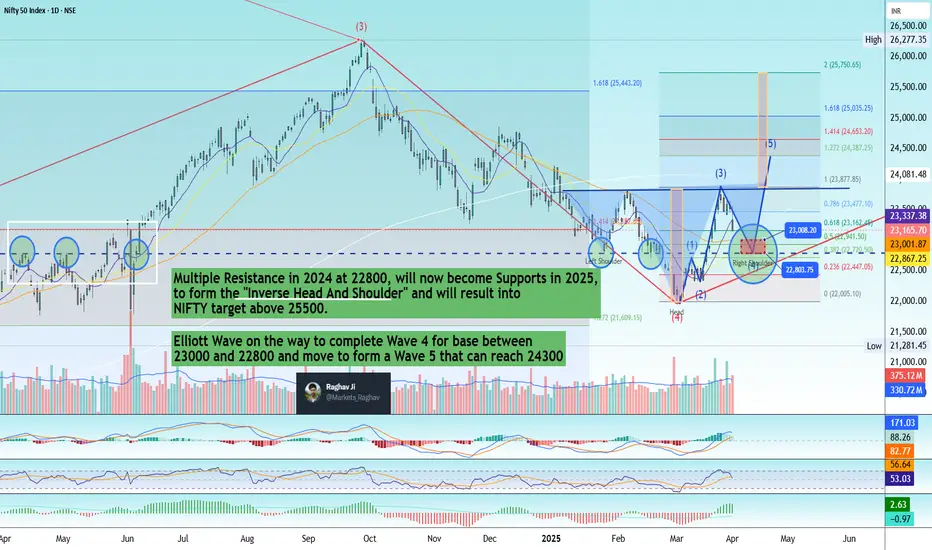
Shocked by Nifty50's sharp correction? Don't worry!Today NIFTY has crashed by 350+ points and reached 23165, a correction from 23800 levels .
Let me explain, This Nifty Daily chart is a classic example of how many fundamentals of Technical Analysis are satisfied.
1) Old resistances in 2024 at 22800 will now become Support levels
2) If it goes to 23000 and stops at 22800 levels it also fulfils the Wave 4 criteria, which says that Wave 4 never gets in Wave 1 territory
3) If this happens, the chart also completes an Inverse Head and Shoulder's Right Shoulder bottom to make an up-move towards the Neck.
4) if it crosses the Neck, the targets of Nifty will be above 25500, which will be 2500+points.
Technicals are beautiful only when you practice them.
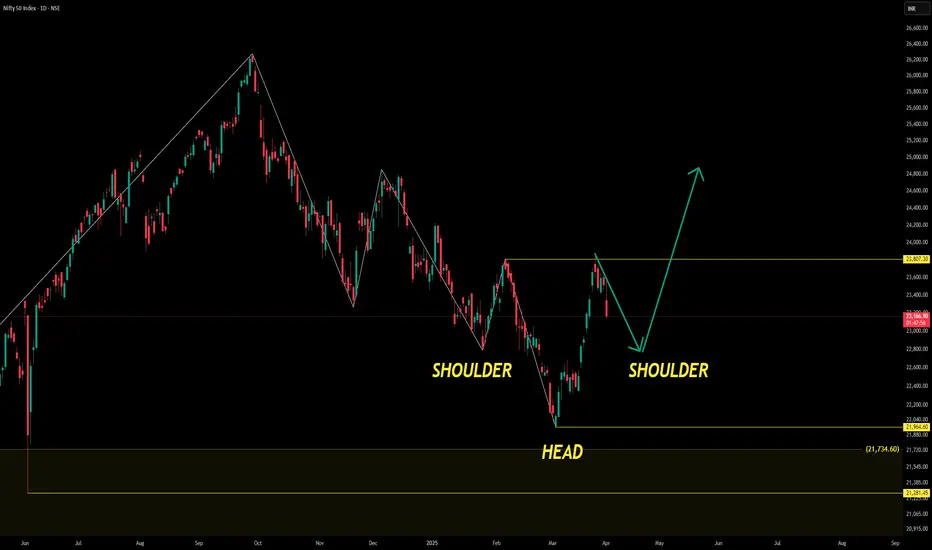
possible INVERTED HEAD&SHOULDER in NIFTY50 soonThe Head and Shoulders consists of three distinct peaks:
Left Shoulder: A peak observed towards the end of November, followed by a downward movement.
Head: The highest peak formed around early January, indicating a strong upward movement before declining.
Right Shoulder: A smaller peak formed in late March, followed by another decline.
The neckline, which is a horizontal line connecting the troughs between the shoulders and the head, is positioned near 21,734.60 INR. This neckline is a critical support level that traders closely monitor.
Potential Scenarios
Bearish Reversal: If the price breaks below the neckline, it could signal a bearish trend, potentially leading to further price declines. This aligns with classic Head and Shoulders behavior.
Bullish Breakout: There’s also an upward arrow on the chart suggesting a potential bullish breakout above the right shoulder, targeting a level of 23,807.30 INR. This would indicate a rejection of the bearish setup, leading to a trend reversal to the upside.
Additional Observations
The current price is 23,162.10 INR, down by 357.25 points (-1.52%), with a trading volume of 255.38M. This recent decline might indicate pressure near the neckline level, reinforcing its importance in upcoming sessions.
From this analysis, traders might:
Keep an eye on the neckline for signs of a breakdown or reversal.
Watch for volume spikes during any breakout or breakdown, as these could confirm the validity of the movement.
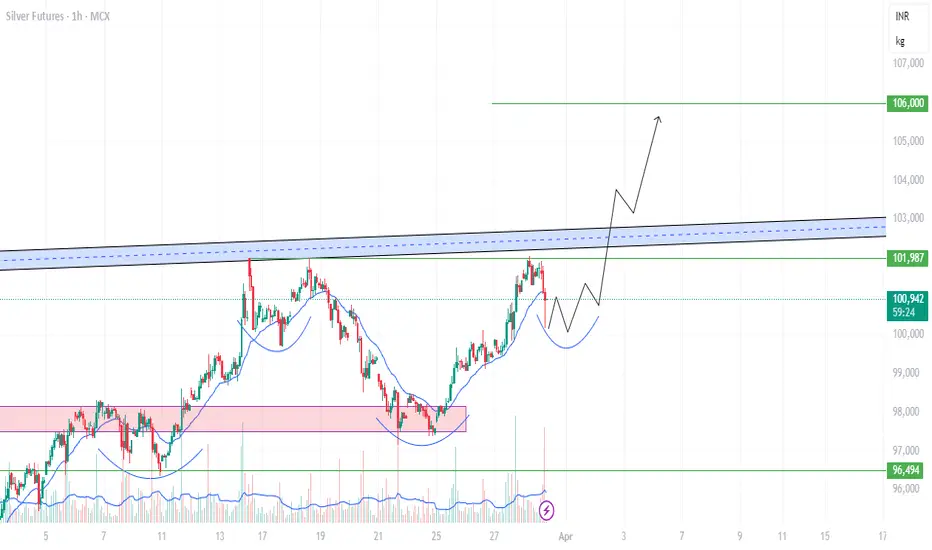
Inverse Head and Shoulder pattern In Silver ? New high Soon?chart shows an Inverse Head and Shoulders pattern in Silver Futures on the 1-hour timeframe.
The neckline (resistance) is marked by the blue zone, which, if broken with strong volume, could confirm a bullish breakout. The projected price movement (black arrow) suggests a potential rally toward ₹106,000.
A confirmation would come if the price breaks above the ₹101,987 - ₹103,000 resistance zone with volume.
Place SL below the right shoulder (~₹100,000) for a safe trade.
Zomato is showing weakness it may test 170 soon.Zomato is weak on monthly and weakly chart. It forms Fake breakout with double top pattern on monthly chart.
As per chart showing weakness on daily chart also as RSI drag below 40. It can short on any rise or here for target 170 soon.

Bullish reversal in #RelianceThere is a formation of Bullish Head and Shoulders pattern on the daily chart of Reliance. The left shoulder and the head are already formed. The right shoulder is also half complete. There are good chances that the shoulder will complete.
The neckline is at 1320 which is around 100 Rs far from CMP of 1225.
#reliance #bullish
