Small cap bottoming outAs can be seen nr 15000 level we see buying interest.
Now we can also see inverse head and shoulder formation.
Small caps are now in buy on dips zone.
Head and Shoulders

SPLPETRO : #SPLPETRO #swingtrade #patterntrading
SPLPETRO : Swing Trading
>> Inverse H&S pattern visible
>> Good Strength in Stock
>> Volume Building up
>> Risk Reward Favourable
Swing Traders can lock profit at 10% and keep Trailing
Please Boost, comment and follow us for more Learnings.
Note : Markets are still Tricky and can go either ways so don't be over aggressive while choosing & planning your Trades, Calculate your Position sizing as per the Risk Reward you see and most importantly don't go all in
Disc : Charts shared are for learning purpose only, not a Trade recommendation. Do your own research and consult your financial advisor before taking any position.
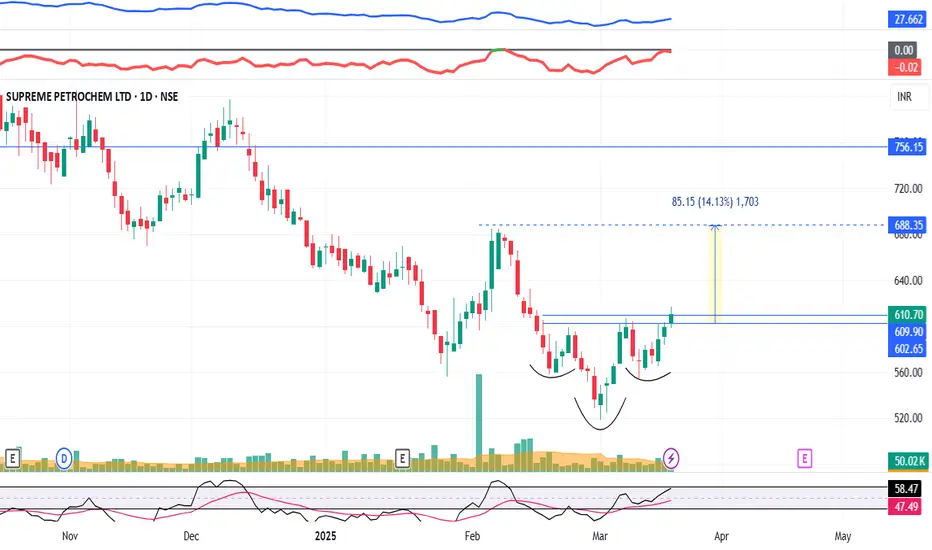
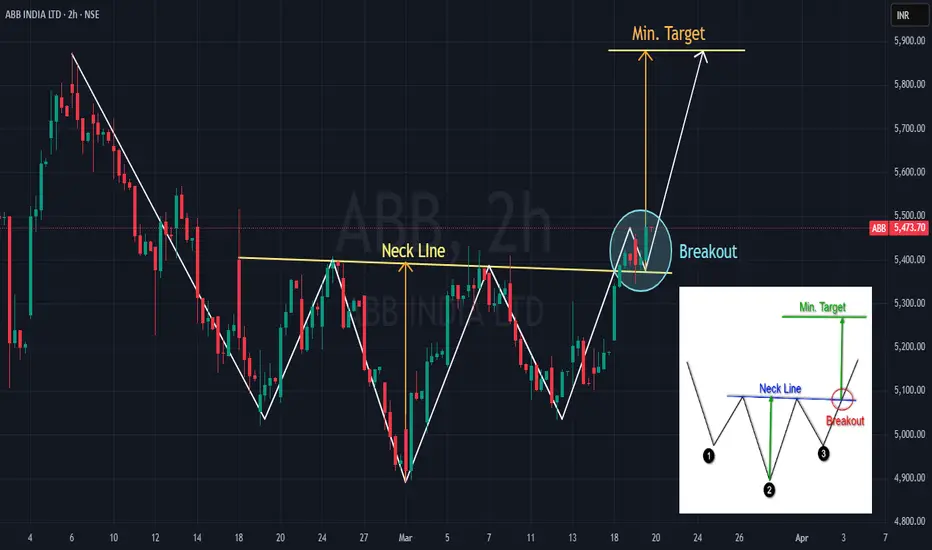
ABB Share – Inverse Head and Shoulders PatternIt seems that ABB's stock is forming an Inverse Head and Shoulders Pattern, signaling a potential bullish reversal. Keep an eye on the breakout point as it could confirm the pattern and signal a potential upward movement!
CGPOWER INVERSE H&S REVERSAL PATTERNCgpower is breaking inverse h&s reversal pattern
breaking 200 ema also
with good volume,bullish rsi
breakoing and holding 690 can take it 750-800
NO BUY/SELL RECOMENDATION

BITCOINBitcoin is in trading in large volatile zone between support and resistance. we can clearly buy near support with small sl and sell on resistance with small stoploss.

Inverse Head and Shoulders pattern on the Silver Futures (MCX)The 4-hour Silver Futures (MCX) chart is showing a clear Inverse Head and Shoulders pattern, a bullish reversal signal. The pattern comprises a left shoulder, head, and right shoulder, with the neckline around the ₹97,800 - ₹98,300 region.
The price is currently testing this neckline, and a successful breakout above this level, confirmed by increased volume, could trigger a significant upward move.

Bitcoin showing weakness. It may test 76076Bitcoin chart is weak now. weakly RSI below 60 MACD also negative. Double top pattern form and correction showing. As per chart it may test 76076 soon. It can short on any bounce up to 92000.
These is Neckline place near 76076 of Inverse H&S pattern. It would be retest of neckline.

ONGC I OIL Burning Bright : Inverted H&S Pattern!!Hello Traders,
- ONGC is trading at a place called AOI (Area of Interest) A place from where price usually reverses.
- 218 levels is acting as a strong support pushing prices higher after a intraday low of about 3% making a big pin bar candle on 1D chart
- Inverted head and shoulder on 15m timeframe.
PRO TIP/-
The Entry Line is the Neckline of the inverted Head and shoulder.
Target 1:- 228
Target 2 :-231
Entry Criteria
Strong Close above Entry Line (225) 15mins TF
Stoploss
Entry Candle Low (not more than 0.8%)
Not an Investment Advise

A long after very longMarket is near bottom
A good structure is formed
Good rr
Good overall
So can enjoy the ride

NIFTY Nifty formed head and shoulder patern on Left chart (daily time frame) right chart (weekly time frame)

More fall expected in Nifty?NIfty has formed a bearish head and shoulder pattern, whose neckline has broken recently. Further, it was rejected from a downtrend line during its last swing. 21800 can act as next support, while 21450-21350 is the pattern target range as well as support zone. If it can't hold these levels, a fall to 20350 levels is imminent to cover the gap formed earlier. Interestingly, this zone is also the target indicated by the pattern.
But can it reach directly to these levels? It may not. Its very common in the market to have relief rallies after a fall. So the market may retest previous support levels of 22500 before determining its direction.
Let me know your thoughts on this. If you found this helpful, like this post. Follow me for more such updates.

BSE: Roaring aheadNSE:BSE Roaring ahead with great momentum in poor overall markets. The stock has made a H&S and is breaking out above the right shoulder indicating bullishness. Looking for the counter to make fresh high's with a SL right below the neckline


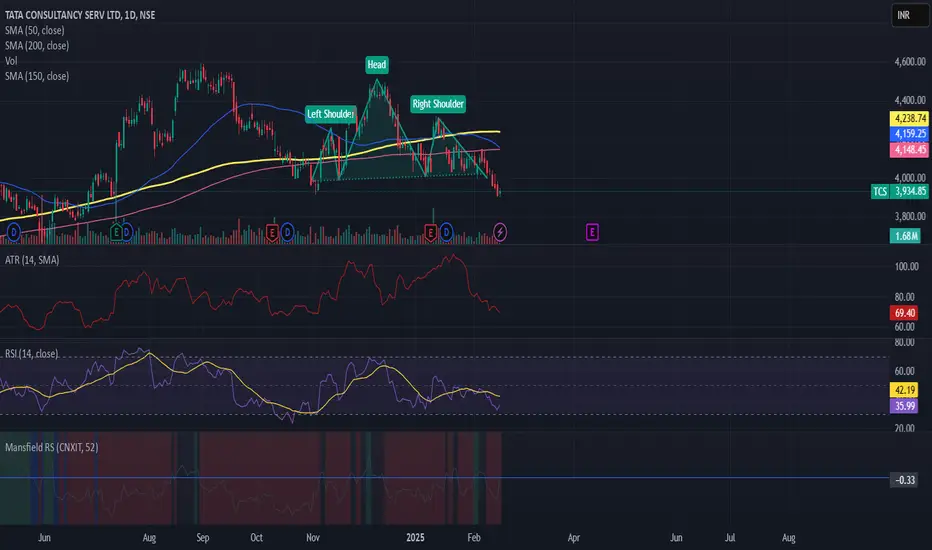
Clear weakness in the Indian markets now extending to IT sectorContinued selling pressure dragging the markets with a spillover effect on one of the most resilient sectors. NSE:TCS has caught my attention forming H&S pattern over 4 months. This signifies weakness with a stop above 4310 with targets 3780,3660,3455. Lacklustre volumes couples with poor outlook and MAGA 2.0 adds more conviction. Chose the pullback near 4000 and CAPITALISE
IRCTC - BULLISH & BEARISH BIASSymbol - IRCTC
CMP - 900
IRCTC is currently trading at an interesting zone. After a good rally in the last year, This stock is following a trendline resistance making lower - lows price action & showing no strength of price growth.
I am tracking this stock from quite some time. I will be interested in long positions on breakout of 940-950 resistance zone. I will be even more interested in shorting this stock if this stock breaks 850 on downside & sustain below it as it stock is making a Head & shoulders pattern in larger time frame.
Such patterns tends be more accurate on larger time frame & don't fail if gets activated. This pattern will get activated if price break neckline on the downside then I will be shorting futures for more downside targets.
What will happen? Only the time will tell. My job is to keep it on radar & enter in longs above 950 & enter in short below 850.

RelianceH&S pattern observed on 125 mins
Nifty index also looks weak and Rel in weak condition make it a confirmation
Brace yourself from fresh buy

Markets to continue downtrendBANKNIFTY Completes retracement and heads lower breaking through necklines with a target of 48440,47950,46500. Overall markets looking weak with H&S pattern forming in major stocks and indices. With a close stop of 50050 on a closing basis this opportunity can be capitalized upon.

PNB Gilts Might CorrectPNB Gilts might correct in recent days to come. Here are the technical reason :
1)Trading below 20 EMA & 50 EMA on daily chart
2)Head & Shoulder Pattern formation on daily chart
3)On Monthly chart it's negative with 117.8 as last month low(August) which is an important support level.
(Note: Not responsible for anyone profit or loss, nor a sebi registered RA, this only for educational purpose. Please do your own due diligence before taking any trades.)

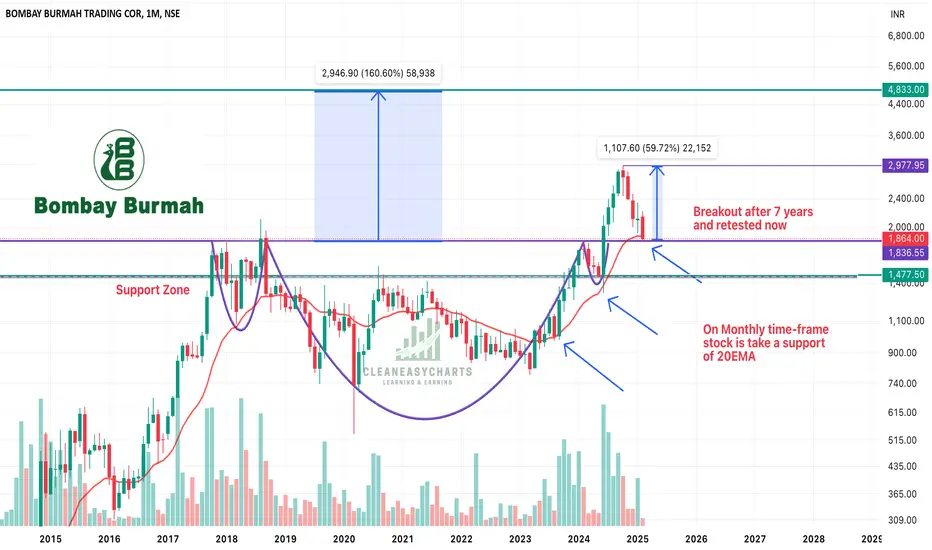
Bombay Burmah Trading Corp - Head & Shoulder Pattern & Retest!!Bombay Burmah had given breakout of Head & Shoulder pattern and now has entered retest zone on a monthly time frame. It is looking good and can move towards our targets as mentioned in the chart. Other factors:
1. Monthly Time frame set-up : Head & Shoulder Patter breakout and retest on a larger time frame is much stronger set-up. On a smaller time frame it can come down till support level given market conditions.
2. Stock price is taking EMA 20 as a support on MTF
3. Holds 50% in one of the largest FMCG Co. Britannia - FMCG sector should revive and should give tailwinds to this stock.
4. Hold many dimensional business and EPS is increasing on a YoY basis
Keep this stock in your radar!! Keep following @Cleaneasycharts as we provide Right Stock at Right Time at Right Price !!
Cheers!!!
Mastering the Head & Shoulders Pattern: A Powerful Chart PatternHello Traders!
Today, we’ll be diving into one of the most powerful chart patterns — the Head & Shoulder Pattern . It’s widely used by traders to spot trend reversals, particularly from bullish to bearish trends. If you’re looking to refine your technical analysis, understanding this pattern will significantly boost your trading edge.
Understanding the Head & Shoulder Pattern
The Head & Shoulders pattern consists of three peaks: the Left Shoulder , the Head (the highest peak), and the Right Shoulder . It indicates a trend reversal , usually occurring after a strong uptrend.
Left Shoulder : The price rises to a peak, then declines.
Head : The price rises higher, forming the highest peak, before pulling back again.
Right Shoulder : The price rises again but fails to reach the height of the Head , followed by a decline.
Key Elements for Confirmation:
Neckline : A key support level formed by connecting the lows of the left shoulder and right shoulder.
Breakout : Once the price breaks below the Neckline , the pattern is considered complete, signaling a potential sell-off.
Trade Setup Based on Head & Shoulders:
Entry Point : Enter a trade when the price breaks below the Neckline , confirming the pattern’s completion.
Stop Loss : Place your stop loss just above the Right Shoulder to limit risk.
Targets : Measure the distance from the Head to the Neckline and project it downward from the point of breakout for the target levels.
Example: Nifty 50 Head & Shoulder Pattern
In the chart, we can see the Nifty 50 forming a Head & Shoulders pattern . After the breakdown below the Neckline , the target levels are identified on chart please follow same if you see this chart pattern anywhere, indicating a potential move downward.
Why is This Pattern Effective?
The Head & Shoulders is highly regarded because of its clear structure and reliability in predicting bearish reversals. It helps traders identify when the market is likely to turn, giving you the opportunity to enter trades at the right time.
Conclusion:
The Head & Shoulders pattern is a powerful tool for identifying trend reversals. When used with additional tools like volume analysis and support/resistance levels , it can enhance your trading decisions. Always remember to use a stop loss to protect your capital and consider multiple timeframes for confirmation.
Happy Trading! 😎📉

Ethereum at a Critical Turning Point: Head & Shoulder PatternEthereum Technical Chart Study
Ethereum is showing some interesting price action. It recently took resistance from its resistance zone and is now forming a classic Head & Shoulder pattern—a structure often signaling potential reversals.
Currently, the price is sitting right at the neckline of the Head & Shoulder pattern. If this neckline breaks, it could lead to further downside movement.
Looking below, there’s some key support to watch:
1. The 2800 resistance zone, which Ethereum broke out of earlier, hasn’t been tested yet. This zone might now act as a strong support if the price moves downward.
2. There’s also a trendline support in play, adding another layer of potential price stability.
So, what’s next?
If Ethereum breaks the neckline, we could see the price fall towards the 2800 zone or possibly to the trendline support. These are the levels to keep an eye on for the next big move.

Nifty 50 | Head &Shoulders Pattern – A Breakdown Ahead?Hello everyone! I hope you all are doing great in life and in your trading . Today, I have brought an in-depth analysis of Nifty 50, focusing on a powerful Head & Shoulders pattern that is currently forming on the charts. This pattern is known for signaling a bearish reversal, which increases Supply in the market pushing prices downside. If this pattern plays out as expected, we could witness a strong Downside move in the coming sessions.
Currently nifty is trading at 23,340 levels Where previously buyers had shown interest pushing the market gap up following this pattern is selling pressure these buyers could Exit their position Pushing prices to 23,232 (Target 2) and 23,134 (Target 3).
Disclaimer:-This analysis is for educational purposes only. Please trade responsibly and consult a financial advisor before making any decisions.
If you found this analysis helpful, don’t forget to like, follow, and share your thoughts in the comments below! Your support keeps me motivated to share more insights. Let’s grow and learn together—happy trading!

Redington Ltd – CNH & Inverse H&S Trade with Caution!🚀 Pattern Highlights
Cup and Handle & Inverse Head and Shoulders:
Redington is showing a potential Cup and Handle (CNH) formation alongside an Inverse Head and Shoulders, signaling a breakout at ₹238–₹240.
📊 Technical Levels
Entry: ₹238–₹240 (Breakout Level)
Stop Loss: ₹181 (24% below, on a daily closing basis)
Target: ₹340 (~42% upside, positional/medium-term)
Risk-Reward Ratio: ~1:1.75
🕵️♂️ Observations
1️⃣ The stock is trading within an ascending channel, forming higher lows.
2️⃣ It's below its 52-week high but not correcting much during this bearish phase.
3️⃣ The channel top may act as a key resistance.
4️⃣ Still in Higher High (HH) and Higher Low (HL) format while many other stocks have transitioned to Lower High (LH) and Lower Low (LL) structures.
5️⃣ Volume confirmation will be crucial for a breakout.
⚠️ Risks to Consider
Market Sentiment: Current market conditions are bearish, with indices correcting and most sectors showing weakness.
Bearish Transition?: No confirmation if this is a bull market correction or the start of a bear market.
Earnings Season: Quarterly results are around the corner, which could bring surprises.
📌 Why Risk Management Is Key
Example: Newgen Software recently broke out at ₹1,548 (ATH), moved ~15%, but then plunged 41% in just 9 trading sessions, trapping bulls.
Solution: Trade light with 7–10% of your usual position size (e.g., buy 7 shares if you usually buy 100). This limits risk while keeping you involved.
🏁 Conclusion
Trade cautiously: Position size, risk management, and patience are your best tools here.
If the stock doesn’t fall further, it could be an ideal candidate when the market reverses and bottoms out.
For Beginners: Avoid this trade for now. Add it to your watchlist and observe.
✨ Final Thoughts
Redington is trading tightly above its key DMAs with narrow-range candles. This indicates strength despite market weakness. Watch closely for a breakout confirmation.
🔍 Disclaimer
This is not financial advice. Do your own research (DYOR) and consult a financial advisor before making investment decisions. Trading involves risks, and capital is at stake. This idea is shared for educational purposes only.
