Options Strategy Breakdown – For Educational Purpose Only________________________________________
📈 Options Strategy Breakdown – For Educational Purpose Only
🧠 Learn to Structure a Bull Call Spread Strategically
________________________________________
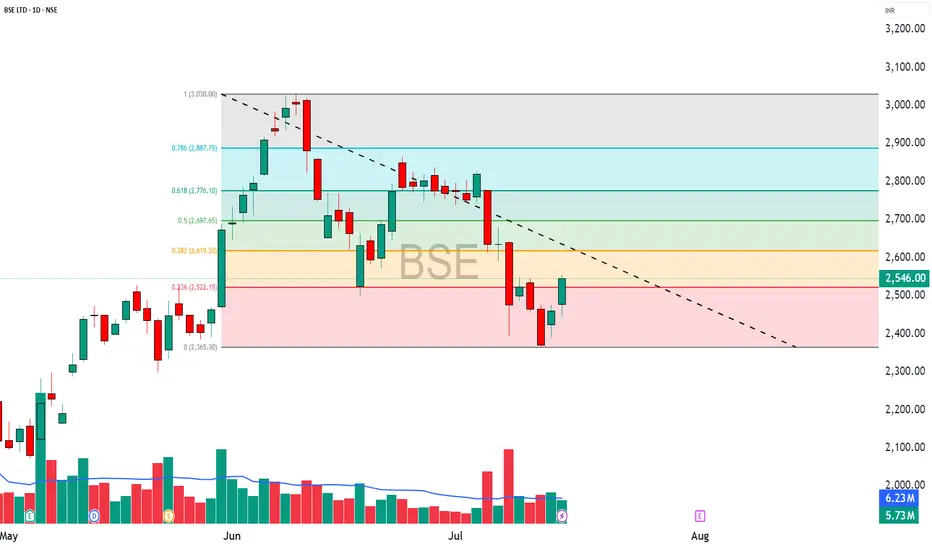
🔹 Stock Name: BSE
🔹 Spot Price: ₹2546
🔹 Lot Size: 375
🔹 Number of Lots: 1
🔹 Expiry Date: 31-July-2025
🕒 DTE (Days to Expiry): 16 Days
💡 Strategy Type: Bull Call Spread – Limited Risk | Limited Reward Option Structure
________________________________________
📘 Strategy Construction (Illustrative Example):
1️⃣ Buy Call Option – Strike: ₹2500 | Premium Paid: ₹125
2️⃣ Sell Call Option – Strike: ₹2600 | Premium Received: ₹76
🧮 Net Premium Outflow: ₹49
(₹125 - ₹76 = ₹49 * 375 = ₹18,375)
________________________________________
📊 Payoff Metrics (Illustrative & Hypothetical):
• 🔹 Breakeven Point: ₹2549.00
• 📈 Maximum Profit: ₹19,125 (When Spot ≥ ₹2600)
• ⚠️ Maximum Loss (Capital Deployed): ₹18,375 (if Spot ≤ ₹2500)
• 🔄 Real-Time PnL: Subject to market movement
• 🎯 Suggested Profit Booking Threshold: ₹18,375 (illustrative target)
• 🛑 Reversal Exit Point (Invalidation): Spot < ₹2487.75 (Support Violation)
________________________________________
📌 Why Learn This Strategy?
The Bull Call Spread is a risk-defined options strategy designed for moderately bullish views. It reduces premium cost compared to naked options and has a clearly capped loss and reward, making it suitable for learning proper risk management in derivatives trading.
________________________________________
🔍 Key Educational Takeaways:
• Helps manage premium exposure in trending markets
• Builds awareness of breakeven levels and invalidation points
• Encourages use of defined-risk structures over naked positions
• Promotes discipline and technical level-based exits
________________________________________
⚠️ Educational Disclaimer:
📢 This post is intended purely for educational and informational purposes only and does not constitute investment advice, recommendation, or solicitation to trade.
I am not a SEBI-registered investment advisor. All data shared above is illustrative and should not be considered as buy/sell advice.
Trading in derivatives involves risk. Please consult a SEBI-registered advisor before taking any financial decisions.
📘 Past performance or setup structure does not guarantee future results.
Always do your own research and use strict risk management.
________________________________________
💬 Want more educational breakdowns like this?
Drop a comment or message!
🔁 Share this with fellow learners to help them build structured option strategies.
✅ Follow @simpletradewithpatience for charts, clean setups, and educational content based on price action, zones, and risk-managed trades.
________________________________________
Hedgingwithoptions
Bajfinance sell -swing trade / positional tradeBajfinance break a good support zone. If it breaks previous day low then Baffinance may fall till 5400
Positional Trade :-BAJFINANCE sell below 5845 to 5835
Target 5800, 5760,5700,5600,5540,5400
After selling, you cannot keep a stock overnight. so, one can take this trade in option.
e.g. Buy 1 lot 5700 PE feb expiry - ₹ 117.65
Sell 1 lot 5500PE - ₹ 62.45
Prob. of Profit :-34.5%
Max. Profit:- ₹ +18,100 (70.77%)
Max. Loss:- ₹ -6,900 (-26.98%)
Max. RR Ratio:- 1:2.62
Breakevens:- 0-5644.0

AXISBANK provides an attractive entry for Long positionAXISBANK has been staying above 800 for the last couple of days closings. The strength in BankNifty also suggests that banks may have a quick burst upwards. The risk reward supports a Long entry for the short term around 805. Targets would be 840, 860 and 900. Stop Loss would be any closing below 785 on daily basis.
Disclaimer - I have a position open on AXISBANK.
** Important Note - This post is my own study of the mentioned scrip and the views are given with reservation that they may prove to be wrong. I am not a SEBI registered analyst. Please consult your investment advisor before making financial investments.

SBI- Possible Short Trade Setup in ProgressionSBI seem to be forming a Head and Shoulder pattern in the shorter time frame chart. The pattern to be completed needs the price to test the neck line placed near 420-418 levels and break below. The immediate targets for the set up, if it realizes can be 406/393. The stop loss needs to be placed above 436, which is slightly above the most recent high made intraday (June 11).
Possible trades from the set up
1. Aggressive traders may consider shorting the stock/Futures on any up move towards 433-435 levels, keeping a stop loss at 436.2.
2. Those willing to risk about 7000 to 8000 and wait for approximately 40 days may consider buying the 420 PE July series, currently priced at 15.75 (closing price as on June 11). If the trade materialises the option should be worth around 24 near final target . Square off the option at market if the price closes above the stop loss mentioned in daily chart.
3. Those who wish to carry overnight position and look to hedge can short the July Futures intraday when the spot price is near 433-435 range and hold the position as long as the spot price do not breach the stop loss mentioned. If the trade is in our favor, towards closing buy 430 CE July series and convert the intraday Futures position to overnight. This can offer some hedge and also will allow you to carry the trade overnight with a small margin.
Note:
I am not a SEBI registered analyst
The information given is only for educational purposes.

BUY HERO MOTOCORP AT 2450 - 2470 LEVELS TARGET 2600IF YOU KNOW HEDGING STRATEGIES PLS FOLLOW TWITTER.....
