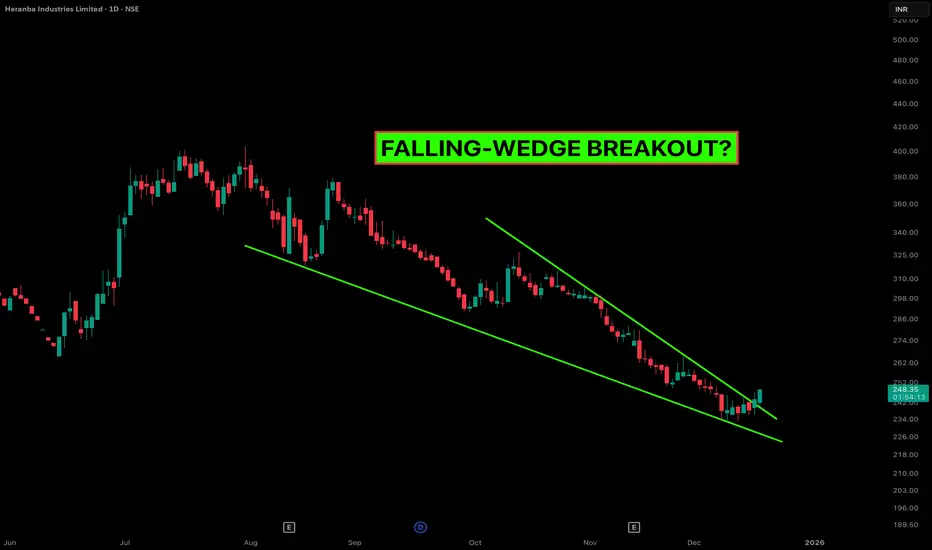
Heranba Industries: Why Falling Wedges Often Mark the BottomThe Setup Heranba Industries (NSE: HERANBA) has been in a corrective phase for months, but the structure has now matured into a classic Falling Wedge Pattern on the Daily timeframe.
For those new to this pattern: A Falling Wedge is a bullish reversal pattern. It is characterized by "Lower Highs" and "Lower Lows" contracting into a narrower range. This contraction signals that selling pressure is exhausting and buyers are stepping in at higher relative lows.
Technical Breakdown:
Price Action: The price has respected the upper trendline resistance multiple times. The recent breakout candle suggests a shift in momentum.
The Psychology: Notice how the selling waves are getting shorter? This "compression" usually precedes an expansion in volatility (the breakout).
Volume Profile: We are looking for a spike in volume to confirm the breakout validity. A low-volume breakout is often a trap, so watch the close.
Trade Management (Educational View):
Aggressive Entry: On the immediate break of the upper trendline (Current Levels: ~247-248).
Conservative Entry: Waiting for a "Retest" of the trendline around 240-242 to confirm support.
Stop Loss: Strictly below the recent swing low (invalidate the pattern if price falls back into the wedge).
Targets: The theoretical target of a wedge is often the top of the wedge structure (the origin of the pattern).
Risological Note: We track these compression patterns because they offer high Risk-to-Reward ratios. We are not predicting the future; we are reacting to probability.
HERANBA
HeranbaSwing Trade -
Look interesting at current level - still closing pending
If today close above break out level
Maybe we can see Good move upside.
Risk around 8-10% around
Target next resistance

Technical Analysis for Heranba Industries Ltd.:Technical Analysis for Heranba Industries Ltd.:
Trade Type: Swing trade for 6-12 months
Chart Pattern: Breakout of neckline
Entry Strategy:
Buy half quantity at Current Market Price (CMP)
Buy the remaining half on a retest or below ₹360
Stop Loss (SL): ₹392 for risk management
Target: ₹845
This strategy aims to capitalize on the breakout while managing risk through staggered entries. Monitor price action closely and adjust the stop loss as needed.
#HeranbaIndustries #TechnicalAnalysis #SwingTrade #StockMarket #BreakoutTrading #TradingStrategy #RiskManagement

Multi time frame breakout in Heranba explained I make educational content videos for swing / positional trading

TechnoFunda Pick for Long Term HorizonDisclaimer: Views for Educational Purpose and not to be taken as any investment or trading advice.
Stock has corrected more than half and looks good to accumulate at current levels
Low PE in comparison to Industry

HERANBA INDUSTRIES REVERSAL??Trade Or Invest Wisely.
We Can Just Predict.
Please Like And Share If You Agree With The Idea
Disclaimer: I Am Not A Sebi Registered Advisor, So Before Entering On My View Please Ask Your SEBI Registered Advisor. Profit Is Your And Loss Is Your.

HERANBAINDUSTRIESlooks like bearish trend watchout in intraday for shorting opportunity when candle closing previous days low

DIWALI PICKS LONG TERM - HERANBAJUST See the last two quarter results.. you will be amazed !! !
Buy this company.. once it crosses 830 this time.. it can go even to 1000

HERANBACMP: 820
Short term trading opportunity.
Stock is in consolidation.
Expected to give a breakout very soon.
Support: 750-760


HERANBA LongThis stock ( NSE:HERANBA ) is ready for some upward move. It is trying to take support at level of 827, with 800 acting as a stronger support. Target should be at least 900.
Target - 900(at least)
Strong support - 800
SL - 790

Heranba Industries Ltd - VCP & Base formation from IPO lowsHeranba Industries Ltd had formed good base from IPO lows.
VCP / C&H pattern indicates good accumulation by institutional players, & weak hands moving out of stock.
Had earlier formed a low cheat entry near 740 levels.
Stock is near Pivot point levels of 823 levels. Good move expected on close ab 823 levels on weekly basis.
Stock can be a potential Multibagger from current levels.

Late night Technical analysis talk - only potential stocks Late-night Tech series of ours provides you with potential stocks :)


watch for cup and handle breakoutbuy above 825
can buy for swing and Intraday
For stoploss in Intraday use 5 minute chart and see nearest support.
for target use 5 min chart and fibonacci pivots as i don't keep predefined target.
try to book partially and trail.
Note: this is not a prediction for LONG/SHORT, trade will trigger only on given level as per technical analysis
NOTE: For Gapup or bo before 9:20
If gapup is more than 1% from bo level than avoid completely.
if less than 1% or gives bo before 9:20 than wait for
first 5 minute candle and entry above 5 minute candle
and revised SL below candle Low.

HERANBA Stock is comfortably staying at 715 support with a breakout of hourly trendline could initiate long for 2.21 Risk Reward.
Stop Loss below the support at 705

Breakout StockToday gave breakout with +5.79% forming a thick green candle.
Closed above one of the major short term resistance.
Volume not that good but ok. Above average.
Let's see how it move further.
This post is for education purpose only.

