HEROMOTOCO – Wave 5 Setup Unfolding After Ideal Wave 4 📘 HERO MOTOCORP – Wave 5 Setup from Textbook Elliott Structure
Timeframe: Weekly
Structure: Impulsive (1–2–3–4 complete) → Preparing for Wave 5
Type: Positional Swing Setup | Elliott Wave Based
🔍 1. Elliott Wave Structure Breakdown:
Wave 1: ₹1,475 to ₹3,629
Wave 2: Retraced to ₹2,146.85 (between 50%–78.6% Fib of Wave 1)
Wave 3: Impulse to ₹6,246.25
Wave 4: Currently correcting between 38.2%–61.8% Fib of Wave 3 (₹4,680–₹3,712)
✅ Price found support near ₹3,344, which is just below 61.8% retracement – a common zone for Wave 4 completion.
🟫 2. Wave 4 Support Zone – ₹3,712 to ₹3,344:
This zone is acting as a potential reversal base with:
Fib retracement confluence: 38.2%–61.8% of Wave 3
Failed breakdown attempts followed by recovery candles
CHoCH observed in lower timeframes – suggests momentum shift
🟩 3. Breakout Confirmation Level – ₹4,680:
Breaking above ₹4,680–₹4,800 range would confirm Wave 5 activation
Indicates structure validation + bullish resumption
Close above this zone = strength & momentum breakout
📈 4. Wave 5 Target Projection – ₹6,595 to ₹7,019:
Calculated using:
113%–127% Fibonacci extension of Wave 3
Historical rally symmetry from Wave 1 and 3
Target zone offers positional upside potential of ~55%+
🛑 5. Stop Loss & Invalidation Level:
SL Zone: ₹3,344
Sustained breakdown below this invalidates Wave 4 base
Can lead to sharp drop toward ₹2,600–2,900 (next Fib cluster)
✅ 6. Trade Plan (Swing):
Accumulation Zone: ₹3,700 – ₹4,300 (if support structure holds)
Breakout Entry: Close above ₹4,680–4,800
Stop Loss: ₹3,344
Target: ₹6,595–7,019 (Wave 5 zone)
🧠 7. Why This Setup Matters:
Elliott Wave Confluence: Clean 1–2–3–4 formation
Textbook Fib Behavior: Wave 2 and Wave 4 within ideal retracement ranges
Defined R:R Structure: Tight invalidation + 1:2+ reward
Momentum Setup: Wave 5 can unfold rapidly once confirmed
📌 Conclusion:
HERO MOTOCORP is poised for a potential Wave 5 rally after a well-behaved corrective Wave 4.
A breakout above ₹4,680 could trigger bullish continuation toward ₹7,000+.
This is a classic trend continuation setup for wave-based swing traders.
HEROMOTOCO

HEROMOTOCO - Rejection From Strong Resistance, Momentum Cooling💹 Hero MotoCorp Ltd (NSE: HEROMOTOCO)
Sector: Automobiles | CMP: 5817
View: Bearish — Rejection From Strong Resistance, Momentum Cooling
HEROMOTOCO has recently faced a sharp rejection from its upper resistance zone near the 6100–6200 region after a strong prior rally, indicating supply emergence at higher levels rather than healthy consolidation. The subsequent decline has been decisive, with price slipping back below key short-term levels, suggesting that the recent upswing may have been a momentum-driven leg rather than the start of a sustained trend. Current price behaviour reflects a cooling phase following distribution near the highs.
From a structural perspective, the stock remains within a broader developing framework, but near-term momentum has weakened. RSI around 42.6 sits in a neutral-to-healthy zone, indicating that the stock is neither oversold nor displaying reversal exhaustion. Stochastic has cooled from elevated levels, while MACD signals point to loss of bullish momentum rather than aggressive bearish acceleration. ADX suggests the trend is still developing, though recent behaviour highlights a transition from expansion to consolidation or pullback.
Volume participation remains moderate (Vol-X ~0.83), confirming that the recent decline is orderly and controlled, not panic-driven. This reduces the probability of sharp capitulation but keeps downside risk open as long as price fails to reclaim overhead supply. The current structure favours patience, with markets reassessing value after a strong prior move.
Key price references show strong overhead resistance clustered near 5931–6045 and further up around 6120, while immediate structural supports are placed near 5742, followed by 5668 and 5553, defining the current risk-reward envelope. Sustained acceptance above the resistance band would be required to restore bullish confidence, while continued trade below this zone keeps the bias tilted to the downside or range-bound with elevated volatility.
On the derivatives side, near-ATM CALLs and PUTs are referenced strictly for analytical insight into positioning behaviour. CALL-side data shows rising open interest with moderate volume expansion, indicating short build-up rather than directional strength, while PUT-side activity reflects short-covering-led participation, suggesting defensive repositioning rather than fresh aggressive bearish bets. Implied volatility remains in a relatively low-to-moderate band, pointing to measured risk pricing rather than fear-driven expansion. Overall, derivatives behaviour aligns with a cooling, non-trending phase, where conviction remains mixed and momentum-dependent.
Structure quality metrics reflect this balance. The STWP Edge Score in the moderate range highlights tradability but not high-conviction trend alignment. Liquidity remains concentrated near ATM strikes, supporting participation, but directional option structures remain sensitive to time decay and price stalling, reinforcing the importance of confirmation through price acceptance or rejection at key levels.
Overall, HEROMOTOCO is currently in a post-rally digestion phase, with bearish pressure emerging near resistance and momentum moderating. While deeper downside is possible if supports fail, the absence of capitulation volume suggests that the stock may oscillate within a defined range unless fresh directional conviction develops.
Final Outlook (Educational Snapshot):
Momentum: Neutral| Trend: Developing / Cooling | Risk: Low | Volume: Normal
⚠️ STWP Legal Disclaimer
This document is strictly for educational and informational purposes. All examples, charts, levels, and option structures discussed are illustrative and are not intended as buy, sell, or hold recommendations. STWP does not provide investment advice, trading tips, signals, or personalized financial guidance of any kind, nor is it a SEBI-registered intermediary or research analyst. The analyses, illustrations, and risk–reward structures included here are generic in nature and based on publicly available data and observed market behaviour, which may change without notice. Financial markets involve significant risk; derivatives in particular carry the potential for substantial losses. Option premiums, implied volatility, open interest, delta, and other market variables can fluctuate rapidly and unpredictably.
Readers are solely responsible for their trading decisions, capital management, and risk assessment. Before making any investment or trading decision, please consult a SEBI-registered investment advisor. STWP, its representatives, and affiliates shall not be liable for any direct or indirect loss arising from the use of this material. Historical patterns or past market behaviour do not guarantee future outcomes, nor should any part of this document be interpreted as a promise of performance, accuracy, or returns.
Position Status: No active position in this instrument at the time of analysis.
Data Source: TradingView & NSE India.
💬 Found this useful?
🔼 Boost this post to support structured learning
✍️ Share your thoughts or questions in the comments
🔁 Forward this to traders who value clean technical studies
👉 Follow for disciplined, structured, STWP-style analysis
🚀 Stay Calm. Stay Clean. Trade With Patience.
Trade Smart | Learn Zones | Be Self-Reliant 📊

HEROMOTOCO - Strong Bullish Momentum Breakout💹 Hero Motocorp Ltd (NSE: HEROMOTOCO)
Sector: Auto | CMP: 5798 | View: Strong Bullish Momentum Breakout
Chart Pattern: Bullish Rectangle Breakout
Candlestick Pattern: Strong Bullish Candle
Swing High: 6246.25
Swing low:3344
HNI Trade Analysis:
Bullish Breakout: 5798.50 - 5810
Stop Loss: 5537.16
Low Risk Level: 5755.13
Stop Loss: 5465.16
STWP Trade Analysis:
Bullish Breakout: 5810
Stop Loss: 5455.95
Strong Momentum with Extremely High Volume
Resistances: 5882|5965.5|6121
Supports: 5643|5487.5|5404
STWP Stock Analysis:
Final Outlook:
Momentum: Strong | Trend: Bullish | Risk: Low | Volume: High
HEROMOTOCO is displaying a powerful continuation of its long-term uptrend, marked by a strong bullish candle and a fresh breakout backed by high institutional activity. The recent structure shows a clear VCP-style contraction, where volatility progressively narrowed before the price expanded sharply — fully validated by the VCP dashboard’s breakout signal. Price has surged with a wide-range move, reclaiming short- and medium-term EMAs while maintaining higher highs and higher lows since early April. Momentum indicators remain firmly bullish — RSI is in the strong zone, MACD has triggered a fresh upward crossover, and Stochastic shows renewed strength, signalling buyers’ dominance across timeframes. Volume behaviour reinforces the setup, with expanding bars confirming accumulation phases followed by trend expansion. Additional confluences such as Bollinger Band expansion, Bullish Supertrend alignment, and multiple technical triggers (RSI breakout, VMA rejection, Bollinger mid-band strength) further strengthen the bullish bias. Overall, the stock reflects a healthy, institutionally supported uptrend with strong momentum, clear VCP validation, and a technically clean continuation structure that favours upside extensions as long as it sustains above its short-term demand zones.
⚠️ Disclosure & Disclaimer – Please Read Carefully
The information shared here is meant purely for learning and awareness. It is not a buy or sell recommendation and should not be construed as investment advice.
I am not a SEBI-registered investment adviser, and this analysis is based on chart observations, technical patterns, and public data.
Trading involves risk; market movements can be sudden, and losses may exceed invested capital.
Past performance or setups do not guarantee future results.
Please evaluate your risk management and suitability before taking any trading decision.
Consult a SEBI-registered financial adviser before acting on any trade idea.
Position Status: No active position in (HEROMOTOCO) at the time of analysis.
Data Source: TradingView & NSE India (Past Chart Reference).
💬 Found this useful?
🔼 Give this post a Boost to help more traders discover structured learning.
✍️ Drop your thoughts, queries, or setups in the comments — let’s grow together!
🔁 Share this with fellow traders and learners to promote structured analysis.
👉 “If you liked this breakdown, follow for more clean, disciplined setups with patience at the core.”
🚀 Stay Calm. Stay Clean. Trade With Patience.
Trade Smart | Learn Zones | Be Self-Reliant 📊

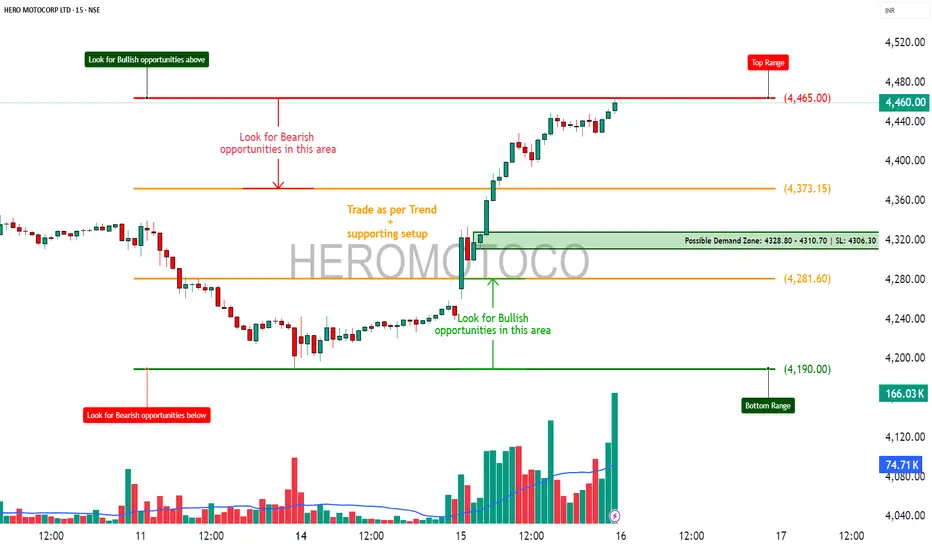
HEROMOTOCO – Option Chain + Price Action Intraday Setup________________________________________
📊 HEROMOTOCO – Option Chain + Price Action Intraday Setup
🕒 Chart Type: 15-Min Timeframe
📅 Date: July 15, 2025
🎯 For Educational Purpose Only
________________________________________
🔍 Chart Observations:
• Clean rally supported by increasing volume.
• Price nearing the Top Range / Resistance at ₹4465.
• A visible Demand Zone formed between ₹4328.80–₹4310.70 with a strong bounce.
• Volume spike confirms strong buying interest near demand levels.
________________________________________
🔢 Option Chain Insights:
🔼 Call Side Activity:
• 4500 CE: Massive Long Build Up — OI +111.76%, premium ₹52.3 → Suggests strength.
• 4450 CE: Also saw strong Long Build Up with rising premium.
• 4400 CE: Witnessed aggressive Short Covering, adding fuel to bullish momentum.
📈 Interpretation: Option writers are unwinding shorts on 4400, and 4500 is seeing heavy buildup — bullish sentiment.
🔽 Put Side Activity:
• 4400 PE: Sharp Short Build Up, IV at 34.5 → Puts being sold aggressively = Bullish bias.
• 4300 PE: Also saw strong Short Build Up, with OI rising despite falling premiums.
📉 Interpretation: Put writers are confident on downside support holding.
________________________________________
✅ Trade Plan Breakdown:
🔼 1. Best Buy – "Buy on Dip to Demand"
• Entry: ₹4328 – ₹4310 (Demand Zone)
• SL: ₹4306
• Risk Reward: 1:1 | 1:2 +
• Logic: Re-entry near demand zone + strong put writing + bullish volume = trend continuation
________________________________________
🔽 2. Best Sell – "Fade the Supply"
• Entry: ₹4460 – ₹4465 (Supply Zone)
• SL: ₹4475
• Risk Reward: 1:1 | 1:2 +
• Logic: Price near resistance with possible exhaustion. CE premiums elevated → good short-risk area
________________________________________
🟢 3. Best CE – "Momentum Play Above ₹4465"
• Strike: 4500 CE
• Trigger: If price breaks above ₹4465 with volume
• Logic: LTP ₹52.3 with Long Build Up, high delta (0.47) → Ready for breakout rally
________________________________________
🔴 4. Best PE – "Rejection Trade Below ₹4430"
• Strike: 4400 PE
• Trigger: If spot breaks below ₹4430
• Logic: LTP ₹95.75, Short Build Up suggests hedge-unwinding or trap possibility on failure
________________________________________
📦 5. Applicable Demand and Supply Zones
• Demand Zone: ₹4328.80 – ₹4310.70 (SL: ₹4306.30)
• Supply Zone: ₹4460 – ₹4465
• Mid-level Zones:
o Watch for support at ₹4373.15
o Breakdown area at ₹4281.60
• Bottom Range Support: ₹4190.00
________________________________________
💬 STWP Summary View:
The sentiment is strongly bullish, backed by long buildup in calls and short buildup in puts. If price breaks above ₹4465, momentum CE trades can fly. But supply pressure could give quick fade setups for scalpers too.
________________________________________
⚠️ Disclaimer (Read Before Trading):
• This setup is shared for educational purposes only.
• No investment advice or trade recommendation is being made.
• Always use proper risk management.
• STWP is not a SEBI-registered advisor.
• Markets involve risk. Trade with a plan, not with emotions.
________________________________________
💬 Found this helpful?
Drop your thoughts or questions below ⬇️
🔁 Share with your trading circle to help them navigate zone-based trades.
✅ Follow @simpletradewithpatience for smart charts, clean setups & demand-supply backed analysis.
📊 Let the price guide you — trade with patience, charts, and clarity!
________________________________________
HERO MOTOCORP LTD – TECHNICAL ANALYSIS________________________________________
📈 HERO MOTOCORP LTD – TECHNICAL ANALYSIS
📆 Date: July 15, 2025 | ⏱ Timeframe: Daily Chart
🔍 Educational Breakdown – For Learning & Study Use Only
________________________________________
🔹 Price Action Zones
• 🔴 Top Range (Supply Zone / Resistance): ₹4,486.70
• 🟢 Bottom Range (Demand Zone / Support): ₹4,158.10
Price has recently broken out from a symmetrical triangle pattern, heading toward the marked supply zone. The demand zone at ₹4,158 has been tested multiple times and held firm, acting as the base for this breakout.
________________________________________
🔹 Chart Pattern: ✅
The stock formed a tight triangle consolidation, compressing between a rising support and horizontal resistance. Today’s breakout candle, backed by volume, confirms a bullish resolution of the pattern.
________________________________________
🔹 Reversal Candlestick Patterns
A large bullish engulfing candle has cleared recent highs with strength. Closing near the high, it signals conviction and opens the path for a continued up-move.
________________________________________
🔹 Technical Indicators
• RSI: Crossed above 60 — strength building
• MACD: Positive crossover confirming trend reversal
• VWAP: Price comfortably trading above — supports trend
• Bollinger Bands: Post-squeeze breakout with wide expansion
• Volume: Breakout supported by 20-day volume high — adds strong confirmation
________________________________________
📌 What’s Catching Our Eye:
The volume spike is significant — over 1.76M with breakout from both triangle resistance and VWAP. Add to that a BB Squeeze release, and the setup gets stronger technically.
________________________________________
👀 What We’re Watching For:
If price sustains above ₹4,454, it may move into the next resistance cluster: ₹4,525.97 → ₹4,599.93 → ₹4,730.87. On dips, ₹4,188 and ₹4,158 become important demand zones to monitor for re-entries.
________________________________________
⚠️ Risks to Watch:
A failed follow-up tomorrow or close below ₹4,405 could invalidate the momentum. Also, overbought conditions without volume expansion may lead to a false breakout near ₹4,486.
________________________________________
🔮 What to Expect Next:
If bullish momentum sustains, the stock may first target ₹4,599 and then ₹4,695. Resistance is expected near ₹4,525–₹4,599 range. A clean breakout above ₹4,486 could invite strong follow-up buying.
________________________________________
📊 Trade Plan (Based on Reason and Charts)
🔼 Bullish Trade Setup:
Entry Zone: ₹4,454 – ₹4,465
Stop-loss: ₹4,405.63
Risk–Reward: ~1:1 to 1:2
Reason: Triangle breakout + BB Squeeze + RSI/MACD confirmation + VWAP support
🔽 Bearish Trade Setup:
Only if the price rejects ₹4,486.7 and breaks below ₹4,405:
Entry: Below ₹4,405
SL: ₹4,465
Risk–Reward: ~1:1 to 1:2
Reason: Failed breakout + supply pressure at top range
________________________________________
⚠️ Disclaimer (Please Read):
• This chart is shared for educational purposes only and is not investment advice.
• I am not a SEBI-registered advisor.
• The information provided here is based on personal market observation.
• No buy/sell recommendations are being made.
• Please do your own research or consult a registered financial advisor before making any trading decisions.
• Trading involves risk. Always use proper risk management.
STWP is not responsible for trading decisions based on this post.
________________________________________
💬 Found this helpful?
Drop your thoughts or questions in the comments below ⬇️
🔁 Share this post with your trading community – let them benefit from clean charts, structured setups, and zone-based learning.
✅ Follow @simpletradewithpatience for chart-backed technical analysis that respects price action, demand & supply.
🚀 Trade with patience, trust your charts, and stay clear-headed!
Be Self-Reliant | Trade with Patience | Learn with Charts & Zones 📊
________________________________________

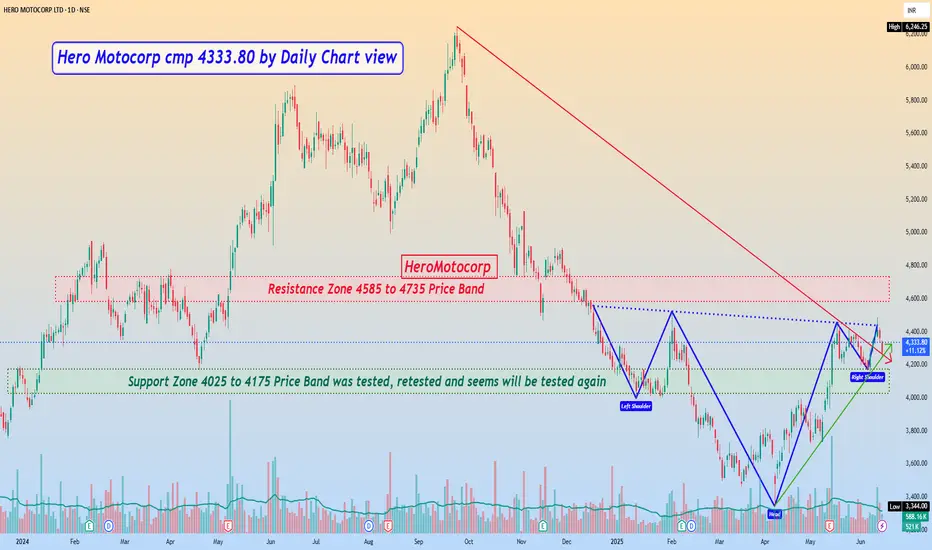
Hero Motocorp cmp 4333.80 by Daily Chart viewHero Motocorp cmp 4333.80 by Daily Chart view
- Resistance Zone 4585 to 4735 Price Band
- Support Zone 4025 to 4175 Price Band was tested, retested and seems will be tested again
- Volumes are seen in close sync with the avg traded quantity with decent demand based buying
- Falling Resistance Trendline Breakout might be retested based on the last week candle closed above it
- Rising Support Trendline seems providing a probable support to last week Friday candle for an upside move
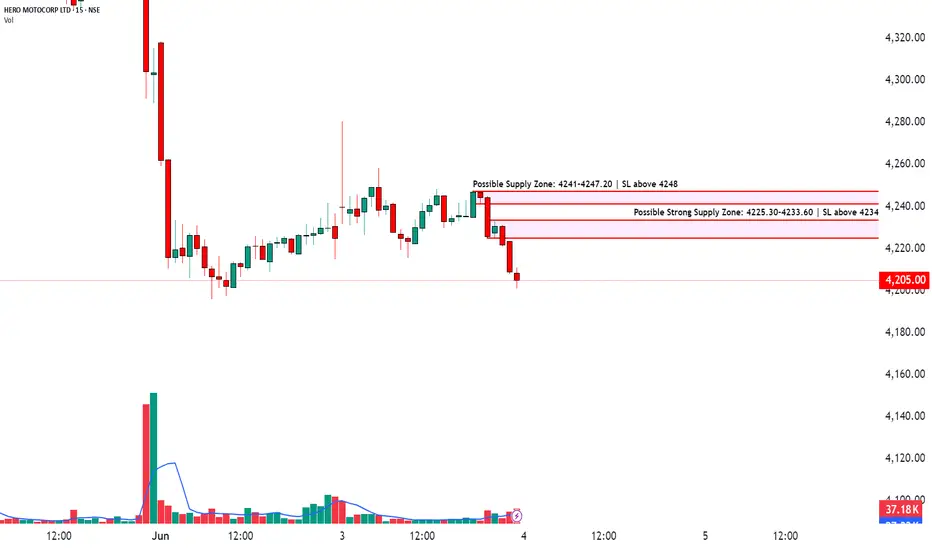
Identify Strong Supply Zones & Set Targets with RRR Logic📈HERO MOTOCORP LTD | 15-Min Chart Analysis
📆Date: June 3, 2025
Ticker: NSE:HEROMOTOCO
Price: ₹4,205.00
Chart Overview:
The chart shows a clear intraday rejection from a key supply zone followed by strong bearish price action. A decisive move below ₹4,220 indicates supply pressure.
Two critical supply zones are marked:
Possible Strong Supply Zone: 4225.30–4233.60 | SL above 4234
Possible Supply Zone: 4241–4247.20 | SL above 4248
Price is currently trading around ₹4,205, just below these zones, signaling a potential continuation of the short-term bearish trend.
Supply Zone Breakdown:
🟥🟥 Strong Supply Zone (4225–4233):
Multiple wick rejections seen previously.
Ideal for aggressive short entries with tight SL above 4234.
🟥 Upper Supply Zone (4241–4247):
Acts as a secondary resistance.
Conservative short traders can consider this zone with SL above 4248.
How to Trade Supply & Demand Zones:
When to Enter (Short Trade from Supply Zone):
Wait for price to retest the supply zone.
Watch for bearish confirmation candles like shooting stars, bearish engulfing, or rejections with volume.
Enter short near the top of the supply zone.
Keep a tight stop-loss just above the zone.
Stop-Loss Placement:
For Strong Supply Zone: SL above ₹4234.
For Higher Supply Zone: SL above ₹4248.
Targets: Book profits at logical RRR levels (1:2 or 1:3 for high probability setups).
Why Use Risk-Reward?
Helps you define targets objectively.
Protects capital with fixed stop-loss logic.
Avoids emotional exits; everything is pre-planned.
⚠️ Risk Management Tip: Always trade with a clearly defined stop loss. Avoid entering positions impulsively. It is advisable to start with a smaller quantity and increase your exposure only if the price action confirms the continuation of the trend. Capital protection should always be the priority.
📢 Disclaimer
This content is created purely for educational and informational purposes. It is not intended as investment advice, stock recommendations, or trading tips. Trading and investing in the stock market involves risk. Please consult with a SEBI-registered financial advisor before making any investment decisions. The author/creator is not registered with SEBI and shall not be held responsible for any losses incurred based on this information. Always do your own research and use proper risk management.
👉 If you found this analysis helpful, don’t forget to Follow, so you never miss out on a trade-worthy setup, breakout opportunity, or valuable educational insight again. Stay updated and trade smarter! 💡📈
5 Amazing Swing trading ideas discussion I make educational content videos for swing / positional trading

HEROMOTOCO | Weekly Breakout Analysis📉 Yellow Line — Weekly Counter-Trendline (WTF CT) resistance finally broken with conviction. This line guided the entire downtrend and its breach signals a strong structural shift.
📈 Red Parallel Channel — A hidden resistance channel formed during the recent consolidation phase. Price climbed within this tight range and has now broken out, confirming internal strength and directional intent.
🟧 Orange Horizontal Line — Major Monthly Time Frame (MTF) resistance, which now acts as the next crucial target. The breakout candle has enough space to breathe before testing this overhead level.
⚪ White Dotted Line — Daily Time Frame (DTF) counter-trendline that had already been broken earlier, providing early signs of reversal. Serves as a great precursor to the higher timeframe breakout.
📊 Volume: Weekly breakout accompanied by ~5.57M volume — exceeding the 50K benchmark required for WTF breakout validation. Strong institutional interest is evident.
🟩 Structure: Price has formed a higher low base and broke out cleanly above all marked resistances — a sign of strength across all timeframes.

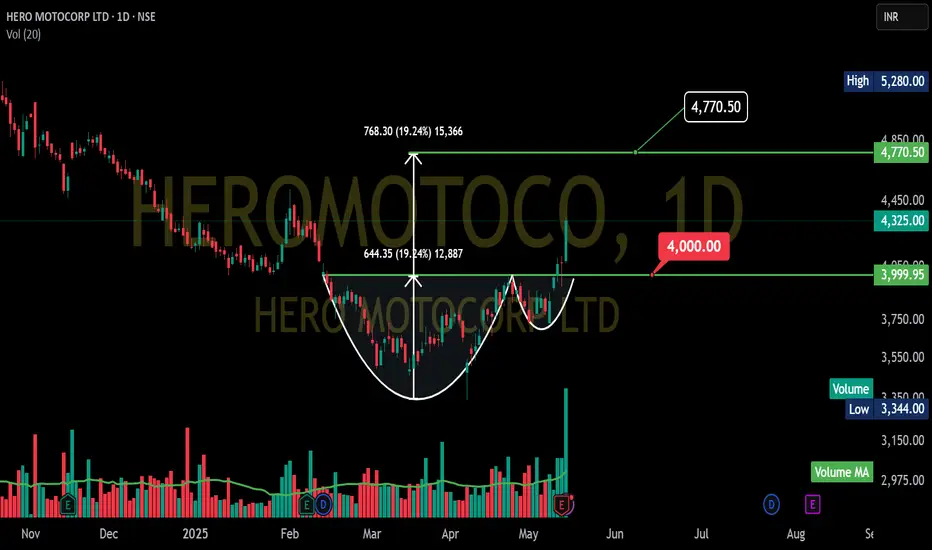
HEROMOTOCO - Daily Chart- CuP and HandleHERO MOTOCORP LTD daily chart, it seems like an interesting setup is forming.
It is potential cup and handle pattern. The "cup" portion appears to have formed between roughly early February and late April, and we might be seeing the beginning of the "handle" now.
Here's a breakdown of what I'm seeing:
Cup: The price has made a rounded bottom, suggesting a consolidation phase.
Handle (Potential): After reaching a high around ₹4,325, the price has pulled back slightly. If this pullback remains relatively shallow and trends upwards again, it could form the handle.
Breakout Level: Resistance level around ₹4,325. A decisive break above this level could signal the completion of the cup and handle pattern.
Target: Potential target around ₹4,770.50, which aligns with a common way to estimate the target of a cup and handle (measuring the depth of the cup and adding it to the breakout level). The calculation you've shown (₹4,325 + (₹4,325 - ₹3,680) ≈ ₹4,970) is slightly different but still in the same ballpark.
It's important to remember that this is just a potential pattern, and there's no guarantee it will play out. We need to see if the handle formation completes and if the price breaks out above that ₹4,325 level with good volume to confirm the pattern.
Keep an eye on the price action and volume in the coming days to see if this bullish setup materializes! Let me know if you have any other questions.
Heromoto Co - Excellent R:R OpportunityStock at strongest support zone of 4040 - 4090
High chance of bounce back from this area
Risk to reward excellent with upside targets of 4550 & 4950
View negates below 4030
Plain n Simple Analysis

HEROMOTOCO Mega Breakout AheadHey Family, there is a one more stock Which is showing a great opportunity.
Key Points:-
* Formation of Rectangular box Pattern in Daily TF.
* From Jun 2024 to Sep 2024 its in range.
* From Jun 2024 to Sep 2024 Tested & Moving Resistance Many times.
* It's Near resistance Zone and trying to Break Resistance Zone with good volume, good Closing Required.
* Volume is Missing.
What is your view please comment it down and also boost the idea this help to motivate us. We are Certified. All views shared on this channel are my personal opinion and is shared for educational purpose and should not be considered advise of any nature.

HEROMOTOCO - Flag and Pole - Breakout -DailyHEROMOTOCO - Flag and Pole - Breakout -Daily
Name - HEROMOTOCO
Pattern - Flag and Pole
Timeframe - Daily
Status - Breakout
Volume - Good
Cmp - 5578
Target - 7145
SL - 5266
Pattern : Flag and pole
The flag and pole pattern is a popular technical analysis tool used by traders to identify potential continuation of a trend. Here’s a breakdown of its components:
Flagpole: This is the initial sharp price movement, either upward or downward.
Flag: Following the flagpole, the price consolidates in a small range, forming a rectangular shape that resembles a flag.
Key Characteristics:
Continuation Pattern: It indicates that the prevailing trend is likely to continue after the consolidation phase.
Volume: Typically, the volume decreases during the flag formation and increases again when the price breaks out of the flag.
Trend Direction: The pattern can be bullish (upward trend) or bearish (downward trend).
Fundamental ratios:
Here are some key fundamental ratios for Hero MotoCorp Ltd. (HEROMOTOCO):
Profitability Ratios:
Return on Equity (ROE): 18.5%
Return on Capital Employed (ROCE): 22.3%
Net Profit Margin: 10.4%
Valuation Ratios:
Price to Earnings (P/E) Ratio: 19.2
Price to Sales (P/S) Ratio: 2.75
Enterprise Value to EBITDA (EV/EBITDA): 19.18
Solvency Ratios:
Debt to Equity Ratio: 0.05
Current Ratio: 1.5
Efficiency Ratios:
Asset Turnover Ratio: 1.2
Inventory Turnover Ratio: 5.3

HERO MOTOCORP LTDImportant points marked.
*****Education purpose only*****
*****Investing in Equity is subjected to market risk do own research before investing*****

SENSEX Levels // 2 Hours
Hello Everyone 👋
Support Levels:
First Support: 80,950
Second Support: 80,700
Third Support: 80,450
Resistance Levels:
First Resistance: 81,200
Second Resistance: 81,450
Third Resistance: 81,700
These levels are derived from technical analysis and can help identify potential entry and exit points for trading

MACD Crossover Swing Trade📊 Script: NESTLEIND
📊 Nifty50 Stock: YES
📊 Sector: FMCG
📊 Industry: Food - Processing - MNC
⏱️ C.M.P 📑💰- 2622
🟢 Target 🎯🏆 - 2769
⚠️ Stoploss ☠️🚫 - 2560
📊 Script: ADANIPORTS
📊 Nifty50 Stock: YES
📊 Sector: Marine Port & Services
📊 Industry: Miscellaneous
⏱️ C.M.P 📑💰- 1341
🟢 Target 🎯🏆 - 1426
⚠️ Stoploss ☠️🚫 - 1293
📊 Script: HEROMOTOCO
📊 Nifty50 Stock: YES
📊 Sector: Automobile
📊 Industry: Automobiles - Motorcycles / Mopeds
⏱️ C.M.P 📑💰- 4722
🟢 Target 🎯🏆 - 4949
⚠️ Stoploss ☠️🚫 - 4597
📊 Script: AMBUJACEM
📊 Nifty50 Stock: NO
📊 Sector: Cement
📊 Industry: Cement - North India
⏱️ C.M.P 📑💰- 612
🟢 Target 🎯🏆 - 650
⚠️ Stoploss ☠️🚫 - 592
📊 Script: BERGEPAINT
📊 Nifty50 Stock: NO
📊 Sector: Paints/Varnish
📊 Industry: Paints / Varnishes
⏱️ C.M.P 📑💰- 573
🟢 Target 🎯🏆 - 603
⚠️ Stoploss ☠️🚫 - 558
⚠️ Important: Always maintain your Risk & Reward Ratio.
✅Like and follow to never miss a new idea!✅
Disclaimer: I am not SEBI Registered Advisor. My posts are purely for training and educational purposes.
Eat🍜 Sleep😴 TradingView📈 Repeat 🔁
Happy learning with trading. Cheers!🥂

HEROMOTOCO Signaling Bearish Point Of ViewAfter years of rallying up, then it turns to a fall forming a double top pattern. When we draw from the high point to the low point using Fibonacci retracement, the 0.5 Fibonacci retracement level taken and continues the fall.
"Note: I will maintain charts in a simple way. Only those with basic knowledge of technical analysis will be able to understand what I am posting."

SEXY Bearish Divergene spotted in HEROMOTOCORPI believe in technical analysis and I have been astonished about the accuracy when used properly, this is one of those cases.
The Peak can be considered as Stoploss

Where will Hero Motocorp head?Hero Motocorp is trading around the levels from where in can give either side move. The stock has retest the 61.8% fibonacci levels and after takin support from the level it retested and reversed from 50% level of the recent down swing.
So the stock right now is trading around 3000 levels and has formed a gravestone doji after a big 7% bearish move last week. Though the stock is showing some bullish moving averages cross over and is coming to retest the moving average.
After the tie up for supplying Harley Davidson bike the stock shooted up. The stock tried to consolidate around the recent high but couldn't hold the path and has given a fall from there.
The stock on the daily time frame, is trading around the 20 ema and has consolidated near the higher levels of recent swing. Intraday, swing and positional all opportunities are there in this stock as the stock has closed near a support zone and has consolidated in a range for 4 days.
If the stock breaches the swing low, a bearish trade can be initiated and continued with a trailing stop loss. The stock can give 1-2% move on the intraday levels and much more in positional trades.
Entry 1 :- Below 2980
Target :- 2930, 2860(with trailing SL)
Stoploss :- 2995
Entry 2 :- Above 3080
Target :- 3185
Stop loss :- Can be a close below 20/200 ema on hourly charts.
The stock is somewhat on the lower range and there are much more chance of a bearish move. If the stock opening gap up avoid trading the stock for intraday as it can trade in a range.
Trade only once the stock start trading outside the box.
Wait for the price action near the levels before entering the trade.

NSE HEROMOTOCO: Are Bulls Strong Enough to Sustain Impulse?Timeframe: 30 min
Brief analysis:
HEROMOTOCO has started a five-wave impulse cycle from the low of 2745.5. Price has accomplished wave Y of wave (4) and started impulsive wave (5). Buyers will have an opportunity with a captivating risk reward to ride the trend after confirmation for the following targets: 3167 – 3210 – 3260+ .
In-depth analysis:
NSE HEROMOTOCO has formed an impulsive cycle after an extreme low. In this case, the security is trading above the 20,50, 100, and 200 EMAs, which indicates that the bulls are in control. The formation of wave two was a running flat which retraced 0.618% of wave (1) at 2795. The third wave was an extensive wave that extended 3.618% of wave 1.
Wave 4 has formed a double zigzag formation with wave W-X-Y, in which wave W was a zigzag, and wave Y is an expanding triangle. The retracement of wave (4) is 0.382 of wave 3. Currently, the price has broken out and traded above wave d, which signals that the big move is about to unfold.
Corrective structure always holds by either wave X or B-D trendline in expanding triangle. The price can take a retracement if the demand is growing with low volume. If the price breaks out at 3131, traders can initiate a long position for the following targets: 3167 – 3210 – 3260+ . The setup will be invalid after the breakdown of wave e.
Target measurements:
100% Reverse Fibonacci of the 4th wave at 3208, and 38.2% extension of wave 1 through the 3rd wave at 3212.
50% Fibonacci extension of wave 1 through 3rd wave at 3261.
Nearby high of wave B at 3167.
We will update further information soon.

HEROMOTOCO- Set to Outperform the Auto Index!Attached: HEROMOTOCO/ NIFTY AUTO Weekly Chart as of 28th April 2023
The Chart is Clearly indicating a Terminal Wave in the form of an Ending Diagonal with a Massive Bullish RSI Divergence
So long Hero MotoCorp has been ignored by the Market and Underperforming within the Auto Index
Get Ready Now because the Stock will see a Change in Trend from Down to UP
and INVESTOR Money is expected to start flowing into this Stock
Makes a Case to Buy an Outperforming Stock
See my Related Idea on HEROMOTOCO Outperforming Index Nifty 50, that is another evidence that supports the Bullish View

HEROMOTOCO- Relative Strength says BUY!Attached: HEROMOTOCO/ NIFTY 50 Weekly Chart as of 28th April 2023
The above Ratio Chart also called a Relative Strength Chart shows that the Stock HEROMOTOCO is set to Outperform the Index Nifty 50 and has given a Buy Signal on this Ratio Chart based on Elliot Wave Theory
Wave 1/ A was a 5 wave Impulse
Ratio retraced to 0.786 in Wave 2/ B as a 3 wave Corrective
AND NOW,
Wave 3/ C to the Upside is set to start/ has started already and this means the Stock is expected to Outperform the Market from here, making it a BUY as you always buy Outperformers because that is where the Strength is!
Note: The Stock has Earnings on 4th May, Thursday

HEROMOTOCOENTRY TARGET SL Mention in the chart.
ALWAYS TAKE TRADE WITH CONFIRMATION
Note : Trading in any financial market is very risky. I post ideas for educational purpose only. It is not financial advice. Do not hold us responsible for any potential loss you may incur. Please consult your financial adviser before trading.
