HGS - Rising Wedge Breakout on Volume Spike | Daily Chart📊 HGS – Rising Wedge Breakout on Volume Spike | RSI Above 70 | Fresh Bullish Momentum
📅 Chart Date: July 17, 2025
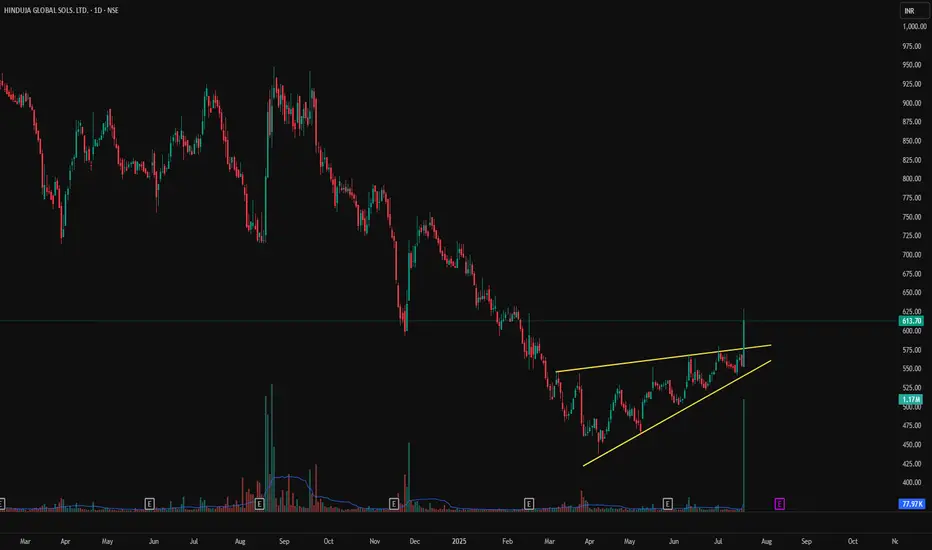
📍 CMP: ₹613.70 (+10.72%)
📈 Symbol: NSE:HGS | 1D Timeframe
🔍 Technical Analysis Breakdown
🔺 Rising Wedge Breakout
Price broke above the upper resistance of a rising wedge pattern.
Strong confirmation with a wide bullish candle and volume spike.
📊 Volume Surge
Volume: 1.17M against average volume of ~78K
Sudden institutional interest or news-based momentum likely behind the move.
📉 RSI (14, close): 73.03
RSI crossed into overbought territory, showing strong bullish momentum but could warrant caution or consolidation soon.
📌 Support & Resistance Levels
Breakout Zone: ₹580–₹590
Next Resistance: ₹650+ (gap-fill zone from earlier breakdown)
Support: ₹560 (upper trendline of broken wedge)
📌 Key Observations
First strong breakout since months of sideways to bullish accumulation.
Sustained close above ₹590–₹600 will confirm continuation.
Caution if price retraces inside wedge again.
🏁 Trade Setup
Entry: On Retest of ₹590–₹600
Target: ₹650 / ₹675
Stoploss: Below ₹560
Risk Level: Moderate (due to overbought RSI)
⚠️ Disclaimer: This is an educational chart setup and not trading advice. Please conduct your own research and risk management.
📣 Follow @PriceAction_Pulse for more such clean breakouts and chart pattern analysis!
🔁 Drop a comment if HGS is on your radar for the next breakout rally 📈
HGS
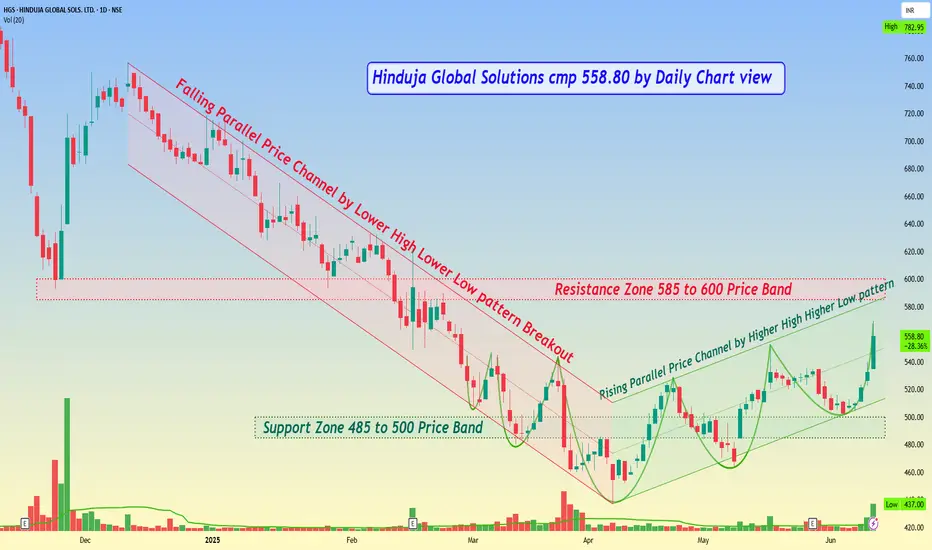
Hinduja Global Solutions cmp 558.80 by Daily Chart viewHinduja Global Solutions cmp 558.80 by Daily Chart view
- Support Zone 485 to 500 Price Band
- Resistance Zone 585 to 600 Price Band
- Rising Parallel Price Channel by Higher High Higher Low pattern
- Falling Parallel Price Channel by Lower High Lower Low pattern Breakout
- Multiple Bullish Rounding Bottoms and faintly considerate VCP pattern too
- Volumes had been rising since mid of May 2025, now above avg traded quantity
- *This is purely by technical analysis setup and nothing from fundamental front about it*
HGSHGS at its Major Support & Looking good for Longterm if make some Base formation & sing to reversal we can see such a good targets in Upcoming Days


HGS - Ichimoku Bullish Breakout Stock Name - Hinduja Global Solutions Limited
Ichimoku Cloud Setup :
1). Today's close is above the Conversion Line
2). Future Kumo is Turning Bullish
3). Chikou span is slanting upwards
All these parameters are showing bullishness at Current Market Price
and more bullishness AFTER crossing 1428
#This is not Buy and Sell recommendation to any one. This is for education purpose and a helping hand to learn trading in Market.
# Cloud Trading
# Ichimoku Cloud
# Ichimoku Followers
I hope you all like my analysis.
Please do share your thoughts into comment section.
Please give a like, it motivates me to do analysis.

Head N Sholder in HGSHop Success ful break out Head N Sholder Pattern.
Head and shoulders formed in 1 Day timeframe. There is more possibility for bullish . For conservative entry wait untill break out 1400 level and then go for entry.
Target is T1 1580, T2 1683, T3 1780,

HGS Head and Shoulders Pattern BreakoutHi Traders / Investors ,
Probably there can be a bearish momentum in Hinduja Global Sol because of following reasons :-
1) Formation of Head and Shoulders Chart Pattern , which is mainly considered Bearish in nature.
2) It gave breakout below neckline of pattern and is retested.
3) It can fall maximum upto 32 % , as it also has a support at 2000 price level ,where prior resistance will act as a support.
4) The Head of the Pattern also has a gap of 32% from neckline , so we can also expect that it can fall upto 32 %.
This is not a trading advice ,Its just an analysis.
So don't take any decisions solely based on this.
Please give a thumbs up if liked this analysis , as it requires deep study.

HINDUJA GLOBAL RSI Breakout
Symmetrical Triangle Breakout
MACD Crossover
Long Consolidation seems to be over so a good move can be expected.
Above a close of 3090, the momentum will pick up.

Hinduja Global Solutions LimitedBullish MACD crossover and gap up opening after triangle breakout in Hinduja Global Solutions Limited


HGS ATH breakout #Super BullishKey Points:-
1.) Trading at all time high with big volumes.
2.) Supported by Ascending triangle breakout.
3.) Support near 1800-1850
4.) Target -2300-2500
5.) Stop loss - 1600(daily closing)
Only for educational Purpose

Pole And Flag pattern#hgs #chartpattern #flagpattern
Pole And Flag pattern on daily chart Time frame
Happy LEARNING

DAILY SWING CALL // Wednesday 17th of March 2021 / HGSDAILY SWING CALL // Wednesday 17th of March 2021 / NSE:HGS
// This is a swing trade call and not an intra-day trade. Please do not expect the stock to go up on the same day of posting or within a few sessions. Please follow the notes along with the posting before, during and after entering the trade //
CMP / LTP: 1205
TARGET: + 1385 (15% Around)
STOP LOSS: 1085 (10% Max)
Standard Notes:
- Please follow the Stop Loss strictly and preferably on a daily closing basis.
- Recommended Profit Booking / Exit is on +12-15% & If you still want to hold the stock, trail the SL once this target is achieved.
- Duration: 15-20 Trading Days is suggested for all my trades and is an indicative period.
- If SL / Target are not triggered and you still wish to hold the trade, this can be done as long as SL is followed or trailed.
Disclosure: I may or may not have a position in this trade.
Disclaimer: All the recommendations are subject to market conditions. Please trade at your own risks.

HGS Swing Trade ideaHGS has given a huge fresh Breakout with supporting volumes.
Swing Traders can enter in this at pull back in range of 1050-1080 for the target of 1230 , 1300+
