SHARDACROP: Strong Q3, Descending Trainlge BO, Chart of the WeekFrom Descending Triangle Breakout to Q3FY26 Glory: Why Sharda Cropchem's Could Be Your Next Big Move Lets Understand in "Chart of the Week"
As per the Latest SEBI Mandate, this isn't a Trading/Investment RECOMMENDATION nor for Educational Purposes; it is just for Informational purposes only. The chart data used is 3 Months old, as Showing Live Chart Data is not allowed according to the New SEBI Mandate.
Disclaimer: "I am not a SEBI REGISTERED RESEARCH ANALYST AND INVESTMENT ADVISER."
This analysis is intended solely for informational purposes and should not be interpreted as financial advice. It is advisable to consult a qualified financial advisor or conduct thorough research before making investment decisions.
Price Action Analysis:
Long-Term Trend Overview:
- The stock has demonstrated a multi-year uptrend from 2021 levels around 300-350 to current levels near 1,035
- A significant rally occurred from mid-2021 to early 2025, where the stock surged from approximately 350 to an all-time high of 1,181
- Post the January 2025 peak, the stock has entered a consolidation phase with a descending triangle pattern formation
- Current price of 1,035.85 (as of January 31, 2026) represents a 28.46% gain, showing strong momentum recovery
Recent Price Action Characteristics:
- The stock made an all-time high of 1,181 in early January 2025
- Following the peak, a corrective phase ensued with the formation of lower highs
- A clear descending trendline can be observed connecting the highs from January 2025 peak through subsequent rallies
- The stock found support multiple times around the 750-800 zone, establishing this as a critical demand area
- On January 31, 2026, the stock broke above the descending trendline with a strong bullish candle supported by robust volumes (11.25M shares traded)
Key Technical Patterns:
- Descending Triangle Pattern: The chart clearly shows a descending triangle structure with lower highs and a flat support base around 750-800
- Trendline Break: The recent price action has broken through the descending resistance trendline, which is a classic bullish reversal signal
- The breakout was accompanied by good volumes of 2.03M (shown in green), indicating strong buying interest
- The price action suggests a potential trend reversal from the consolidation phase to a new uptrend
Volume Spread Analysis:
Volume Trends and Characteristics:
- The volume chart shows sporadic high-volume days during the entire period
- The recent breakout candle is accompanied by elevated volumes of 11.25M shares
- Volume of 11M is above average, confirming the validity of the breakout
- Historical volume spikes are observed during significant price movements, both up and down
Volume-Price Correlation:
- During the 2021-2022 rally, several high-volume green bars supported the upward price movement
- The consolidation phase from January 2025 to January 2026 saw relatively lower volumes, typical of a basing pattern
- The recent breakout is validated by the volume surge, a positive technical sign
- Absence of high red volume (selling pressure) during the breakout indicates limited supply
Volume Implications:
- The volume profile suggests strong institutional participation during key price movements
- The current breakout with good volume indicates conviction among buyers
- Sustained volumes above the 2-3M range would confirm continued buying interest
- Any pullback on lower volumes would be healthier and offer better entry opportunities
Support and Resistance Analysis:
Major Support Levels:
- Primary Support Zone: 750-800 (tested multiple times during the consolidation phase, proving to be a strong demand zone)
- Secondary Support: 700 (psychological level and previous consolidation area)
- Critical Support: 600-650 (major swing low from mid-2024, breaking this would invalidate the bullish structure)
- Long-term Support: 500 (aligns with historical resistance turned support from early 2024)
Major Resistance Levels:
- Immediate Resistance: 1,100 (previous consolidation high and psychological barrier)
- All-Time High Resistance: 1,181 (needs to be reclaimed for continuation of uptrend)
- Potential Resistance: 1,200-1,250 (psychological round numbers)
- The broken descending trendline around 900-950 zone may now act as support on any pullbacks
Base Formation Analysis:
- The stock has formed a strong multi-week base between 750 and 800
- This base structure resembles a consolidation platform after a strong uptrend
- The base formation duration provides strong foundation for the next leg up
- The base is indicating accumulation rather than distribution
Technical Pattern Analysis:
Descending Triangle Breakdown and Resolution:
- Pattern Formation: The descending triangle started forming from the January 2025 high at 1,181
- Pattern Characteristics: Lower highs (descending resistance) meeting horizontal support at 750-800
- Pattern Resolution: The recent upward breakout from the descending trendline on January 31, 2026
- Breakout Confirmation: Strong bullish candle with +28.46% gain and volume of 11.25M shares
Short-Term Trend Assessment:
- The recent breakout candle establishes a strong bullish bias in the short term
- The stock has moved from a downtrend (within the triangle) to potentially starting a new uptrend
- Higher high formation above 1,035 would confirm the trend reversal
- The immediate trend is bullish with the breakout above both the trendline and the 900-950 resistance cluster
Medium-Term Outlook:
- The stock needs to sustain above 950-1,000 levels to confirm medium-term bullish structure
- A move above the previous high of 1,181 would resume the primary uptrend
Long-Term Perspective:
- The overall structure from 2021 remains bullish with higher lows and higher highs
- The current consolidation is a healthy correction within a larger uptrend
- Long-term investors can view the 750-800 zone as a strong accumulation area
- The secular trend in the agrochemical sector supports the long-term bullish thesis
Fundamental and Business Overview:
Company Profile and Business Model:
- Sharda Cropchem Ltd is engaged in the marketing and distribution of agrochemicals globally
- The company operates an asset-light business model, focusing on identifying generic molecules, preparing dossiers, seeking registrations, and marketing through distributors
- Core product portfolio includes formulations and generic active ingredients across fungicide, herbicide, and insecticide segments
- The company also operates a non-agrochemicals business including conveyor belts, V-belts, dyes, and industrial chemicals
Geographic Revenue Distribution:
- Europe: Contributes approximately 53% of agrochemical revenue, making it the largest market
- NAFTA (North America): Accounts for around 34% of agrochemical business
- Latin America (LatAm): Represents about 9-10% with high growth potential
- Rest of World: Includes India and other emerging markets
- The company has a presence across 80+ countries with over 150 distributors in India alone
Registration Portfolio and Competitive Moat:
- The company has 2,821 active product registrations globally as of March 2023
- Strong pipeline of 1,143 registrations under process, mainly in EU, US, and LatAm
- The registration process serves as a significant entry barrier due to high costs, complexity, and time requirements
- The company invests approximately 350-400 crores per annum toward new product registrations
- Registrations in highly regulated markets (EU, US) provide sustainable competitive advantages
Recent Financial Performance:
Q3 FY26 Results Highlights (Quarter Ended December 2025)
- Net Sales: Rs 1,288.76 crores, representing 38.7% YoY growth
- Net Profit: Rs 145.12 crores, a stellar 365.87% YoY surge from Rs 31.15 crores in Q3 FY25
- PAT Margin: Expanded dramatically to 11.26% from 3.35% in Q3 FY25, a gain of 791 basis points
- Gross Profit Margin: Stood at 20.32%, significantly improved from 12.36% in Q3 FY25
- The margin expansion reflects improved product mix, better pricing realization, and effective cost management
Nine-Month FY26 Performance (April-December 2025):
- Consolidated Net Sales: Rs 3,202.68 crores, up 27.57% YoY
- Net Profit: Rs 362.21 crores, representing 257.33% YoY growth
- ROCE: Impressive 20.85% for the nine-month period, the highest recorded in recent periods
- The company declared an interim dividend of Rs 6 per share
- Strong cash generation and zero-debt balance sheet underscore financial strength
Financial Trend and Quality Metrics:
- Five-year Sales CAGR: 17.65%, demonstrating consistent top-line growth
- Five-year EBIT CAGR: 21.17%, showing strong operational leverage
- Debt Status: Company is almost debt-free, providing financial flexibility
- EBIT to Interest Coverage: Average of 100 times, indicating negligible debt burden
- Return on Equity: Currently at 9.89% over last 3 years (considered low, but improving)
Sectoral and Industry Backdrop:
Indian Agrochemical Market Overview
- Market Size: The Indian agrochemical market is valued at approximately USD 8-9 billion in 2025
- Growth Trajectory: Expected to grow at a CAGR of 5.5-7.5% during 2026-2032 period
- Market Drivers: Rising population, increasing food demand, agricultural intensification, and government support
- India is ranked as one of the top 10 consumers and producers of agrochemicals globally
Market Dynamics and Growth Drivers:
- Food Security Imperative: India's population projected to reach 1.5 billion by 2030, necessitating enhanced agricultural productivity
- Crop Loss Prevention: Annual crop losses due to pests, weeds, and diseases estimated at 15-25%, valued at USD 10-15 billion
- Land Constraints: Declining arable land per capita due to urbanization drives need for yield optimization
- Technology Adoption: Increasing adoption of precision farming, drone spraying, and fertigation systems
- Export Opportunity: India's status as a net exporter strengthened by global demand for generic agrochemicals
Government Initiatives and Policy Support
- Make in India: Government recognizes agrochemical industry as one of top 12 industries for global leadership
- Subsidy Programs: Continued support through fertilizer subsidies (INR 3.68 lakh crore committed till March 2025)
- PM-PRANAM Scheme: Launched in 2023 to incentivize balanced fertilizer use and alternative technologies
- Drone Subsidies: Up to 40% subsidy on drone purchases for precision spraying
- Digital Infrastructure: Integration of land records, soil health cards, and farmer databases to facilitate input access
Segment-wise Market Trends
- Fertilizers: Hold 55% market share, driven by high applicability across all cropping systems
- Pesticides: Growing at faster CAGR of 10.52% through 2030, with focus on herbicides and fungicides
- Insecticides: Dominate with 72.5% of pesticide market due to tropical climate and pest pressure
- Biopesticides: Emerging segment accounting for 15% of market, driven by sustainability focus
- Regional Dynamics: South India projected to show highest growth due to horticulture and high-value crop expansion
Industry Challenges and Headwinds:
- Chinese Dependence: High reliance on Chinese suppliers for raw materials and active ingredients
- Import Dependency: Trade deficit of around USD 31 billion in chemicals sector due to infrastructure bottlenecks
- Pricing Pressure: Competition from low-priced Chinese products putting pressure on realizations
- Regulatory Complexity: Increasing cost of registrations and re-registrations in developed markets
- Working Capital Intensity: Large inventory and receivables requirements due to wide product portfolio and geography
Competitive Positioning and Business Strengths:
Sharda's Competitive Advantages:
- Asset-Light Model: Focus on registration, marketing, and distribution rather than manufacturing
- Registration Moat: 2,821 active registrations create significant barriers to entry
- Global Footprint: Presence in 80+ countries with diversified revenue streams
- Developed Market Focus: 83-85% revenue from Europe and NAFTA, which are high-value, stable markets
- Debt-Free Balance Sheet: Provides financial flexibility for growth investments
Business Model Strengths:
- Third-Party Manufacturing: Partnerships with manufacturers allow capital-efficient scaling
- Diversified Portfolio: Over 200 products across multiple crop protection categories
- Strong Pipeline: 1,143 registrations in process ensure future revenue visibility
- Direct Sales Force: Building own sales teams in key markets (Europe, US, Canada, Mexico) in addition to distributors
- Non-Agro Diversification: 17% revenue from non-agrochemical business reduces concentration risk
Strategic Positioning in Generic Agrochemicals:
- Generic Focus: Targets off-patent molecules where 75% market share is still held by innovators
- Value Proposition: Offers cost-competitive alternatives to multinational brands
- Regulatory Expertise: Proven capability in navigating complex registration processes in developed markets
- Customer Relationships: Supplies to MNCs as well as end customers, providing multiple revenue channels
- Quality Compliance: Meets stringent regulatory standards of EU and US markets
Valuation Metrics:
- P/E Ratio: Trading at 20x trailing earnings, below industry average of 29x
- EV/EBITDA: 10.61x appears reasonable given the 365.87% profit growth trajectory
- PEG Ratio: 0.18 suggests the stock is significantly undervalued relative to its growth
- Dividend Yield: 0.91% with conservative payout ratio of 84.89% for FY25
Key Strengths:
- Strong quarterly momentum with 365.87% YoY profit growth in Q3 FY26
- Expanding margins (PAT margin up 791 bps YoY) indicating operational improvement
- Record ROCE of 20.85% demonstrating efficient capital deployment
- Zero-debt balance sheet providing safety and growth flexibility
- Technical breakout from year-long consolidation backed by strong volumes
Risk Factors and Concerns:
- Dependence on Chinese Suppliers: Raw material sourcing concentrated in China exposes to currency and policy risks
- Competitive Pricing: Generic nature of business faces pricing pressure from both innovators and other generic players
- Working Capital Intensity: High debtors of 165 days and large inventory requirements
- Regulatory Risks: Stroke of pen risk where simplified registration processes could erode competitive moat
- MNC Competition: Large multinationals with better brand equity and distributor relationships
- Seasonality: 35-40% revenue and 50-55% profit concentrated in certain quarters
Management Guidance and Outlook:
- FY26 Guidance: Company targets 15%+ topline growth with EBITDA margins in 15-18% range
- Capex Plans: Rs 400-450 crore planned investment in registrations for FY26
- Registration Pipeline: Focus on strengthening portfolio across Europe, NAFTA, and LatAm
- Margin Trajectory: Gross margins expected to stabilize around 30-35% range with input cost normalization
- Geographic Expansion: Continued strengthening of sales force in key markets
Sectoral Tailwinds Supporting Growth:
- Indian agrochemical market growing at 5.5-7.5% CAGR through 2032
- Global demand for generic agrochemicals increasing as patents expire
- Government support through Make in India and agricultural modernization programs
- Increasing adoption of precision farming and technology-driven agriculture
- Export opportunities expanding as India becomes a preferred sourcing destination
Monitoring Parameters:
- Volume Consistency: Weekly volumes should sustain above 1.5-2M for continued momentum
- Support Holding: 750-800 zone must hold on any pullbacks
- Quarterly Results: Track margin trends and volume growth in subsequent quarters
- Sectoral Trends: Monitor agrochemical industry news, Chinese raw material prices, and global demand
- Competitive Action: Watch for pricing pressures or market share changes
My 2 Cents:
- Sharda Cropchem has broken out of a descending triangle pattern with strong volumes
- The 750-800 support zone has proven to be a robust demand area tested multiple times
- Volume-backed breakout on January 31, 2026 (+28.46%) confirms buying conviction
- The stock is transitioning from consolidation to a potential new uptrend
- The stock presents a compelling combination of technical breakout and fundamental improvement
- Strong quarterly numbers have acted as a catalyst for the technical pattern resolution
- Valuation at 20x P/E with PEG of 0.18 suggests room for re-rating
- The 750-800 base provides a strong foundation for the next leg of upward movement
Full Coverage on my Mid-Week Newsletter coming Wednesday.
Keep in the Watchlist and DOYR.
NO RECO. For Buy/Sell.
📌Thank you for exploring my idea! I hope you found it valuable.
🙏FOLLOW for more
👍BOOST if you found it useful.
✍️COMMENT below with your views.
Meanwhile, check out my other stock ideas on the right side until this trade is activated. I would love your feedback.
As per the Latest SEBI Mandate, this isn't a Trading/Investment RECOMMENDATION nor for Educational Purposes; it is just for Informational purposes only. The chart data used is 3 Months old, as Showing Live Chart Data is not allowed according to the New SEBI Mandate.
Disclaimer: "I am not a SEBI REGISTERED RESEARCH ANALYST AND INVESTMENT ADVISER."
This analysis is intended solely for informational purposes and should not be interpreted as financial advice. It is advisable to consult a qualified financial advisor or conduct thorough research before making investment decisions.
Higherhighhigherlow

HINDCOPPER: Trendline and Triangle Breakout, Chart of the MonthWhy This NSE:HINDCOPPER Chart Could Signal India's Next Major Commodity Play, even after giving such a robust run so far. Let's Understand in the "Chart of The Month"
As per the Latest SEBI Mandate, this isn't a Trading/Investment RECOMMENDATION nor for Educational Purposes; it is just for Informational purposes only. The chart data used is 3 Months old, as Showing Live Chart Data is not allowed according to the New SEBI Mandate.
Disclaimer: "I am not a SEBI REGISTERED RESEARCH ANALYST AND INVESTMENT ADVISER."
This analysis is intended solely for informational purposes and should not be interpreted as financial advice. It is advisable to consult a qualified financial advisor or conduct thorough research before making investment decisions.
Price Action Analysis:
Long-Term Trend Structure:
- Historical Peak and Correction: The stock witnessed a spectacular rally in early 2010, reaching an all-time high of ₹658, marking its glory days during the global commodity super-cycle. This was followed by a brutal multi-year correction that took the stock down approximately 90% to levels near ₹55 by 2013.
- Extended Consolidation Phase (2013-2020): After the sharp decline, the stock entered a prolonged seven-year consolidation phase, oscillating between ₹40 and ₹90, building a massive base structure. This extended sideways movement allowed weak hands to exit and created a solid accumulation zone.
- The 2020-2023 Recovery Rally: Post-COVID recovery and commodity reflation themes triggered a strong upward movement from pandemic lows around ₹30-40 to the ₹90-120 range, marking the beginning of a structural reversal.
- Triangle Breakout Formation: The chart clearly displays a large ascending triangle pattern formed between 2020 and 2025, with the stock making higher lows while testing resistance near the ₹420-450 zone multiple times. The recent price action shows a decisive breakout above this multi-year resistance.
Current Price Action:
- Breakout and Retest: The stock has broken out from the ascending triangle pattern and is currently trading around ₹475.60 (as of December 27, 2025), showing a gain of approximately 45% from its recent breakout point.
- Intraday Movement: Current session shows strong volatility with an intraday high of ₹480.85 and a low of ₹443.25, indicating active participation from both bulls and bears near record levels.
- Short-Term Performance: The stock has surged over 75% in calendar year 2025 and has gained approximately 74.8% in the last six months, significantly outperforming the broader Nifty 50 index, which is up only 10.83% year-to-date.
Volume Spread Analysis:
- Volume Surge: The volume panel shows exceptional activity in recent sessions, with December 27 recording 494.78 million shares traded versus the 20-day average of 166.43 million shares, representing nearly 3x the normal volume. This indicates strong institutional and retail interest.
- Second Best Volume in History: Recent sessions have recorded the second-highest volume in the stock's trading history, suggesting a major accumulation or distribution phase.
- Volume Confirmation: The breakout from the triangle pattern is accompanied by robust volume expansion, which validates the move and reduces the probability of a false breakout.
Key Technical Levels:
Support Zones:
- Immediate Support: ₹415-420 zone, which represents the upper boundary of the recently broken triangle pattern. This level previously acted as resistance and should now provide support on any pullback.
- Secondary Support: ₹380-390 range, coinciding with the previous swing high from mid-2024.
- Major Support Base: ₹300-320 zone, which served as a strong consolidation area during the triangle formation phase. This represents a critical support level for the medium-term uptrend.
- Long-Term Base: ₹200-220 area, which marks the ascending trendline of the triangle pattern and would be a key level to watch in case of a deeper correction.
Resistance Zones:
- Immediate Resistance: ₹480-490 zone, representing the current all-time high region for this rally phase.
- Psychological Barrier: ₹500 level, a round number that often acts as psychological resistance.
- Historical Peak: ₹658 (all-time high from 2010), which remains the ultimate resistance target. However, adjusting for inflation and changed market conditions, this level may need to be recalculated.
Base Formation:
- Multi-Year Base (2020-2024): The stock carved out a large accumulation base between ₹150 and ₹450 over approximately four years, characterised by higher lows and repeated tests of the ₹400-420 resistance zone.
- Base Depth and Width: The base shows a well-structured pattern with good width (4+ years) and reasonable depth, which typically precedes significant upward moves.
Technical Patterns:
Ascending Triangle Pattern:
- Formation: Clear ascending triangle pattern visible from 2022 to 2025 with a flat top around ₹420-450 and rising bottoms connecting approximately ₹200 to ₹380.
- Breakout: Decisive breakout occurred in late 2024/early 2025 with strong volume confirmation.
Symmetrical Triangle:
- The cyan-colored triangle marked on the chart shows a shorter-term symmetrical compression pattern forming during 2024-2025, which has also been broken to the upside.
- This pattern suggests continuation of the bullish momentum with potential targets in the ₹500-550 range in the near term.
Higher Highs and Higher Lows:
- Since the 2020 bottom, the stock has consistently printed higher highs and higher lows, establishing a clear uptrend structure across multiple timeframes.
- Each correction has found support at progressively higher levels, indicating strong underlying demand.
Sectoral Backdrop:
Global Copper Market Dynamics:
- Supply-Demand Imbalance: The global copper market is sliding into a deficit, with the International Copper Study Group expecting a refined copper shortfall of around 150,000 tonnes in 2026, reversing previous surplus forecasts.
- Production Challenges: UBS forecasts deficits of 230,000 tonnes in 2025 and more than 400,000 tonnes in 2026 as mine disruptions in Chile, Peru and Indonesia collide with rising demand.
- Price Rally: International copper prices have surged approximately 36% year-to-date, reaching near-record levels above $12,000 per tonne on the LME, driven by tight supply and robust demand.
Structural Demand Drivers:
- AI and Data Centres: Data centres are estimated to need around 1.1 million tonnes of copper annually by 2030, close to 3% of global demand, representing a massive new source of inelastic demand.
- Electric Vehicles: Copper demand from the EV sector is projected to climb from 1.7 million tonnes per annum today to 4.3 million tonnes by 2035, growing at an annual rate of 10%.
- Energy Transition: The shift to renewable energy systems will require an additional 2 million tonnes of copper supply over the next decade, according to Wood Mackenzie research.
- Emerging Market Growth: India and Southeast Asia are expected to add 3.3 million tonnes of demand by 2035, translating to average annual growth rates of 7.8% and 8.2% respectively.
India-Specific Dynamics:
- Strategic Positioning: India is expected to surpass the United States as the world's third-largest copper consumer by 2050, reflecting rapid industrialisation and infrastructure development.
- Import Dependence: India currently imports a significant portion of its copper requirements, making domestic producers like Hindustan Copper strategically important.
- Government Focus: Copper has been included in the US Critical Minerals list, and similar designations globally highlight its strategic importance for economic and national security.
Fundamental Backdrop:
Company Overview:
- Monopoly Position: Hindustan Copper is the only Indian company mining copper and owns all the operating mining leases of copper ore in India, having access to about 45% of India's copper ore reserves and resources as of FY25.
- Vertical Integration: The company is India's sole vertically integrated copper producer, with operations spanning mining, ore beneficiation, smelting, refining, and rod extrusion.
- Government Backing: HCL is a Miniratna Category-I Central Public Sector Enterprise under the Ministry of Mines, providing it with government support and strategic importance.
Production and Operations:
- Production Capacity: Hindustan Copper produced approximately 537,000 tonnes of copper in the financial year 2025, outperforming private sector peers.
- Resource Base: The company holds resources and reserves of 755.32 million tonnes estimated as of April 1, 2024.
- Operational Units: HCL operates mines at Malanjkhand (Madhya Pradesh), Khetri (Rajasthan), and the Indian Copper Complex at Ghatsila (Jharkhand), along with smelting and refining facilities.
Recent Financial Performance:
- Strong Growth: Hindustan Copper reported a 39.1% quarter-on-quarter increase in consolidated revenues for Q2 FY 2025-26, with year-on-year growth of 38.5%.
- Profitability: Net profit increased 38.5% QoQ and 83% YoY in Q2 FY26, demonstrating strong operational leverage.
- Debt Reduction: The company has significantly reduced its debt burden, improving financial health and flexibility for expansion projects.
Strategic Initiatives:
- Revival of Rakha Mine: The company successfully executed a mining lease deed for the strategically important Rakha Mine in September 2024, which should boost future copper output.
- International Collaboration: HCL signed an MoU with CODELCO, Chile's state-owned copper mining giant, in April 2025 to exchange expertise and enhance capabilities in mineral exploration and processing.
- Expansion Plans: An MoU with NTPC Mining Ltd was signed in December 2025 to jointly pursue copper and critical minerals block auctions, indicating an aggressive expansion strategy.
- State-Level Partnerships: MoU signed with Madhya Pradesh State Mining Corporation for exploration of critical minerals, including copper, in the state.
Valuation Metrics:
- PE Ratio: The stock trades at a trailing PE of approximately 80x, which is elevated but reflects its monopoly position and growth expectations.
- Market Capitalisation: As of December 27, 2025, the company's market cap stands at approximately ₹42,992 crore.
Key Developments:
- LIC Stake Sale: Life Insurance Corporation of India reduced its stake from 6.086% to 4.072% through open market sales between August 2024 and December 2025, representing a booking of profits after the strong rally.
Risk Factors:
Technical Risks:
- Overextension: The stock has rallied 75% year-to-date and is trading well above its intrinsic value estimates, suggesting vulnerability to profit-booking.
- Resistance Ahead: The stock is approaching psychological resistance at ₹500 and faces uncertain price discovery beyond current levels.
- Volume Concerns: Extremely high volumes could indicate climactic buying, which sometimes precedes consolidation or correction phases.
Fundamental Risks:
- Commodity Price Volatility: As a pure-play copper producer, the company is susceptible to international copper price fluctuations.
- Production Constraints: Several of the company's smelting and refining facilities have remained suspended since 2019, limiting downstream value addition.
- Operational Efficiency: The company currently sells copper concentrate rather than finished products from some facilities, reducing margins.
- Execution Risk: Ambitious expansion plans through auctions and partnerships carry execution and capital deployment risks.
Market Risks:
- Valuation Multiple Compression: At current elevated valuations, any disappointment in earnings growth or copper prices could trigger sharp corrections.
- Global Economic Slowdown: Recession fears or China slowdown could impact copper demand despite structural growth drivers.
- Supply Response: Higher prices may eventually incentivise new supply additions globally, potentially easing the deficit.
Bull Case:
- India's Only Copper Miner: Monopoly position in copper ore mining provides strategic moat and pricing power.
- Structural Demand Drivers: AI, EVs, renewable energy, and India's industrialisation create multi-year demand tailwinds.
- Supply Deficit: Global copper market moving into deficit with limited near-term supply additions supporting prices.
- Operational Leverage: Fixed cost base means higher copper prices flow directly to the bottom line.
- Strategic Importance: Government backing and critical mineral status provide support for expansion.
Bear Case:
- Extreme Valuation: Trading at a 257% premium to intrinsic value leaves little room for error.
- Production Limitations: Suspended facilities and the concentrate sales model limit revenue potential.
- Execution Uncertainty: New projects through auctions are years away from production.
- Commodity Cyclicality: Copper prices could correct sharply if macro conditions deteriorate.
- Institutional Profit-Booking: LIC stake reduction signals some smart money taking profits.
My 2 Cents:
NSE:HINDCOPPER is at a critical juncture, benefiting from a rare combination of technical breakout, commodity super-cycle dynamics, and structural demand shifts driven by AI and electrification. But at these elevated valuations, be cautious and have disciplined risk management.
Full Coverage on my Mid-Week Newsletter coming Wednesday.
Keep in the Watchlist and DOYR.
NO RECO. For Buy/Sell.
📌Thank you for exploring my idea! I hope you found it valuable.
🙏FOLLOW for more
👍BOOST if you found it useful.
✍️COMMENT below with your views.
Meanwhile, check out my other stock ideas on the right side until this trade is activated. I would love your feedback.
As per the Latest SEBI Mandate, this isn't a Trading/Investment RECOMMENDATION nor for Educational Purposes; it is just for Informational purposes only. The chart data used is 3 Months old, as Showing Live Chart Data is not allowed according to the New SEBI Mandate.
Disclaimer: "I am not a SEBI REGISTERED RESEARCH ANALYST AND INVESTMENT ADVISER."
This analysis is intended solely for informational purposes and should not be interpreted as financial advice. It is advisable to consult a qualified financial advisor or conduct thorough research before making investment decisions.

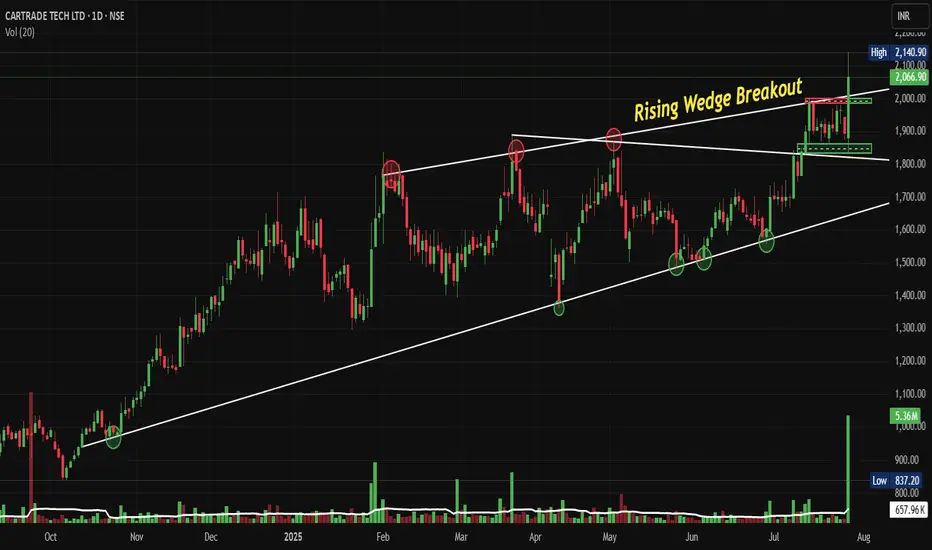
CARTRADE: Breaks Free with Rising Wedge Breakout Post Q1 FY 26NSE:CARTRADE Breaks Free: The Rising Wedge Breakout That's Driving This Auto-Tech Giant to New All-Time Heights with Strong Q1 FY 26
Price Action:
Price Movement and Trend Structure:
• Current Price: ₹2,066.90 (as of July 28, 2025)
• Daily Change: +₹172.20 (+9.09%) - Strong bullish momentum
• Price Range: High ₹2,140.90 | Low ₹2,100.90 | Volume 5.36M shares
• Price Trajectory: Consistent higher highs and higher lows pattern from October 2024
• Recent Action: Sharp acceleration in price movement post-July breakout
• Momentum Character: Strong bullish momentum with gap-up openings and sustained buying
Volume Spread Analysis:
Volume Characteristics:
• Breakout Volume: Exceptional volume spike during the breakout phase (5.36M shares)
• Volume Pattern: Generally increasing volume during upward moves, declining during consolidations
• Average Volume: Approximately 1-2M shares on regular trading days
• Volume Confirmation: The breakout is well-supported by above-average volume, validating the move
Volume Indicators:
• Volume Expansion: 3-4x normal volume during breakout sessions
• Distribution vs Accumulation: Clear accumulation pattern throughout the wedge formation
• Volume-Price Relationship: Positive correlation between volume and price advancement
Chart Patterns:
• Rising Wedge Breakout: The stock has successfully broken out of a long-term rising wedge pattern that was forming since October 2024
• Timeframe: Daily chart showing progression from October 2024 to July 2025
• Breakout Confirmation: Strong breakout above the upper trendline of the wedge with significant volume expansion
• Breakout Level: Approximately ₹1,850-1,900 range
• Pattern Completion: Clean breakout with follow-through buying confirming pattern validity
Key Price Levels:
• All-Time High: ₹2,140.90 (recent high)
• Previous Resistance Zones: ₹1,800, ₹1,900, ₹2,000
• Immediate Support: ₹1,850-1,900 (previous breakout zone)
• Major Support: ₹1,650-1,700 (middle of previous consolidation)
• Long-term Support: ₹1,400-1,450 (bottom of the rising wedge)
Trend Analysis:
• Primary Trend: Strong bullish momentum with consistent higher highs and higher lows
• Secondary Trend: Recently accelerated upward movement post-breakout
• Trend Strength: Multiple touchpoints on both trendlines confirm the validity of the wedge pattern validity
• Momentum: Increasing momentum as evidenced by the steepening price action
Key Support and Resistance Levels:
Key Resistance Levels:
• Immediate Resistance: ₹2,150-2,200 (psychological and technical resistance)
• Next Target: ₹2,300-2,350 (measured move from wedge breakout)
• Long-term Target: ₹2,500+ (extension based on wedge height projection)
Critical Support Levels:
• First Support: ₹1,950-2,000 (recent consolidation zone)
• Strong Support: ₹1,850-1,900 (breakout confirmation level)
• Major Support: ₹1,650-1,700 (50% retracement of recent move)
• Ultimate Support: ₹1,400-1,450 (wedge bottom - unlikely to be tested)
Base Formation:
• Base Pattern: Rising wedge base formed over 9 months (October 2024 to July 2025)
• Base Depth: Approximately ₹1,000 to ₹1,900 range
• Base Quality: High-quality base with multiple retests of support and resistance
• Breakout Strength: Clean breakout with gap-up opening confirming institutional interest
Technical Patterns and Indicators:
Chart Patterns:
• Completed Pattern: Rising Wedge Breakout (Bullish continuation pattern)
• Pattern Reliability: High - well-defined trendlines with multiple touchpoints
• Measured Move Target: ₹2,300-2,400 (based on wedge height projection)
• Time Frame: 9-month pattern completion
Technical Formations:
• Flag and Pennant Potential: Post-breakout consolidation may form continuation patterns
• Gap Analysis: Potential gap fills not immediately concerning given strong fundamentals
• Trend Channel: Stock is establishing a new, steeper upward channel post-breakout
Trade Setup and Strategy:
Entry Levels:
• Aggressive Entry: ₹2,050-2,070 (current market price on dips)
• Conservative Entry: ₹1,950-1,980 (on pullback to breakout zone)
• Momentum Entry: ₹2,100-2,120 (on continuation above resistance)
• Scale-in Strategy: 40% at ₹2,000, 35% at ₹1,950, 25% at ₹1,900
Exit Levels and Targets:
• Target 1: ₹2,200-2,250 (immediate resistance zone) - Book 30% profits
• Target 2: ₹2,350-2,400 (measured move target) - Book 40% profits
• Target 3: ₹2,500-2,600 (extension target) - Book remaining 30%
• Trail Strategy: Trail stop-loss 8-10% below recent swing lows after Target 1
Stop-Loss Strategy:
• Aggressive Stop: ₹1,900-1,920 (below recent support)
• Conservative Stop: ₹1,850-1,870 (below breakout zone)
• Disaster Stop: ₹1,750-1,780 (below major support)
• Risk-Reward Ratio: Minimum 1:2, targeting 1:3 for optimal entries
Position Sizing and Risk Management:
Position Sizing Guidelines:
• Conservative Allocation: 2-3% of portfolio (suitable for risk-averse investors)
• Moderate Allocation: 4-5% of portfolio (balanced approach)
• Aggressive Allocation: 6-8% of portfolio (for high-conviction trades)
• Maximum Position: Not exceeding 10% of the total portfolio, regardless of conviction
Risk Management Rules:
• Single Trade Risk: Maximum 1-2% of portfolio value per trade
• Stop-Loss Discipline: Strict adherence to predetermined stop-loss levels
• Profit Booking Strategy: Systematic profit booking at predetermined targets
• Position Monitoring: Daily review of technical levels and volume patterns
Risk Mitigation Techniques
• Diversification: Avoid overconcentration in a single stock or sector
• Hedging Options: Consider protective puts for large positions
• Correlation Analysis: Monitor correlation with broader auto and tech indices
• News Sensitivity: Be prepared for volatility around earnings and sector news
Sectoral and Fundamental Backdrop:
Industry Landscape:
• Auto Marketplace Growth: India's online auto marketplace is growing at a 27.5% CAGR (2025-2030)
• Digital Transformation: Increasing shift from offline to online vehicle transactions
• Market Leadership: CarTrade Tech is India's leading and only profitable auto marketplace
• Competitive Advantage: Multi-platform presence with CarWale, BikeWale, CarTrade, and OLX India
Business Model Strength:
• Asset-Light Model: Operates 114 auto malls, mostly leased, ensuring capital efficiency
• Revenue Diversification: Multiple revenue streams including listing fees, transaction commissions, and financial services
• Platform Integration: Comprehensive ecosystem covering new cars, used cars, commercial vehicles, and two-wheelers
• Strategic Acquisitions: OLX India acquisition for ₹535.54 crore, strengthening market position
Recent Fundamental Performance:
• Q1 FY26 Results: Revenue of ₹173 crore (22% YoY growth)
• Profit Growth: Net profit doubled year-on-year in Q1 FY26
• Market Capitalization: ₹9,801 crore (up 139% in past year)
• Valuation Metrics: Trading at 4.42 times book value
• EBITDA Performance: EBITDA almost doubled in Q1 FY26
Growth Catalysts:
• Market Expansion: Penetration into tier-2 and tier-3 cities
• Technology Enhancement: AI and ML integration for better user experience
• Financial Services: Growing fintech vertical with loan facilitation
• Electric Vehicle Segment: Positioning for EV marketplace opportunities
• B2B Growth: Expanding dealer and OEM partnerships
Sector Tailwinds:
• Digital Adoption: Accelerated post-pandemic shift to online platforms
• Used Car Market: Growing preference for certified pre-owned vehicles
• Credit Penetration: Increasing vehicle financing accessibility
• Regulatory Support: Government push for digitization and transparency
• Consumer Behaviour: Millennial and Gen-Z preference for online research and transactions
Risk Factors and Considerations:
Technical Risks:
• Overbought Conditions: Stock may be due for consolidation after a sharp run-up
• Gap Risk: Potential for gap-down on negative news or market corrections
• Volume Sustainability: Need for continued high volume to sustain momentum
• Market Correlation: High beta stock susceptible to broader market volatility
Fundamental Risks:
• Economic Slowdown: Auto sales sensitivity to economic cycles
• Competition Intensification: New entrants and existing players' aggressive strategies
• Regulatory Changes: Potential policy changes affecting online marketplaces
• Technology Disruption: Emergence of new technologies or business models
Market Risks:
• Sector Rotation: Shift in investor preference away from auto-tech stocks
• Liquidity Concerns: Mid-cap stock with potential liquidity constraints during market stress
• Earnings Expectations: High growth expectations leading to volatility on any disappointment
• Valuation Concerns: Premium valuations make stock sensitive to market sentiment changes
My Take and Investment Thesis:
NSE:CARTRADE presents a compelling technical setup with a successful rising wedge breakout supported by strong volume and robust fundamental performance. The stock has established itself as a leader in India's growing auto marketplace sector with a diversified business model and strong growth trajectory.
The technical breakout, combined with excellent Q1 FY26 results showing doubled profits and 22% revenue growth, creates a favourable risk-reward scenario for investors. However, given the stock's significant run-up (146% in 11 months), careful position sizing and strict risk management are essential.
The investment thesis is supported by both technical momentum and fundamental strength, making it suitable for investors seeking exposure to India's digital transformation in the automotive sector. The key to success will be disciplined execution of the outlined entry, exit, and risk management strategies while monitoring both technical levels and fundamental developments closely.
Keep in the Watchlist and DOYR.
NO RECO. For Buy/Sell.
📌Thank you for exploring my idea! I hope you found it valuable.
🙏FOLLOW for more
👍BOOST if you found it useful.
✍️COMMENT below with your views.
Meanwhile, check out my other stock ideas on the right side until this trade is activated. I would love your feedback.
Disclaimer: "I am not a SEBI REGISTERED RESEARCH ANALYST AND INVESTMENT ADVISER."
This analysis is intended solely for informational and educational purposes and should not be interpreted as financial advice. It is advisable to consult a qualified financial advisor or conduct thorough research before making investment decisions.
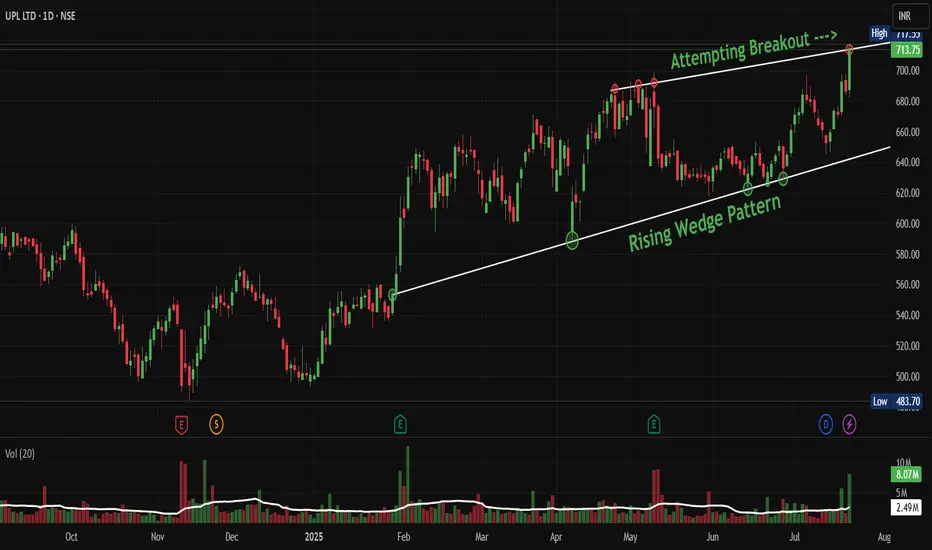
UPL: Rising Wedge Breakout Could Signal Fresh HighsNSE:UPL : Rising Wedge Breakout Could Signal Fresh Highs, But Manage Risk Carefully
Price Action Analysis:
- Current Price: ₹713.75 (+3.92%)
- 52-Week High: ₹717.55
- 52-Week Low: ₹483.70
- The stock is trading near all-time highs with strong momentum
Volume Spread Analysis
- Volume spikes are visible during key breakout points
- Recent volume of 8.07M is above average, confirming breakout attempt
- Volume pattern shows selling pressure during declines and buying interest on rallies
- The volume surge in July suggests institutional participation
Chart Pattern:
Rising Wedge Pattern:
- A classic rising wedge pattern has formed from February 2025 to July 2025
- The pattern shows converging trendlines with higher highs and higher lows
- Volume has been decreasing during the formation, which is typical for rising wedges
- The stock is attempting a breakout from the upper trendline resistance
Key Technical Levels:
Support Levels:
- Immediate Support: ₹680 (recent consolidation zone)
- Strong Support: ₹640 (rising trendline support)
- Major Support: ₹580 (previous resistance turned support)
Resistance Levels:
- Immediate Resistance: ₹720 (psychological level)
- Next Resistance: ₹750 (projected target based on wedge height)
- Extended Target: ₹800 (measured move from base)
Base Formation Analysis:
- The stock formed a solid base between ₹480-₹550 from October 2024 to January 2025
- This accumulation phase lasted approximately 4 months
- Strong buying emerged from the ₹500 level multiple times
- The breakout from this base began in February 2025
Trade Setup:
Entry Strategy:
- Aggressive Entry: ₹714-₹716 (current levels on confirmed breakout)
- Conservative Entry: ₹695-₹700 (on any pullback to support)
- Accumulation Entry: ₹680-₹685 (if stock retraces to wedge support)
Target Levels:
- Target 1: ₹750 (immediate target - 5% upside)
- Target 2: ₹780 (medium-term target - 9% upside)
- Target 3: ₹820 (extended target - 15% upside)
Stop Loss Levels:
- For Aggressive Entry: ₹675 (5.5% risk)
- For Conservative Entry: ₹665 (5% risk)
- For Accumulation Entry: ₹655 (4% risk)
Position Sizing Guidelines:
- Risk per trade: 2% of portfolio maximum
- For ₹100,000 portfolio with ₹714 entry and ₹675 stop: 51 shares maximum
- Adjust position size based on individual risk tolerance
Risk Management Framework:
Trade Management Rules:
- Book 30% profits at Target 1
- Trail stop loss to breakeven after Target 1 is hit
- Book another 40% profits at Target 2
- Let the remaining 30% run with a trailing stop
Risk Factors to Monitor:
- Rising wedge patterns have a 60% failure rate historically
- Global agrochemical sector volatility
- Monsoon dependency for Indian agriculture
- Currency fluctuation impact on exports
Sectoral and Fundamental Backdrop:
Company Overview:
- NSE:UPL provides crop protection solutions, manufacturing and marketing agrochemicals, industrial chemicals, and speciality chemicals
- Global provider with annual revenue exceeding $5 billion, ranking among the top 5 agriculture solutions companies worldwide
Financial Performance:
- Market Cap: ₹58,088 Crore (up 37.1% in 1 year), Revenue: ₹46,637 Cr, Profit: ₹820 Cr
- Revenues grew 8.21% last year.
- The company has delivered a poor sales growth of 5.46% over the past five years
Recent Performance Metrics:
- Year-to-date increase of 29.48%, significantly outperforming the Sensex's 4.44% gain
- Delivered a robust return of 37.1% over the past year, compared to the Sensex's 12.13%
Credit Rating and Outlook:
- Fitch has revised its Long-Term Issuer Default Rating outlook on UPL Corp from 'Negative' to 'Stable', affirming the IDR at 'BB'
Sectoral Outlook:
- The company focuses on reducing environmental impact while enhancing soil health and water conservation through sustainable agriculture
- UPL ranked No. 1 globally in the agrochemical sector by Sustainalytics
- Growing focus on biological solutions and sustainable farming practices
Recent Corporate Actions:
- UPL's subsidiary to acquire 100% of Wuhan Advanta Seeds for USD 4,200 by Sept 2025
- Strategic partnership with Indian Potash Limited to revolutionise sugarcane farming in India
Investment/Trading Thesis:
Positive Factors:
- Strong technical breakout from the rising wedge pattern on cards
- Outperforming the broader market significantly
- Leading position in the global agrochemical sector
- Strategic acquisitions and partnerships
- Improved credit rating outlook
Risk Considerations:
- The company has a low interest coverage ratio
- Historical slow sales growth over 5 years
- Monsoon and weather dependency
- Rising wedge patterns can be bearish reversal signals
- Global commodity price volatility
My Take:
NSE:UPL presents a compelling technical setup with fundamental tailwinds from the agricultural sector. The rising wedge breakout, if sustained, could lead to significant upside. However, traders should maintain strict risk management given the pattern's inherent risks and the company's mixed fundamental metrics.
Keep in the Watchlist and DOYR.
NO RECO. For Buy/Sell.
📌Thank you for exploring my idea! I hope you found it valuable.
🙏FOLLOW for more
👍BOOST if you found it useful.
✍️COMMENT below with your views.
Meanwhile, check out my other stock ideas on the right side until this trade is activated. I would love your feedback.
Disclaimer: "I am not a SEBI REGISTERED RESEARCH ANALYST AND INVESTMENT ADVISER."
This analysis is intended solely for informational and educational purposes and should not be interpreted as financial advice. It is advisable to consult a qualified financial advisor or conduct thorough research before making investment decisions.
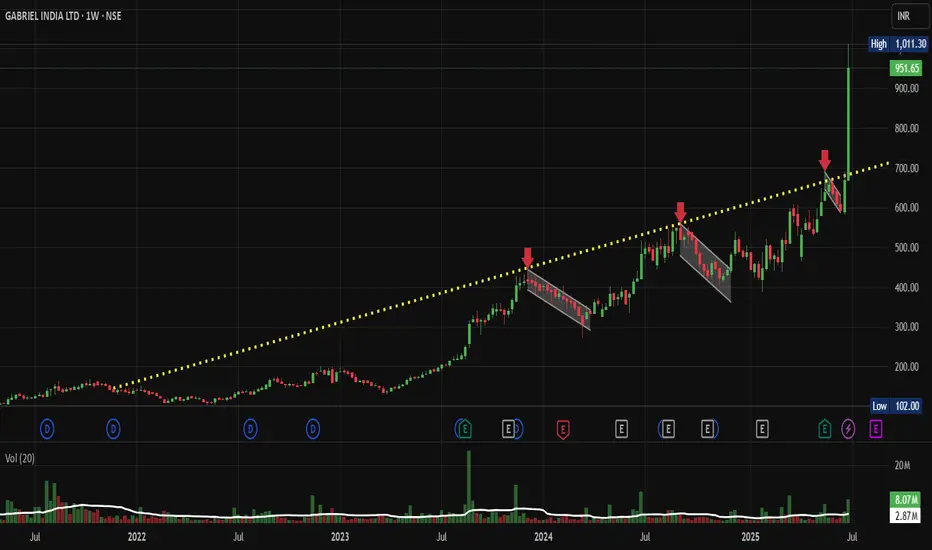
Gabriel India: Ascending Trendline Breakout, Chart of the WeekNSE:GABRIEL : A Technical Breakout Story That Could Double Your Investment? Let's Analyze it in my "Chart of the Week" Idea.
Price Action Analysis:
• The stock has shown a remarkable multi-year uptrend from around ₹100 levels in 2022 to current levels above ₹950
• A clear ascending channel pattern is visible with the yellow dotted trendline acting as dynamic support
• Recent price action shows a powerful breakout from a consolidation phase around ₹600-700 levels
• The stock is currently trading near all-time highs with strong momentum
• Volume expansion during the recent breakout confirms genuine buying interest
Volume Spread Analysis:
• Volume patterns show significant spikes during major price advances
• The recent breakout phase is accompanied by above-average volume, indicating institutional participation
• Volume tends to contract during consolidation phases, which is a healthy price action
• The volume profile suggests strong accumulation during the base-building phases
Key Technical Levels:
Base Formation:
• Primary base formed between ₹100-200 levels during 2022-early 2023
• Secondary base established around ₹400-500 levels in late 2023
• Most recent consolidation base around ₹600-700 levels before the current breakout
Support Levels:
• Immediate support: ₹850-900 (recent breakout zone)
• Strong support: ₹700-750 (previous resistance turned support)
• Major support: ₹600 (base of recent consolidation)
• Critical support: ₹500 (psychological level and previous consolidation zone)
Resistance Levels:
• Immediate resistance: ₹1000-1050 (psychological barrier)
• Next resistance: ₹1200 (measured move target)
• Extended target: ₹1400-1500 (based on channel projection)
Technical Pattern Recognition:
Primary Patterns:
• Long-term ascending channel with consistent higher highs and higher lows
• Multiple cups and handle formations during the uptrend
• Recent flag/pennant consolidation followed by breakout
• Classical stage 2 uptrend characteristics with expanding volume
Technical Indicators:
• Price trading above all major moving averages
• Strong momentum as evidenced by the steep price advance
• Healthy pullbacks followed by resumption of uptrend
• Volume-price confirmation during breakouts
Trade Setup:
Entry Levels:
• Aggressive entry: Current market price (₹950-970)
• Conservative entry: On pullback to ₹850-880 levels
• Breakout entry: Above ₹1000 with volume confirmation
• Accumulation entry: Any dip towards ₹800-820 levels
Exit Levels:
• First target: ₹1200 (26% upside from current levels)
• Second target: ₹1400 (47% upside)
• Extended target: ₹1600 (68% upside)
• Trailing stop strategy recommended for long-term positions
Stop-Loss Placement:
• For aggressive entries: ₹800 (16% risk)
• For conservative entries: ₹750 (12% risk from ₹850 entry)
• For breakout entries: ₹900 (10% risk from ₹1000 entry)
• Weekly closing basis stop-loss recommended
Risk Management Framework:
Position Sizing:
• Risk per trade: Maximum 2-3% of portfolio
• For ₹800 stop-loss from current price: Position size = (Portfolio × 2%) ÷ ₹150
• Recommended allocation: 5-8% of equity portfolio given the risk-reward profile
• Consider scaling into position over 2-3 tranches
Risk Parameters:
• Maximum drawdown tolerance: 20% from peak
• Time-based stop: Exit if consolidation exceeds 6 months
• Sector rotation risk: Monitor auto sector performance
• Market correlation: High beta stock, reduce position size in volatile markets
Sectoral Backdrop:
Auto Ancillary Sector Dynamics:
• Indian automotive sector showing strong recovery post-COVID
• Shift towards electric vehicles creating new opportunities for component manufacturers
• Export potential increasing with global supply chain diversification
• Government's PLI scheme supporting auto component manufacturing
Industry Trends:
• Increasing focus on high-quality, precision components
• Growing aftermarket business providing stable revenue streams
• Consolidation in the sector is favouring established players
• Technology upgrades driving margin expansion
Fundamental Backdrop:
Company Overview:
• NSE:GABRIEL is a leading manufacturer of automotive shock absorbers and suspension systems
• Strong presence in both OEM and aftermarket segments
• Diversified customer base across passenger vehicles, commercial vehicles, and two-wheelers
• Established relationships with major automotive manufacturers
Financial Highlights:
• Consistent revenue growth is driven by industry expansion
• Improving margins through operational efficiency and product mix optimization
• Strong balance sheet with manageable debt levels
• Increasing return on equity and return on capital employed
Growth Drivers:
• Expanding automotive production in India
• Growing replacement market for suspension components
• Export opportunities in emerging markets
• New product development and technology partnerships
Investment Thesis:
• Well-positioned to benefit from India's automotive growth story
• Strong competitive moat through technical expertise and customer relationships
• Potential for multiple expansions as the company scales operations
• Dividend yield providing downside protection for long-term investors
My Take:
The technical setup for NSE:GABRIEL presents a compelling risk-reward opportunity with the stock breaking out from a multi-month consolidation phase. The combination of strong sectoral tailwinds, robust fundamental backdrop, and bullish technical patterns creates a favourable investment environment. However, investors should maintain proper risk management given the stock's high beta nature and current extended valuation levels.
Keep in the Watchlist.
NO RECO. For Buy/Sell.
📌Thank you for exploring my idea! I hope you found it valuable.
🙏FOLLOW for more
👍BOOST if you found it useful.
✍️COMMENT below with your views.
Meanwhile, check out my other stock ideas on the right side until this trade is activated. I would love your feedback.
Disclaimer: "I am not a SEBI REGISTERED RESEARCH ANALYST AND INVESTMENT ADVISER."
This analysis is intended solely for informational and educational purposes and should not be interpreted as financial advice. It is advisable to consult a qualified financial advisor or conduct thorough research before making investment decisions.
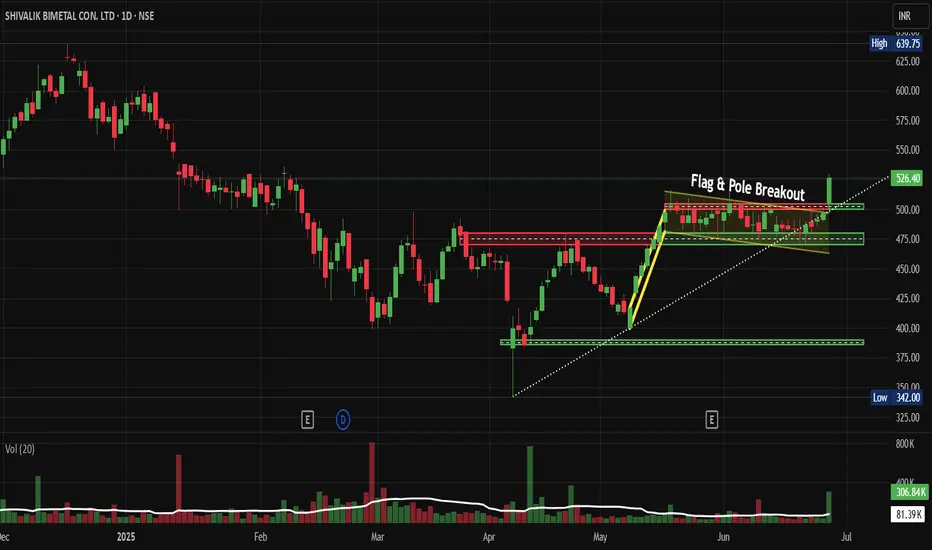
Shivalik Bimetal Controls Breaks Out Flag & Pole Pattern NSE:SBCL Breaks Out: Flag Pattern Signals Bullish Momentum in Speciality Metals Space
Price Action Analysis:
- Current Price: ₹526.40 (as of June 26, 2025)
- Daily Gain: +29.05 (+5.84%)
- 52-Week High: ₹639.75
- 52-Week Low: ₹342.00
- Trading Volume: 306.84K (compared to 20-day average of 81.39K)
Volume Spread Analysis:
- Breakout Volume: 306.84K (nearly 4x the 20-day average)
- Volume Confirmation: Strong volume surge supports genuine breakout
- Volume Pattern: Declining volume during flag formation, followed by expansion on breakout
Base Formation:
- Consolidation Base: Formed between April-May 2025 around ₹400-450 levels
- Duration: Approximately 6-8 weeks of sideways movement
- Characteristics: Healthy consolidation after initial rally from ₹375 lows
Chart Pattern Analysis:
- Primary Pattern: Bull Flag & Pole Breakout
- Flag Formation: Formed between May and June 2025 in the ₹475-500 range
- Pole Height: Approximately ₹125 (from ₹375 to ₹500)
- Breakout Confirmation: Stock broke above ₹500 resistance with strong volume
- Target Projection: ₹625-650 based on flag pole measurement
Key Technical Levels:
Support Levels:
- Immediate Support: ₹500 (previous resistance turned support)
- Secondary Support: ₹475 (flag pattern lower boundary)
- Major Support: ₹400 (psychological level and previous consolidation zone)
Resistance Levels:
- Immediate Resistance: ₹550-560 (short-term target)
- Major Resistance: ₹625-650 (flag pattern target)
- All-Time High: ₹639.75 (to be watched closely)
Trade Setup Analysis:
Long Position Setup:
- Entry Strategy: Breakout above ₹500 with volume confirmation
- Risk-Reward Ratio: 1:3 (favourable setup)
- Time Horizon: 3-6 months for target achievement
- Pattern Reliability: High (bull flag patterns have 70%+ success rate)
Entry Levels:
- Aggressive Entry: ₹526-530 (current market price)
- Conservative Entry: ₹510-515 (on pullback to breakout level)
- Accumulation Zone: ₹500-520 (for larger positions)
Exit Levels:
- Target 1: ₹580-590 (intermediate target - 15% upside)
- Target 2: ₹625-640 (pattern target - 22-25% upside)
- Final Target: ₹650-670 (extended target based on momentum)
Stop-Loss Strategy:
- Initial Stop-Loss: ₹475 (below flag pattern support)
- Trailing Stop: Implement an 8-10% trailing stop after 15% gains
- Conservative Stop: ₹490 (closer stop for risk-averse traders)
Position Sizing Recommendations:
- Conservative Allocation: 2-3% of portfolio
- Moderate Allocation: 4-5% of portfolio
- Aggressive Allocation: 6-8% of portfolio (for high-risk tolerance)
Risk Management Framework:
Risk Assessment:
- Pattern Risk: 25-30% (typical bull flag failure rate)
- Market Risk: Consider broader market conditions
- Sector Risk: Speciality metals and electronics component sector exposure
- Liquidity Risk: Moderate (average daily volume of 81.39K)
Risk Mitigation Strategies:
- Diversification across multiple positions
- Gradual position building rather than lump sum entry
- Regular monitoring of volume and price action
- Adherence to predetermined stop-loss levels
- Profit booking at intermediate targets
Money Management Rules:
- Maximum loss per trade: 2-3% of portfolio
- Position sizing based on stop-loss distance
- Avoid averaging down on losing positions
- Scale out profits at predetermined levels
Fundamental Backdrop:
Company Overview:
- Business Focus: Manufacturing and sales of Thermostatic Bimetal/Trimetal strips, Current Sense Metal Strip Shunts/Resistors, and electron beam welded products
- Operating Since: Commercial production since October 1986
- Headquarters: New Delhi, India
Financial Performance:
- Market Capitalization: ₹3,027 crores
- Annual Revenue: ₹508.35 crores (TTM)
- Pre-tax Margin: 20% (considered great)
- Return on Equity: 20.6% (exceptional performance)
- Debt-to-Equity: 0.08 (healthy balance sheet)
Recent Quarterly Results:
- Q4 FY2025 Revenue: ₹132 crores
- Q4 FY2025 Net Profit: ₹21 crores
- Q3 FY2025 Net Profit Growth: 7.55% YoY to ₹18 crores
Promoter Holding Concerns:
- Current Promoter Holding: 33.18% (considered low)
- 3-Year Trend: Decreased by 27.4% over the last 3 years
Sectoral Analysis:
Industry Positioning:
- Sector: Speciality Metals and Electronic Components
- Niche Market: Thermostatic bimetal strips for temperature control applications
- End Markets: Electronics, automotive, appliances, and industrial equipment
- Market Position: Established player with specialized manufacturing capabilities
Sector Outlook:
- Growing demand for temperature control solutions in electronics
- Increasing automation in the automotive and industrial sectors
- Focus on energy efficiency, driving demand for precision components
- Import substitution opportunities in specialised metal products
Competitive Advantages:
- Financial Stability: Appears financially stable compared to competitors
- Specialized manufacturing expertise in electron beam welding
- Established customer relationships since 1986
- Low debt levels provide financial flexibility
Technical Indicators Summary:
Momentum Indicators:
- RSI: In overbought territory post-breakout (monitor for divergence)
- MACD: Bullish crossover expected on breakout
- Volume: Strong confirmation of breakout validity
Trend Indicators:
- Moving Averages: Stock trading above key moving averages
- Trend Direction: Bullish short to medium term
- Support Levels: Well-defined support structure
Risk Indicators:
- Volatility: Moderate to high given recent breakout
- Liquidity: Adequate for position sizes recommended
- Market Correlation: Monitor broader market trends
My Take:
The technical setup for NSE:SBCL presents a compelling bull flag breakout opportunity with strong volume confirmation. The pattern projects targets of ₹625-650, representing potential upside of 22-25% from current levels. However, the declining promoter holding and moderate liquidity require careful position sizing and risk management.
Recommended approach is to enter on any pullback to ₹510-515 levels with a stop-loss at ₹475, targeting ₹580-590 for the first leg of the move. The company's strong financial metrics and niche market positioning support the technical breakout, making this an attractive medium-term opportunity for technically oriented investors.
Keep in the Watchlist.
NO RECO. For Buy/Sell.
📌Thank you for exploring my idea! I hope you found it valuable.
🙏FOLLOW for more
👍BOOST if you found it useful.
✍️COMMENT below with your views.
Meanwhile, check out my other stock ideas on the right side until this trade is activated. I would love your feedback.
Disclaimer: "I am not a SEBI REGISTERED RESEARCH ANALYST AND INVESTMENT ADVISER."
This analysis is intended solely for informational and educational purposes and should not be interpreted as financial advice. It is advisable to consult a qualified financial advisor or conduct thorough research before making investment decisions.
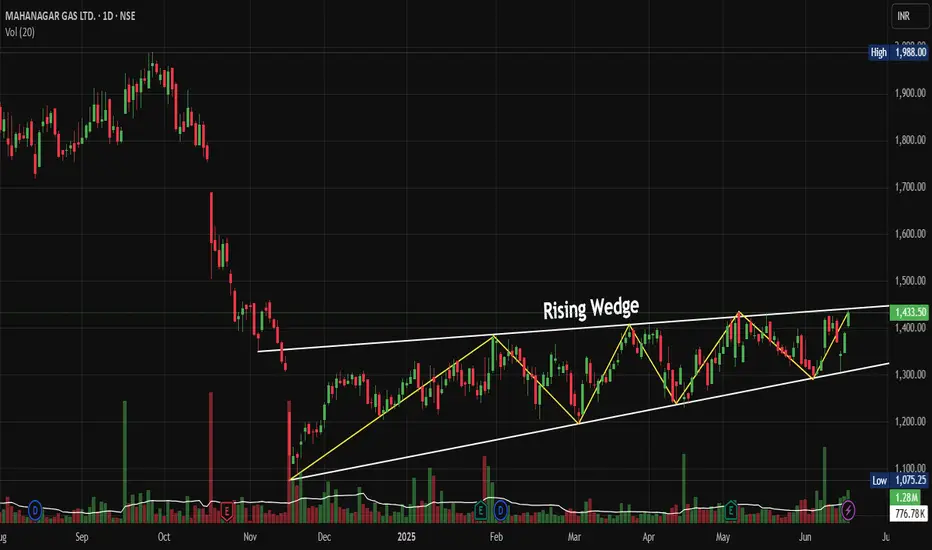
MGL: Rising Wedge Breakout Sets Stage for Explosive RallyNSE:MGL : Rising Wedge Breakout Sets Stage for Explosive Rally after management guidance of double-digit volume growth for the next three to four years.
Price Action Analysis:
• Stock has formed a classic Rising Wedge pattern from November 2024 lows around 1,075 to current levels near 1,433
• The wedge shows converging trendlines with higher highs and higher lows, typical of consolidation before a breakout
• Recent breakout above the upper trendline around 1,400 levels confirms bullish momentum
• Price has rallied 33% from the wedge base, indicating strong underlying demand
Volume Spread Analysis:
• Volume spikes are visible during key breakout moments, particularly in recent sessions
• Higher volume on up days compared to down days suggests institutional accumulation
• Volume expansion during the wedge breakout confirms genuine buying interest
• Recent green volume bars indicate sustained buying pressure supporting the uptrend
Key Technical Levels:
Support Levels:
• Immediate support at 1,380-1,400 (previous resistance turned support)
• Secondary support at 1,300 (middle of the rising wedge)
• Major support at 1,200-1,250 (lower trendline of the wedge)
• Critical support at 1,075 (November 2024 lows)
Resistance Levels:
• Immediate resistance at 1,450-1,470 (psychological levels)
• Next resistance at 1,500 (round number resistance)
• Extended target at 1,600-1,650 based on wedge height projection
• 52-Week high resistance around 1,988 (historical peak)
Technical Patterns:
• Rising Wedge pattern near to completion with successful breakout
• Multiple higher highs and higher lows confirming uptrend structure
• Potential cup and handle formation on longer timeframes
• Bullish flag consolidation patterns within the broader uptrend
Trade Setup:
Entry Strategy:
• Primary entry on pullback to 1,400-1,420 levels (retest of breakout zone)
• Aggressive entry at the current market price of around 1,433 for momentum players
• Scale-in approach: 50% at 1,420, 25% at 1,380, 25% at 1,350
Exit Levels:
• First target: 1,500 (16% upside from current levels)
• Second target: 1,600 (22% upside potential)
• Extended target: 1,700-1,750 for long-term holders
• Trailing stop-loss strategy recommended above 1,500 levels
Stop-Loss Placement:
• Conservative stop-loss: 1,320 (below wedge support)
• Aggressive stop-loss: 1,380 (below immediate support)
• Risk-reward ratio of 1:2 to 1:3 depending on entry and exit points
Position Sizing and Risk Management:
• Allocate a maximum of 2-3% of the portfolio to a single position
• Use a 1% risk per trade rule based on stop-loss distance
• Consider partial profit booking at 1,500 levels
• Maintain position size discipline to avoid overexposure
Sectoral and Fundamental Backdrop:
Sector Analysis:
• City Gas Distribution (CGD) sector showing resilience amid energy transition
• The government push for clean fuel adoption, supporting the natural gas demand
• Infrastructure expansion in tier-2 and tier-3 cities benefiting CGD companies
• Regulatory environment remains supportive with steady tariff mechanisms
Fundamental Strengths:
• NSE:MGL operates in prime Mumbai and adjoining areas with stable demand
• Strong cash flows from residential and industrial customer base
• Consistent dividend-paying track record with healthy payout ratios
• Robust balance sheet with minimal debt and strong return on equity
• Expanding PNG and CNG network, providing growth visibility
Key Catalysts:
• Increasing vehicle conversion to CNG, supporting volume growth
• Industrial demand recovery post-pandemic is driving commercial sales
• Government policies favouring cleaner fuel alternatives
• Potential for geographical expansion into new license areas
Risk Factors:
• Crude oil price volatility is affecting input costs
• Competition from electric vehicles in the transportation segment
• Regulatory changes in gas pricing mechanisms
• Economic slowdown impacting industrial demand
My Take:
The technical setup suggests NSE:MGL is well-positioned for continued upward momentum following the rising wedge breakout. The combination of strong fundamentals, supportive sector dynamics, and bullish technical patterns creates an attractive risk-reward proposition for both swing and positional traders. However, traders should remain disciplined with position sizing and risk management given the stock's premium valuation at current levels.
Keep in the Watchlist.
NO RECO. For Buy/Sell.
📌Thank you for exploring my idea! I hope you found it valuable.
🙏FOLLOW for more
👍BOOST if you found it useful.
✍️COMMENT below with your views.
Meanwhile, check out my other stock ideas on the right side until this trade is activated. I would love your feedback.
Disclaimer: "I am not a SEBI REGISTERED RESEARCH ANALYST AND INVESTMENT ADVISER."
This analysis is intended solely for informational and educational purposes and should not be interpreted as financial advice. It is advisable to consult a qualified financial advisor or conduct thorough research before making investment decisions.
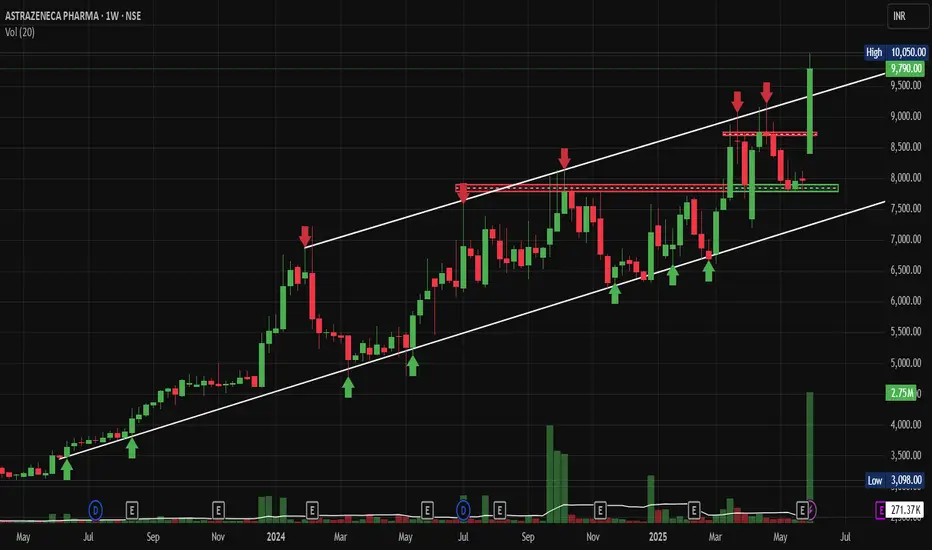
AstraZeneca Breakout Above 10000 Could Signal Next Leg, Post Q4NSE:ASTRAZEN Breakout Above 10000 Could Signal Next Leg, Post Spectacular Q4 and FY25 Numbers. Breaking out of Rising Channel, hence selected for this Week's "Chart of the WEEK"
Price Action Analysis:
• Stock has been in a strong uptrend since May 2024, rising from around 3000 levels to current levels near 9800
• Recent price action shows consolidation between the 7500-8500 levels with multiple tests of resistance
• Current price at 9409 represents a +22.80% gain, showing strong momentum
• Volume spike visible in recent sessions at 2.75M shares vs average, indicating institutional interest
• Price structure shows a higher highs and higher lows pattern intact.
Key Support and Resistance Levels:
• Primary Support: 8000-8200 zone (previous resistance turned support)
• Secondary Support: 7500-7600 (multiple bounce zone)
• Key Resistance: 8500-8600 (red horizontal line showing multiple rejections)
• Breakout Resistance: 9000 psychological level
• Current High: 10,950 acting as immediate resistance
Base Formation and Patterns:
• Rectangle consolidation pattern formed between 7500-8500 from September 2024 to March 2025
• Bullish flag pattern visible after the breakout above 8500
• Ascending triangle formation with higher lows and flat resistance around 8500
• Volume expansion during breakout confirms pattern validity
Technical Indicators:
• Strong upward-trending channel maintained since mid-2024
• Price trading above all major moving averages
• Momentum appears to be building after the recent consolidation phase
• Volume profile shows accumulation during base formation
Trade Setup:
Entry Strategy:
• Primary Entry: On pullback to 8800-9000 support zone
• Aggressive Entry: Current market price around 9400 for momentum play
• Conservative Entry: Wait for retest of 8500 breakout level
Exit Levels:
• Target 1: 10,500 (psychological resistance)
• Target 2: 11,200 (measured move from rectangle pattern)
• Target 3: 12,000 (extension target based on trend channel)
Risk Management:
• Stop Loss: 8200 for entries around 9000 (tight stop)
• Stop Loss: 7800 for swing positions (wider stop)
• Position Size: Risk 1-2% of portfolio per trade
• Risk-Reward Ratio: Minimum 1:2 for all entries
Position Sizing Guidelines:
• For 1% risk: Calculate position size based on distance to stop loss
• Maximum exposure: 3-5% of portfolio in a single stock
• Scale in approach: 50% on initial entry, 30% on pullback, 20% on confirmation
Sectoral and Fundamental Backdrop:
Pharmaceutical Sector Overview:
• Indian pharma sector benefiting from global generic drug demand
• Regulatory approvals and US FDA compliance driving growth
• Export-oriented companies are seeing currency tailwinds
• Increased healthcare spending post-pandemic, supporting sector growth
AstraZeneca Pharma Fundamentals:
• Strong presence in oncology and respiratory segments
• Robust pipeline of innovative drugs and biosimilars
• Strategic partnerships with global pharmaceutical companies
• Consistent revenue growth and expanding market share in India
• Strong balance sheet with healthy cash flows
Market Dynamics:
• Institutional buying is visible through increased volumes
• FII interest in pharmaceutical stocks remains positive
• Sector rotation favouring defensive healthcare plays
• Government initiatives supporting pharmaceutical manufacturing
Risk Factors:
Technical Risks:
• High volatility near resistance levels
• Potential for false breakouts given extended rally
• Volume confirmation required for sustained moves
• Overbought conditions in the short term
Fundamental Risks:
• Regulatory changes in pharmaceutical pricing
• Currency fluctuation impact on export revenues
• Competition from generic drug manufacturers
• Global economic slowdown affecting healthcare spending
Market Risks:
• Overall market correction could impact individual stocks
• Sector rotation away from pharmaceuticals
• Profit booking by institutional investors
• Global pharmaceutical industry headwinds
My Take:
NSE:ASTRAZEN presents a compelling technical setup with a clear breakout above long-term resistance. The stock's strong fundamentals post Q4 and FY25, combined with favourable sector dynamics, make it an attractive investment opportunity. However, risk management remains crucial given the extended nature of the current rally. Traders should consider scaling into positions on pullbacks while maintaining strict stop-loss discipline.
Keep in the Watchlist.
NO RECO. For Buy/Sell.
📌Thank you for exploring my idea! I hope you found it valuable.
🙏FOLLOW for more
👍BOOST if you found it useful.
✍️COMMENT below with your views.
Meanwhile, check out my other stock ideas on the right side until this trade is activated. I would love your feedback.
Disclaimer: "I am not a SEBI REGISTERED RESEARCH ANALYST AND INVESTMENT ADVISER."
This analysis is intended solely for informational and educational purposes and should not be interpreted as financial advice. It is advisable to consult a qualified financial advisor or conduct thorough research before making investment decisions.
EIH Assoc Hotels Bullish biasOverall Structure Looks Bullish
SL 320
Target 510-520s Zone
POC Zone 365s
Price is moving in HH & HL Pattern on WeeklyTF
The price is just above the 200day Moving Avg for the stock with divergence
Stock is trading near the POC line
Expecting a potential upside on the stock
Lets deep dive into Daily analysis
On Daily time frame Chart we are able to understand that price was moving in downtrend
It gave a break out from the range and now trending up with Volume Spurt
And looks like Inverted Head & Shoulders Pattern formation
Potential Target based on Daily TF looks like 480s zone i.e. 23% upside with SL of 380
The Target is also reaching at Daily POC hence once that is achieved one needs to look forward to the price reaction on those levels for Weekly Trade

EURUSD on Strong Support EURUSD on Strong Support waiting for 4hr close above the previous close to go Long.
Note: Trading is Subjective to market risk. So, Trade Safe with risk management.

Maharashtra Scooter Bullish Bias Target 4800The stock on higher TF is
making a good structure
Bullish Bias
Bullish Divergence
Stop loss of 3600s
Target of 4700/800s Zone

Higher High Higher Low Formation. Strong CandleStock was in correction mode. But in lower timeframe, the stock has formed HH HL structure and given a good close. Can be a good entry trigger

SELF EXPLANATORY SERIES : QUICK ANALYSIS ON APAR INDUSTRY LTDIn this self explanatory series I will be posting charts with pure technical analysis only without full length explanations , Traders can ask their doubts in comments section, Happy trading.
Disclaimer : This idea was to just give you an insight about my own view and personal observations. Please do your own research or consult an investment advisor before doing any investment or trading.

FULL LENTH EXPLANATORY ANALYSIS ON JINDAL STEEL AND POWER.Few pointers from my analysis on JINDAL STEEL AND POWER.
1. The stock has been in a significant uptrend , making higher high and higher low formation.
2. The stock has consolidated for good amount of time in the big continuation flag pattern.
3. The stock has been respecting all major Fibonacci retracement levels and has in-fact retraced upto fibo .618 level , which is golden ratio, considered a very healthy retracement on an uptrend.
4.The stock has recently broke out of the flag pattern with decent volumes, can expect a good momentum going forward on shorter-term
5. On RSI as well the breakout and retest has happened.
Entry : can be taken near by 410-415.
Timeframe used : Daily.
Targets:
T1 : 440 (FIBO .236 LEVEL)
T2 : 500 LEVELS (ATH ZONE)
T3 : 540 (PATTERN HIGHT TARGET)
Stop-Loss : 373
Conclusion : overall the setup is Bullish and high-probability for performing going forward.
Disclaimer : This idea was to just give you an insight about my own view and personal observations. Please do your own research or consult an investment advisor before doing any investment or trading.

Route Mobile - Low Risk SetupThe stock was in uptrend since its IPO. Recently after some strong candles the stock was moving sideways. Today the stock has come out of that sideways movement and formed HH HL structure. Can be a low risk entry here.

BANK NIFTY ANALYSIS FOR 04-06-2021Do not Trade in between 35653 - 35070 .
As you all can see , Bank Nifty is respecting the Red Tredline marked on chart and had been making Higher - Highs & Higher Lows CContinuosly .
So , there is enough room after 35653 . If BN Sustains above that levels we could see a Trending Market with Big Targets
We'll only find buying oppotunities today .
Take Entries when Market sustains above / below our levels
Avoid entries , if there is a Huge Gap Up / Gap Down
Take Entries as per Price Action
** Only for Educational Purposes
( As you all can see our daily Analysis , Bank Nifty is respecting all our analysis with treadlines and Support & Resistance Lines )
PLEASE DO LIKE , COMMENT OUR POSTS .

Buy L&T @ 1448, T - 1525, 1565 SL- 1410Buy L&T @ 1448, T - 1525, 1565 SL- 1410
Breakout from HH-HL pattern.


Torrent PowerBeautiful structure
Higher lows possible
its a clear buy on dips
SL 295 levels
Targets ATH
Buy price only if it retraces to 370/350 levels

TITANThe stock is trading in higher high and higher low formation.
Immediate support lies around 1220.
I expect some sort of consolidation and correction in the current zone i.e. 1220 to 1300.
It can be accumulated in dips till 1220 for higher target.
CMP: 1286
Target: 1335, 1380, 1500
SL: 1190-1200 on daily closing basis.

SIEMENSIt continues to follow the Higher High Higher Low path since March lows. Keeping the same in mind it could rally till 1325 as long as its above 1260
