(HFT):Speed, Strategy, and Its Impact on Modern Financial MarketHigh-Frequency Trading (HFT) is one of the most influential and controversial developments in modern financial markets. It refers to a form of algorithmic trading that uses powerful computers, ultra-fast data networks, and sophisticated mathematical models to execute a very large number of trades in fractions of a second. Unlike traditional investors or even regular traders, high-frequency traders focus on speed, volume, and tiny price inefficiencies rather than long-term value or fundamental analysis. Over the past two decades, HFT has transformed how markets function, how prices are discovered, and how liquidity is provided.
Understanding the Concept of High-Frequency Trading
At its core, high-frequency trading is about exploiting speed advantages. HFT firms deploy automated trading algorithms that scan markets for opportunities such as small price differences between exchanges, temporary imbalances in supply and demand, or predictable patterns in order flows. Once such an opportunity is detected, the system automatically places and cancels orders within microseconds. Human intervention is minimal, and decisions are driven entirely by pre-programmed rules and real-time data analysis.
High-frequency traders typically hold positions for extremely short periods—sometimes for just milliseconds or seconds—and close them by the end of the trading day. The goal is not to benefit from large price movements, but to accumulate profits from thousands or even millions of small trades that each generate a tiny margin.
Key Features of High-Frequency Trading
One of the defining features of HFT is ultra-low latency, which refers to the minimal delay between receiving market data and executing a trade. To achieve this, HFT firms invest heavily in advanced technology such as co-location services (placing their servers physically close to exchange servers), high-speed fiber-optic cables, and even microwave or laser-based communication systems.
Another important feature is automation. Trading decisions are made by algorithms without human emotions or hesitation. This allows HFT systems to react instantly to market changes, news releases, or order book movements.
High order-to-trade ratios are also characteristic of HFT. These systems often place and cancel a massive number of orders to probe market depth or manage risk, with only a small fraction resulting in actual trades.
Common Strategies Used in High-Frequency Trading
HFT firms employ a variety of strategies, each designed to capitalize on short-lived market inefficiencies:
Market Making: HFT firms continuously place buy and sell orders to capture the bid-ask spread. By providing liquidity, they profit from the small difference between buying and selling prices.
Statistical Arbitrage: Algorithms identify historical price relationships between securities and trade when those relationships temporarily deviate.
Latency Arbitrage: Traders exploit delays in price updates between different exchanges or data feeds.
Event-Based Trading: Algorithms react instantly to news, economic data releases, or changes in market conditions before other participants can respond.
Order Anticipation: Some strategies attempt to predict the behavior of large institutional orders and position ahead of them.
Role of High-Frequency Trading in Market Liquidity
Supporters of HFT argue that it has significantly improved market liquidity. By constantly providing buy and sell quotes, high-frequency traders reduce bid-ask spreads and make it easier for other participants to execute trades at competitive prices. In highly liquid markets such as equities, futures, and currencies, HFT firms account for a substantial share of daily trading volume.
Lower transaction costs and tighter spreads benefit retail and institutional investors alike, especially during normal market conditions. In this sense, HFT plays a role similar to traditional market makers, but at a much faster and more automated scale.
Impact on Market Efficiency and Price Discovery
High-frequency trading contributes to faster price discovery by quickly incorporating new information into asset prices. When news breaks or supply-demand conditions change, HFT algorithms react almost instantly, helping prices adjust efficiently. This rapid adjustment reduces opportunities for arbitrage and ensures that prices more accurately reflect available information.
However, critics argue that this efficiency is mostly limited to short time horizons and may not always benefit long-term investors. The focus on microsecond-level price movements does little to reflect a company’s fundamentals or economic value.
Risks and Criticisms of High-Frequency Trading
Despite its advantages, high-frequency trading has attracted significant criticism. One major concern is market instability. Events such as the “Flash Crash” highlighted how automated systems can amplify volatility when many algorithms react simultaneously to market stress.
Another issue is fairness and unequal access. HFT firms spend enormous amounts on technology and infrastructure, giving them a speed advantage that is inaccessible to most market participants. This raises questions about whether markets are truly level playing fields.
There are also concerns about liquidity illusion. While HFT provides liquidity in normal times, it may withdraw rapidly during periods of extreme volatility, leaving markets vulnerable when liquidity is most needed.
Regulatory Perspective on High-Frequency Trading
Regulators around the world closely monitor HFT activities. Measures such as circuit breakers, minimum tick sizes, order-to-trade ratio limits, and enhanced surveillance systems have been introduced to reduce systemic risks. The aim is not to ban high-frequency trading, but to ensure it operates in a way that maintains market integrity and stability.
In emerging markets like India, regulatory authorities have implemented stricter controls on algorithmic trading, including approval requirements, testing frameworks, and risk management norms to prevent misuse and excessive volatility.
High-Frequency Trading vs Traditional Trading
Compared to traditional trading, HFT operates on vastly different principles. Traditional traders rely on fundamental analysis, technical indicators, and human judgment, with holding periods ranging from days to years. High-frequency traders, on the other hand, rely on speed, data processing, and automation, with holding periods measured in seconds or less. Both play important roles in the market ecosystem, but their objectives and time horizons are fundamentally different.
The Future of High-Frequency Trading
As technology continues to evolve, high-frequency trading is likely to become even more sophisticated. Advances in artificial intelligence, machine learning, and data analytics may further enhance algorithmic decision-making. At the same time, regulators and exchanges will continue to adapt rules to balance innovation with market stability.
The future of HFT will likely focus on efficiency, transparency, and risk control rather than pure speed alone. Firms that can combine technological excellence with robust risk management will continue to shape the next phase of market evolution.
Conclusion
High-Frequency Trading has reshaped global financial markets by introducing speed, automation, and efficiency on an unprecedented scale. While it offers benefits such as improved liquidity and faster price discovery, it also raises concerns about fairness, volatility, and systemic risk. Understanding HFT is essential for anyone seeking to comprehend how modern markets function. As markets evolve, high-frequency trading will remain a powerful force—one that must be carefully managed to ensure it serves the broader interests of financial stability and investor confidence.
Highprobability

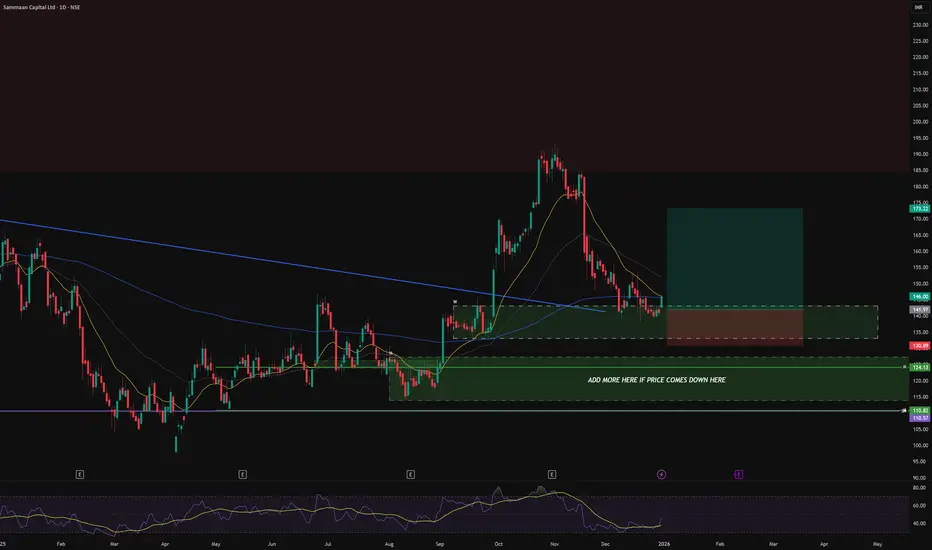
SAMMAANCAP- trading as well as investing planSAMMAANCAP looks good at CMP
the entry i have taken and the target both are mentioned on the chart
can add the stock for investing and trading both
there is a very good MDZ below this zone
can add more in that marked box
CARERATING | Channel + Flag breakout with 200 EMA supportCARERATING | Channel + Flag breakout with 200 EMA support
High probable setup
CMP : 1237
SL : 1150
Target : 1550

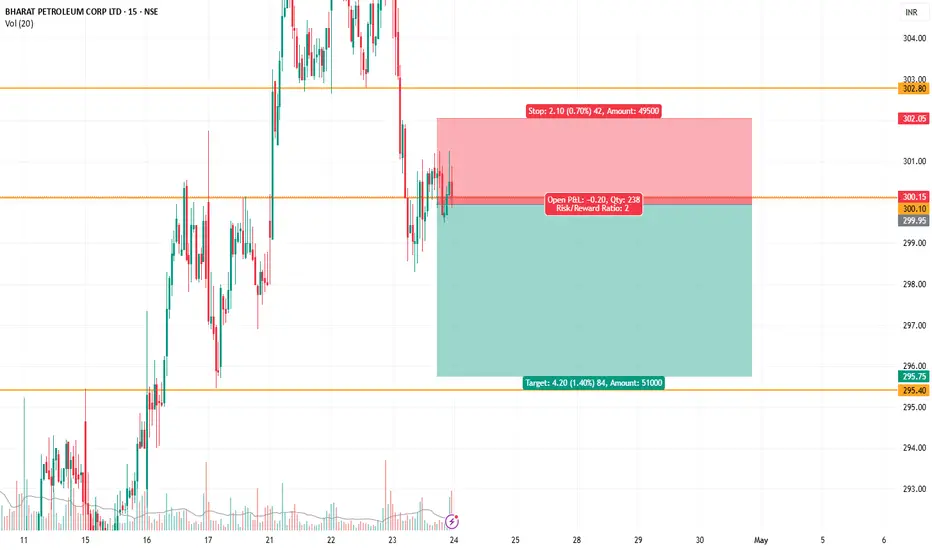
BPCL shorting oppurtunity - Intraday/SwingBPCL has fomed an HNS pattern on 15 mins time frame and is now forming a bearish flag patten. The entry tgt and SL are mentioned in the chart.
Breakout, high volume, Momentum - Cyient- SL, close below 1936
- midvaluation- Cashflow is positive, Low Debt
- Point of concerns - High PE

1:10 SWING TRADE OPPORTUNITY IN IndiaBull REALESTATE IBREALESTRefer the chart for Entry,Target and SL.
NOTE: This trade is only for Equity Swing buy and not to be considered for options trading.
Please do follow Position Sizing and Risk Reward Ratio while planning any trades.
Note: This information is for education purpose only and please do your own research and consult your financial advisor prior to taking any action.
TO CONNECT WITH ME CHECK OUT MY BIO.
If you like this Idea, Please do like my ideas and share it with your friends. check my bio.
Please boost my ideas and send cheers as it acts as a motivation to keep posting my analysis.
Thank you
ILong

NATCOPHARMNATCOPHARM
is Strong Performer development focused pharmaceutical company , today break 52w high with High volumes + high gain recorded .
This is my favorite chart pattern like "Cup and Handle " which is almost 80% successfully my side i believe on that for reached my targets' .
below some points of study for you like this ))-
Annual Revenue rose 37.57%, in the last year to Rs 2,811 Crores. Its sector's average revenue growth for the last fiscal year was 8.79%.
Company has been maintaining a healthy dividend payout of 28.0%
Holding :-
Promoter Holding :- 50%
FII :- 14%
DII :- 11 %
Public :- 25 %
give interim dividend
Ex-Date :- 26 Feb 2024
Dividend Amount :- 1.25
for MORE check in my TradingView ID
If You LIKE👌👌 MY Idea ......Boost.🔥🔥🔥.. its.
"Disclosure : I am not Sebi-registered." This channel is for only educational purpose. Any profit/loss, I am not responsible.
Before taking any trade on our charts / calls, please consult your financial advisors. Thanks

Wheels India, a great entry opportunity!!!Good entry opportunity in Wheels India.
Price is on the trend line, so risk-reward ratio is good.
Can exit with 1:2 target also.
SL can be extended upto 530.

JIO FINANCIAL SHORT TERM AND LONG TERM VIEWJIO FINANCIAL SERVICES (DAILY TIMEFRAME)
IPO base formation is taking place in this stock. Key levels to watch - Around 260 zone.
Retracement taken on 0.5 fibo zone.
The stock has been forming higher lows which shows bullish signs.
If it closes and sustains above 260 level then expected move upto 280 , 308 on short term.
for long Term Holding our Expected Level 380, 470+++

Buy Rain - Before It becomes "come again"Fundamentals:
Positive:
1. Increase in revenue
2. Profit from operating activities are increasing
3. Book value per share is increasing
4. ROCE increasing
5. Debt to equity is 1.1
Negative
1. Recent Qtr performances
2. 41% promoter holding
Technical:
1. Multi-year trendline breakout
2. High momentum
3. High Volume
Therefore buy it before it feels like,
" Rain - Rain Come Again"
SL : 158
R1: 185, R2: 203, R3:258

Turbo Breakout Setup: High-Probability Trades with Precision.NSE:CNXFINANCE
Hello Traders,
In this video, I have explained a Breakout trading setup that will generate only high-probability breakout trades, that have high success rate than another breakout.
The setup is based on a pure price action structure and does not require any indicators just we are using volume as a confirmation tool.
Why does this setup work?
The logic is very simple
let's talk about the 1st variation of this setup:- Fake Breakout
as you can see in this setup most of the time the structure completes after a fake breakout.
So that fake breakout means the short sellers in the correction phase trying to defend there stop loss and make prices go down but what do you think for how long they will be able to defend that zone when buyers' strength is increasing? so after that when buyers push the price a little above-failed breakout zone the price hits short sellers stop losses and include new buying at that level to push prices toward the sky.
What about scenario 2nd:- NO failed breakout but horizontal range inside trend resistance line.
When the trend Resistance line and horizontal line break at the same price point it invites many traders to put a limit order above that horizontal line and most of the short sellers also have put their stop loss when that zone hit the price again and start moving towards the sky.
Other factors and detailed setup have been explained in the video.
Any setup is useless without a pre-defined stop loss cause you need to focus on capital protection first then you can aim for profits.
Always take calculated risks and use proper position sizing.
This is only for educational purposes only.
Always trade with stop-loss.
I hope you found this idea helpful.
Please like and comment.
Share with Your Friends.
Keep Learning,
Happy Trading!

manpuram,short term ; min 70% return; inverted h&dhead and shoulders + flag pattern is formed
midcap and smallcap stocks are going to boom
intraday opportunity is less, but for two to three days of holding is good
for long term investment
.
.
.
.
.reffer my old analysis attached below

ICICI BANK LTD. is getting loaded for all time high.Stock is consolidating at a good price range. Any size of green candle can be considered as a trigger. It is indicating a good swing trade. Fundamentals wise ICICI bank has given a good Quarter and Quarter results. Low risk high reward stock.

$LRC at High ConfluenceAs a trader one must always look for a High Confluence setup. At least 3 technical points should meet at each other to be called as high confluence setup.
In this case of $LRC
1. Price crossed trendline
2. Support zone successfully retested and created a demand.
3. Price also reversed from 50% Fib retracement.
I am loving this, I am taking trade in it with entry, exit and stop loss clearly marked in the picture.

INFOSYS BREAKOUT SWING TRADE - INVERTED HEAD AND SHOULDERSGood day :)
NIFTY IT has given a range breakout with a strong Marubozu open candle.
Most of the IT stocks are performing really good and most of them are giving breakouts.
I have identified one of the most strongest stocks of the IT sector which holds a weightage of more than 7% in Nifty. The stock is INFOSYS.
This stock has been in a channel since May 2022. In the recent support at the base of channel , the stock has created a Inverted Head and Shoulder pattern which signals a bullish trend in the stock.
Stock has broken the neckline with a strong bull candle. We can take a long position on retest of neckline and can expect good targets.
Investors typically enter into a long position when the price rises above the resistance of the neckline and the stock has already proved this by breaking out with a strong bullish candle.
Huge volume spike can be seen at breakout which confirms it as a healthy breakout.
Resistances are identified as Target 1 and Target 2 giving a Risk Reward Ration of 1:1.5 & 1:3 respectively
The probability of targets being hit increases as the stock is in a channel.
Disclosure : I am not SEBI registered.The information provided here is for education purposes only.I will not be responsible for any of your profit/loss with this channel suggestions.Consult your financial advisor before taking any decisions.

EIH Assoc Hotels Bullish biasOverall Structure Looks Bullish
SL 320
Target 510-520s Zone
POC Zone 365s
Price is moving in HH & HL Pattern on WeeklyTF
The price is just above the 200day Moving Avg for the stock with divergence
Stock is trading near the POC line
Expecting a potential upside on the stock
Lets deep dive into Daily analysis
On Daily time frame Chart we are able to understand that price was moving in downtrend
It gave a break out from the range and now trending up with Volume Spurt
And looks like Inverted Head & Shoulders Pattern formation
Potential Target based on Daily TF looks like 480s zone i.e. 23% upside with SL of 380
The Target is also reaching at Daily POC hence once that is achieved one needs to look forward to the price reaction on those levels for Weekly Trade

NIFTY : 1 NOV#NIFTY50
GLOBAL : Global market expecting Fed will slow down its hke interest rate. (press release on Nov2)
Nifty : Bullish signal, may nifty will takeout all time high if fed slow down its rate hike. Major corporate results are over, only positive global news would take nifty from here on.
Stock : Tata Steel - Reported Negative growth rate ~6%.


AIA ENGINEERING LTD GOOD FOR SWING AIA ENGINEERING LTD GOOD FOR SWING TRADING
ASCENDING TRIANGLE BREAKOUT
C.P.M 2715
stop loss 2600
1st target 2850
2nd target 2986

NIFTY TRENDNifty analysis :
Two confirmations of shorts
1. TrendLine Rejections with above avg Volumes
2. Rsi Divergence
upon follow up - Trade ideas
1. Low Risk - Low Rewards _ High Probabilty (CREDIT SPREADS)
TRADE IDEA : SELL 18200 & above calls SEP expiry & BUY HEDGE
2. Low Risk - High Rewards _ (RATIO)
TRADE IDEA : SEP - Monthly Expiry
BUY ATM 17600PE - 2lots
BUY 16400PE - 2lots
SELL 16800PE - 4lots
POP : 42% \\ Margin Req : 80K \\ Breakeven : 17400 \\ Max Profit @16800 \\ Max Loss above 17600

BHARAT DYNAMICS LTD GOOD FOR SWING BHARAT DYNAMICS LTD GOOD FOR SWING TRADING
ASCENDING TRIANGLE BREAKOUT
volume breakout
Buy 930
1st target 976
2nd target 1023
stopp loss 865

SREE RAYALASEEMA HI STRENGTH HYPO LTDSREE RAYALASEEMA HI STRENGTH HYPO LTD good for swing tarde
Breakout Trade
stop loss=757
buy = 838
1st target =915
2nd trade =985

Aster DM Healthcare Ltd Good for swing Aster DM Healthcare Ltd good for swing tading
# Cup and handle pattern breakout
Buy = 243.80
1st Target =253.35
2nd Target =263.70
stop loss =230.70
