Hindalco BreakoutA beautiful positional breakout seen in Hindalco today along-with volume confirmation. Aluminium stocks in focus. Waiting to see the upcoming trend next week !!!
HINDALCO

HINDALCO double top detectedDouble top with divergence detected in the Hindalco daily chart.
Bearish invalidation above 864.
Bearish continuation below 847.50 with downside targets of 838, 829 and 822 as early supporting key levels.

Hindalco looking bewildered. Plan to trade either side.Hindalco is forming a double top formation on the weekly charts, showing some weakness in the stock as the market is more time in recoverying the fall of one week.
The stock has been in a good up trend and has reached 850 levels forming a base around 560-600 level zone i.e. Approx 30-35% return in 9 months.
Since June 2022, Hindalco has not taken out the previous low and recent gave the break out of the previous ATH and retested it.
Major trend for the stock is still bullish and there is a probability of continuing the same if the recent is taken out with good volumes, support the bullishness of the stock.
Bullish Scenario (A good HLHH formation is there in the stock).
Enter above 870 levels
Stop loss :- 825 (5%)
Target :- 1012 (16%)
R:R = 1:3
Buying a stock above 870 gives a bullish signal and can captured with proper SL and target.
Bearish Scenario (A double top pattern, bearish RSI divergence and Weekly 20 EMA break down).
Entry below 830 levels
Stop Loss :- 866 (4%)
Target :- 770 (7%)
R:R = 1:1.75
The targets can be trailed upto the levels of 740 levels while trailing the SL logically.
Wait for the stock to form some setup for the either side momentum and trade in the direction of the market.

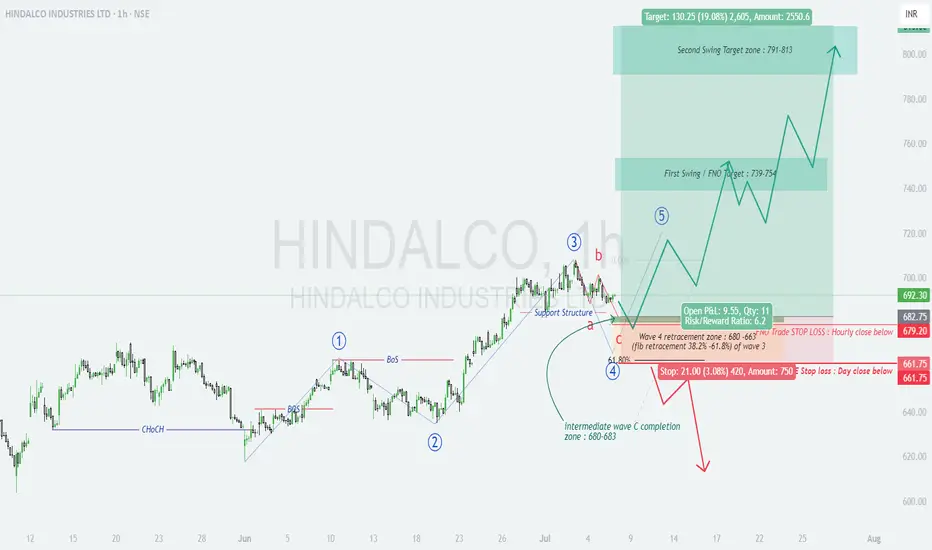
HINDALCO Gearing Up for Wave 5? Entry Zone Locked In for Swing!
📊 HINDALCO – Elliott Wave Analysis (1H Timeframe)
Textbook 5-wave impulse in play – Wave 4 nearing completion
Structurally clean setup with ideal R:R and defined invalidation. High probability long opportunity forming.
🧩 Wave Structure:
Wave 1 to 3 completed; Wave 3 peaked with momentum
Current correction forming a classic ABC zig-zag in Wave 4
Subwaves 'a' and 'b' completed; 'c' approaching ideal completion zone
🔎 Technical Confluence Zone:
Wave 4 Fib Retracement: 38.2–61.8% of Wave 3 → ₹680–663
Support Structure: Aligns with Wave C zone = ₹680–683
Price action showing slowdown → low volatility candles + buyer absorption
Entry zone aligns with high-probability reversal structure
🎯 Upside Targets (Wave 5 Projection):
First Swing Zone: ₹739–754
Second Swing Zone: ₹791–813
🛑 Stop-Loss Zones:
Intraday SL: Hourly close below ₹679.20
Positional SL: Day close below ₹661.75
📈 Reward Potential:
R:R ratio: 6.2+
Structure offers clear risk management and ideal swing setup
A must-watch for swing traders and Elliott Wave learners. Let price react at ₹680–683 zone for confirmation before entry.
#Hindalco #ElliottWave #SwingTrade #WaveAnalysis #TechnicalSetup #NSE
Hindalco Long~ Price near resistance area of 705-715
~ BO of this area in green is what we await for.
~ Symmetrical triangle pattern BO with good volumes.
~ VCP formed and BO at 663, with 13W 3T 23/4
~ Price > 30WEMA
~ RS near 0
~ CCI > 100
~ RSI > 50
~ MACD +ve
Target 1 - 772, Target 2 - 988
SL - 618
Entry can be done post BO
This is for educational purpose only. Do your own research before investing.

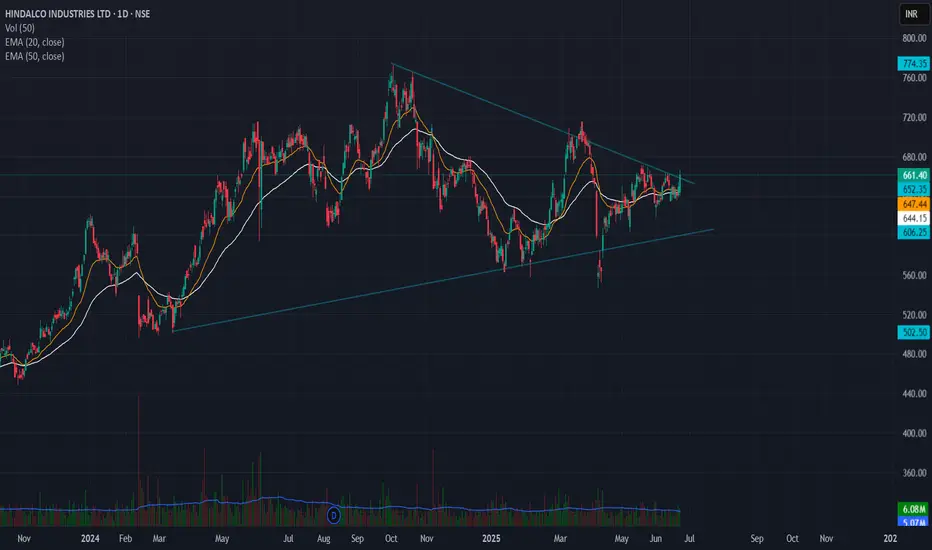
Hindalco Symmetrical Triangle breakout setup🔹 Pattern: Symmetrical Triangle
🔹 Breakout Level: ₹660
🔹 Stoploss: ₹635 (below swing low)
🔹 Target Zone: ₹850 – ₹900
🔹 Risk–Reward: 7.6 – 9.6
🔹 Timeframe: Positional (swing to medium term)
---
📊 Chart Analysis:
Hindalco has broken out of a well-defined symmetrical triangle on the daily chart, with strong price compression followed by bullish breakout confirmation.
The triangle height is ~₹200, projected from the breakout zone, giving a target range of ₹850–₹900.
🧠 Stoploss placed below the last swing low inside the triangle to avoid false breakdown traps.
Hindalco - Bears may return690 - 715 Strong Supply Zone
Sl Above 715
Entry confirmation on LTF compulsory
Downside target expecting up to 620 / 600
If falls more it may go upto 555
Broader Market currently in bearish phase
Any rise is a selling opportunity
Nifty will not be bullish till it closes above 22800

COPPERHello & welcome to this analysis
Copper (MCX) is making a bullish Harmonic Seahorse breakout. A weekly close above 885 would activate it for a potential upside probable target of 1000. Post breakout if it slips below 700 the pattern will have become invalid.
Good risk reward set up currently for accumulation.
Stocks which could gain from increase in copper prices - Hind Copper, Hindalco & Vedanta.
Sectors which could get hammered from increase in copper prices since its a part of their raw material for manufacturing - White goods consumer durables manufactures, Electric cables and wire manufactures & Automobile manufacturers.
All the best

HINDALCO: Bounce Back with Institutional Confidence – Targets ₹7"HINDALCO: Bounce Back with Institutional Confidence – Targets ₹712 & ₹772"
Stock: Hindalco Industries Ltd. (HINDALCO)
Analysis:
HINDALCO has shown a strong rebound from its major support zone after a significant correction. The stock is supported by positive institutional activity and robust financial performance, indicating potential for further upside.
Key Highlights:
Institutional Confidence:
LIC’s Recent Purchase: Increased stake by 0.01% via open market, making its total holdings 5%.
FII/FPI Holdings: Increased from 27.18% to 28.58% in Sep 2024 quarter.
Number of FII/FPI Investors: Rose from 1117 to 1145, showing growing interest.
Mutual Funds: Increased participation with schemes rising from 43 to 44.
Institutional Investors: Total holdings up from 56.67% to 56.83%.
Financials:
Net Profit: ₹1,891 Cr, a stellar 123.3% YoY growth.
Revenue: ₹23,087 Cr, a solid 10.8% YoY growth.
Technical Setup:
The stock has bounced back from its major support zone with momentum.
RSI and other indicators suggest further upside potential.
Trade Plan:
CMP: ₹667 (example).
Targets: ₹712 (initial target), ₹772 (next level).
Stop Loss: Below ₹640 to manage risks.
Disclaimer:
This analysis is for educational and informational purposes only and should not be considered as financial advice. Please conduct your own research or consult a financial advisor before making any investment decisions.

HINDALCO CLEAR PATTERN Hindalco has formed an inverted head and shoulders pattern, followed by a successful retest of key levels, which provides a strong trading opportunity. This setup offers a clear edge for traders, as it suggests a potential trend reversal and a favorable risk-reward ratio.

Technical Analysis of LME INDEX Based on Elliott WavesTechnical Analysis of LME INDEX Based on Elliott Waves
The information provided in this response is based on the analysis of the Elliott Wave chart and does not constitute financial advice. The author is not responsible for any investment gains or losses incurred by individuals who rely on this information.
Elliott Wave Theory is a technical analysis method that identifies recurring patterns in financial markets. These patterns, known as Elliott Waves, are based on the idea that human psychology and behavior drive market movements.
Key Elliott Wave Principles:
Five-Wave Impulse: A five-wave pattern that represents an uptrend or downtrend.
Three-Wave Correction: A three-wave pattern that represents a pause or reversal in the trend.
Fibonacci Relationships: Numerical relationships between different waves, often expressed as ratios (e.g., 0.618, 1.618).
Analysis of the LME INDEX Chart:
Based on the provided Elliott Wave chart, it appears that the LME INDEX is currently in the early stages of an impulse wave structure. This suggests a strong uptrend is underway.
Specific Observations:
Wave 1: The initial upwave has likely been completed.
Wave 2: A corrective pullback also looking done.
Wave 3: The next wave is expected to be a powerful extension of the uptrend.
Impact on Commodities and Indian Metal Stocks:
The LME INDEX is a crucial benchmark for the metals market. Its price movements can significantly impact the prices of individual metals and related commodities. Indian metal stocks, such as Vedanta, NALCO, and Hindustan Zinc, are directly influenced by the LME INDEX.
Educational Purpose:
It's important to emphasize that this analysis is for educational purposes only and should not be considered as trading advice. The financial markets are volatile, and past performance does not guarantee future results. Investors should conduct their own research and consult with financial advisors before making any investment decisions.
I am not sebi registered analyst. My studies are for educational purpose only. Please Consult your financial advisor before trading or investing. I am not responsible for any kinds of your profits and your losses.
Most investors treat trading as a hobby because they have a full-time job doing something else.
However, If you treat trading like a business, it will pay you like a business.
If you treat like a hobby, hobbies don't pay, they cost you...!
Hope this post is helpful to community
Thanks
RK💕
Disclaimer and Risk Warning.
The analysis and discussion provided on in.tradingview.com is intended for educational purposes only and should not be relied upon for trading decisions. RK_Charts is not an investment adviser and the information provided here should not be taken as professional investment advice. Before buying or selling any investments, securities, or precious metals, it is recommended that you conduct your own due diligence. RK_Charts does not share in your profits and will not take responsibility for any losses you may incur. So Please Consult your financial advisor before trading or investing.

Hindalco in Uptrend Hindalco Moving in Parallel Channel in Uptrend with Sideways Momentum Expected.
Hindalco is currently trading within a well-defined parallel channel, showing a strong uptrend. The stock has respected the channel's boundaries, with consistent higher highs and higher lows. As the price approaches the upper boundary, some sideways consolidation is anticipated, indicating potential resistance at this level.

Crossover Swing + Breakout Trade - HINDALCO📊 Script: HINDALCO
📊 Sector: Non Ferrous Metals
📊 Industry: Aluminum and Aluminum Products
Key highlights: 💡⚡
📈 Script is trading at upper band of BB and giving breakout of it.
📈 Script is giving Cup & handle Pattern Breakout on daily chart.
📈 Already crossover in MACD.
📈 Double Moving Averages are giving crossover.
📈 Right now RSI is around 66.
📈 One can go for Swing Trade.
⏱️ C.M.P 📑💰- 717
🟢 Target 🎯🏆 - 810
⚠️ Stoploss ☠️🚫 - 672
⚠️ Important: Always maintain your Risk & Reward Ratio.
✅Like and follow to never miss a new idea!✅
Disclaimer: I am not SEBI Registered Advisor. My posts are purely for training and educational purposes.
Eat🍜 Sleep😴 TradingView📈 Repeat 🔁
Happy learning with trading. Cheers!🥂

Hindalco CnH patternHindalco showing a good CnH pattern and accumulation in the range of 640-710. Seems ready for good upside if crosses abv 710 with tgt of 810/890
Metal stocks can show good upside after rate cut and China economy stabilising.

* Sell land to century textile * Trading it's resistance level👑 Entry 666 to 668Target 678 689Stoploss 660Time 0 to week* Sell land to century textile* Trading it's resistance level

metals are getting cold.metal stocks and index are not looking good for longs right now with global slowdown especially with china slowdown . any positive news from china for real estate sector will bring boost to metal prices.its not TA or FA but a opinion . avoid ferrous metal contracts/stocks . when time comes for long zinc/magnesium/coppper/aluminium are the ones that perform better than any other.
: just a educational guess and not a trading call for buy or sell.

Hindalco Industries Ltd - Breakout OpportunityDate : 22-Aug-2024
LTP : Rs. 685.55
Next Resistances: (1) Rs. 715 --> (2) Rs. 790
SL : Rs. 608 on daily close basis
Technical View:
• NSE:HINDALCO is in it's primary uptrend and was recently going through it's secondary downtrend.
• After touching the high of 712.10 on 10-Jul-2024, it has retraced 15% to 608 level.
• On 21-Aug-2024, NSE:HINDALCO has broke out from it's secondary downtrend with higher than average volume.
• NSE:HINDALCO is trading above 20 DMA and 50 DMA. On 19-Aug-2024 it closed above 20 DMA and on 21-Aug-2024 it closed above 50 DMA.
• RSI is already in buy zone and trading at 61.20.
• MACD has already crossed over it's signal line and about to cross 0 line.
• Looking strong to start a new swing from here.
Like the analysis? Boost/Like this idea and follow my ID.
Disclaimer : I am not a SEBI registered analyst/consultant and not recommending anyone to take any BUY or SELL position in stock market. Investing in stock market is risky and one should do a self analysis and validation before investing in stock market. My ideas are published for learning purpose only and are available to everyone at no cost/charge.

NMDC is trading near prev support zone Stocks to Keep in Radar for Next Week
⏩ SBIN
⏩ NMDC
⏩ BHEL
⏩ DLF
NMDC If continues to holds the prev week support level,
recovery towards 270 could be possible.
However in case of Bearish pattern at higher level, it may come back to prev week's range
Important downside support is around 245 zone
whereas upside hurdle is aroud 270 level
*Election Results can create Volatility in the Maket
Keep Tracking Charts
*For Educational Purpose
Learn & Practice Price Action setups

HINDALCO | Breaks two year long highest point and moves uptrendHINDALCO | Breaks two year long highest point and moves upward
1) Stock breaches two year long highest point and continues uptrend
2) Still follows a clean market structure of making higher highs.

Hindalco - Target 760Hindalco is making cup pattern and above neck line with bullish trend and 760 in few weeks looks possible. very good buy for quick profits

HINDALCO INVERSE H&S BREAKOUTHindalco breaking inverse h&s pattern
with good volume and rsi
#target 770
follow ur sl
EDUCATIONAL IDEA

Hindalco Industries Ltd - Breakout OpportunityDate : 26-Mar-2024
Rating : Buy - Positional Trade
LTP : Rs. 558.65
Targets: (1) Rs. 620 --> (2) Rs. 636 --> (3) 675
SL : Rs. 515
Technical View:
• NSE:HINDALCO is in its primary uptrend since end of Jun 2023 and was recently going through it's secondary downtrend.
• After touching the high of 608.95 on 8-Feb-2024, it has retraced 18% to 499 level.
• NSE:HINDALCO has broke out from its secondary down trend on 15-Mar-2024 with higher then average volume.
• RSI has crossed 50 on 21-Mar-2024 and MACD crossed 0 on 22-Mar-2024.
• Looking strong to start a new swing from here.
Disclaimer : I am not a SEBI registered analyst/consultant and not recommending anyone to take any BUY or SELL position in stock market. Investing in stock market is risky and one should do a self analysis and validation before investing in stock market.

Hindalco - extremely bullish Hindalco given excellent Q3 results, price is making fresh all time high. cup and handle pattern in chart. handle it self is 100 rs so share price can increase 100 to 300 rs in a yr or any time based on Q4 results/
