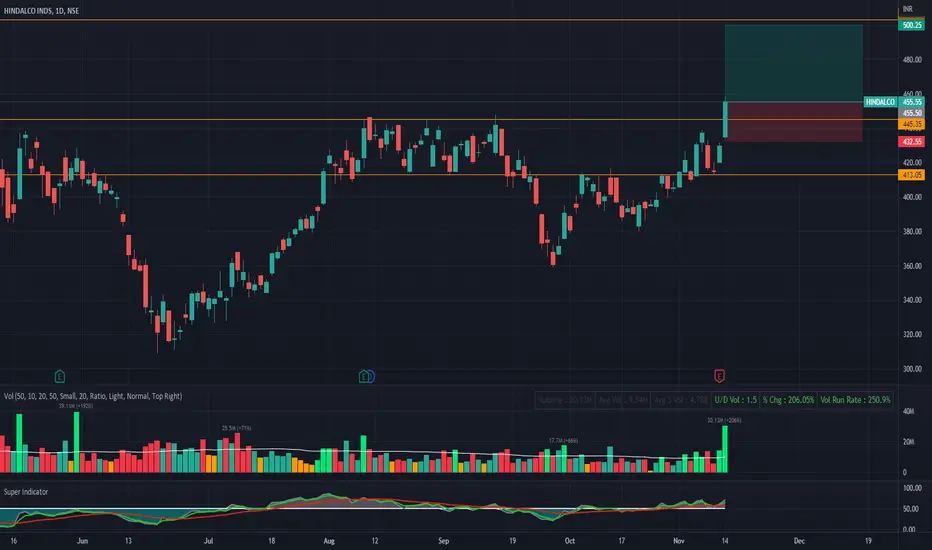
HINDALCO - Ichimoku Bullish Breakout Stock Name - Hindalco Industries Limited
Ichimoku Cloud Setup :
1). Today's close is above the Conversion Line
2). Future Kumo is Turning Bullish
3). Chikou span is slanting upwards
All these parameters are showing bullishness at Current Market Price
and more bullishness AFTER crossing 504
#This is not Buy and Sell recommendation to any one. This is for education purpose and a helping hand to learn trading in Market.
# Cloud Trading
# Ichimoku Cloud
# Ichimoku Followers
I hope you all like my analysis.
Please do share your thoughts into comment section.
Please give a like, share & subscribe for daily analysis.
HINDALCO

Hindalco:long positionHindalco consolidation in very narrow range after trendline breakout. So keep on your eyes on it
Entry level :- Above @500
Stop Loss:- Below @497
Target:- 1:1 or 1:2

HINDALCO -- Daily Trendline Breakout HINDALCO --DAILY TRENDLINE BREAKOUT --CHART SETUP
1. Hindalco seen Daily trendline breakout at last closing session .
2. currently stoock trading at upper channel higher high and higher low formation seen on daily chart after sharp fall towards 320 sub level .
3. channel support seen at 360 sub level and resistance at 480 level of channel .
4. trix line seen crossover at center line ( o line ) and move at upword direction which is bullish signal
5. one can buy at 400-405 level for positional target 425-450-480 + ( 1-2 Month ) Stop loss can place bellow channel support at 355
** THIS IDEA IS FOR EDUCATIONAL PURPOSE ** trade at own risk.!
HAPPY TRADING . !!

HINDALCO for longHindalco Industries Ltd Shareholding Pattern is stable. Good for long term investment.
Buy above 500 price and hold for 630 target. Analysis is based on 125 min time frame. See the chart and take decision after on own analysis.
PROS
Company is expected to give good quarter.
Company has delivered good profit growth of 47.5% CAGR over last 5 years.
Company's working capital requirements have reduced from 24.5 days to 19.3 days.

Shooting StarA shooting star occurs after an advance and indicates the price could start falling.
The formation is bearish because the price tried to rise significantly during the day, but then the sellers took over and pushed the price back down toward the open.
Traders typically wait to see what the next candle (period) does following a shooting star. If the price declines during the next period they may sell or short.
If the price rises after a shooting star, the formation may have been a false signal or the candle is marking a potential resistance area around the price range of the candle.
Script = Hindalco
Time Frame = 15 min

Metals Sector Analysis, tata steelIt's time to be aware that metals are a hot topic right now.
and once a certain stock or index enters retail, markets frequently move in the opposite direction.
It is wiser to wait for a follow-up candle when taking longs.
follow for more

Long Hindalco Hindalco is looking good as per structure formation. Higher high higher low formation with subsequent breakouts and then time is also aligned so looks good for 504-505 target SL below 450

Hindalco India : Study & Forecast Hello beautiful people,
I am going to present hindalco future trend in near future, as we can see hindalco has broken the tradeline which was the strong support for the uptrend , short-covering also done to the respective tradeline.
In 4 hours chart we can see the rejection candle formed but confirmation yet to be done any red candle on 4 hours chart will indicate a clearer downtrend for hindalco. However it is still taking support of 100MA that can play major role here .
Few target that can be seen in hindalco are given below
435
430
425
Thank you so much for paying attention. Pls follow me for amazing things in future
Note -
This is just an educational post I do not recommend any buying or selling by the post, All the investors are advised to get in touch with their financial advisor regarding any kind of buying or selling advise on the posted idea.

Hindalco Weekly Elliott Wave Counts Hindalco charts are reflections of Aluminium Price moves only difference is Hindalco did a little more than 50% Retracement of Wave A fall where as Aluminium did very small retracement ideally Hindalco should head towards 235-200 levels in Wave C in next few months.

Reason for why should you watch Hindalco !!Hindalco has given a breakout today & it's also at a good level to catch
Why Hindalco is a Buy? NSE:HINDALCO
Reason for Buy:-You can see metals are Inversely Proportional to Autos.
Even as of now, metals are standing stronger when volatility comes in the market.
This gives the Idea that the demand for metals is more than the supply, making the price move Higher.
Don't forget to follow
Follow for your learnings

HINDALCO INDhindalco ind daily time frame inverted head and solder pattern good breackout and retest the naickline
as expected moov in more than 30% upside.

HINDALCONSE:HINDALCO breaking out of Cup & Handle Pattern.
Has formed a Good Base and now ready to scale to New Highs.

Breakout in HindalcoChart -> Hindalco Daily
Hindalco has given a breakout above previous 4 times resistance zone with good volumes.
CMP: 455
Targets: 512, 560
Good to add: Around 440
SL: 413 Daily close
Disclaimer: This is for educational purposes only, not any recommendations to buy or sell. As I am not SEBI registered, please consult your financial advisor before taking any action.

Hindalco breakout on daily chart Hindalco breakout on daily chart, Can go long with stoploss of 430 for the target of 480,500+
Hindalco breakout Breakout in hindalco, a trade can be initiated with 3-5% of SL; for the targets mentioned in the chart


HINDALCOHINDALCO:- formed cup and handle pattern. breakout the level 446.90. keep on eye for short term
Hello traders,
As always, simple and neat charts so everyone can understand and not make it too complicated.
rest details mentioned in the chart.
will be posting more such ideas like this. Until that, like share and follow :)
check my other ideas to get to know about all the successful trades based on price action.
Thanks,
Ajay.
keep learning and keep earning.

HINDALCO #Watchlist
#HINDALCO (D):-CMP 455 Looks Good Above 460 for Target 480/500, 420 below closed (View Invalid) :)
#Disclaimer:-View shared is for educational purposes only.

HINDALCO - Clear BO, trend reversalHINDALCO - Seems a clear BO on the daily/ weekly chart.
Plan the trade and take it as per your risk apatite.
Comment with your opinion/analysis/thoughts on this. I'm a stock market learner.

Hindalco is breaking 200 Day Moving averageHere Hindalco is breaking 200Day MA. It is also breaking and closing above FIB .382. In nearly future It can easily touch its Fib .618
Setting up 2 target
TG1 472
TG2 511

HINDALCOHi guys, In this chart i Drew My Best Levels in HINDALCO for Long, Observed these Levels based on price action and Demand & Supply. Don't Take any trades based on this Post...because this chart is for educational purpose only not for Buy or Sell Recommendation.. Thank Q

HINDALCOHINDALCO failed to complete the BOWL pattern now it is trying to make a CUP with Handle pattern
Buying levels above 415 with the SL of 4 to 5 rs and we can look for 1:1 to 1:2 target or more depending upon the volume.
selling is preferred below the 400 level and risky traders can have sold below 408 with the target of 404 up to 400 can continue further below 400 level
Disclaimer: These are not any recommendations for any funds or stocks and are meant only for educational purposes.

FORMING ROUNDING BOTTOM FORMING ROUNDING BOTTOM
If cross and close 401.50, May consider as breakout.
TARGET UPTO 439 WHICH IS ALMOST 9%.
