about to break📈 Hindustan Copper | Strong Rally → Resistance Zone
Hindustan Copper has delivered a sharp multi-week rally and is now facing resistance near the ₹560–575 zone, which aligns with a major historical supply area.
🔍 Technical Summary:
* Massive breakout from long-term base (Weekly)
* Vertical up-move → momentum exhaustion signals
* Intraday & daily charts show selling pressure near resistance
* Healthy consolidation / pullback expected after sharp run
📊 Current View:
* Zone ₹560–575 = Major resistance
* Fresh breakout only on strong close above ₹580
* Support to watch on pullbacks: ₹520–500
📌 Status: Rally Extended | Caution Advised
⚠️ Disclaimer: Educational purpose only. Not financial advice.
#HindustanCopper #ProfitBookingZone #StockMarketIndia #RallyStock #TechnicalAnalysis #SwingTrading #PriceAction #IndianStocks
HINDCOPPER

BUY TODAY SELL TOMORROW for 5%DON’T HAVE TIME TO MANAGE YOUR TRADES?
- Take BTST trades at 3:25 pm every day
- Try to exit by taking 4-7% profit of each trade
- SL can also be maintained as closing below the low of the breakout candle
Now, why do I prefer BTST over swing trades? The primary reason is that I have observed that 90% of the stocks give most of the movement in just 1-2 days and the rest of the time they either consolidate or fall
Cup & Handle Breakout in RICOAUTO
BUY TODAY SELL TOMORROW for 5%

HINDCOPPER: Trendline and Triangle Breakout, Chart of the MonthWhy This NSE:HINDCOPPER Chart Could Signal India's Next Major Commodity Play, even after giving such a robust run so far. Let's Understand in the "Chart of The Month"
As per the Latest SEBI Mandate, this isn't a Trading/Investment RECOMMENDATION nor for Educational Purposes; it is just for Informational purposes only. The chart data used is 3 Months old, as Showing Live Chart Data is not allowed according to the New SEBI Mandate.
Disclaimer: "I am not a SEBI REGISTERED RESEARCH ANALYST AND INVESTMENT ADVISER."
This analysis is intended solely for informational purposes and should not be interpreted as financial advice. It is advisable to consult a qualified financial advisor or conduct thorough research before making investment decisions.
Price Action Analysis:
Long-Term Trend Structure:
- Historical Peak and Correction: The stock witnessed a spectacular rally in early 2010, reaching an all-time high of ₹658, marking its glory days during the global commodity super-cycle. This was followed by a brutal multi-year correction that took the stock down approximately 90% to levels near ₹55 by 2013.
- Extended Consolidation Phase (2013-2020): After the sharp decline, the stock entered a prolonged seven-year consolidation phase, oscillating between ₹40 and ₹90, building a massive base structure. This extended sideways movement allowed weak hands to exit and created a solid accumulation zone.
- The 2020-2023 Recovery Rally: Post-COVID recovery and commodity reflation themes triggered a strong upward movement from pandemic lows around ₹30-40 to the ₹90-120 range, marking the beginning of a structural reversal.
- Triangle Breakout Formation: The chart clearly displays a large ascending triangle pattern formed between 2020 and 2025, with the stock making higher lows while testing resistance near the ₹420-450 zone multiple times. The recent price action shows a decisive breakout above this multi-year resistance.
Current Price Action:
- Breakout and Retest: The stock has broken out from the ascending triangle pattern and is currently trading around ₹475.60 (as of December 27, 2025), showing a gain of approximately 45% from its recent breakout point.
- Intraday Movement: Current session shows strong volatility with an intraday high of ₹480.85 and a low of ₹443.25, indicating active participation from both bulls and bears near record levels.
- Short-Term Performance: The stock has surged over 75% in calendar year 2025 and has gained approximately 74.8% in the last six months, significantly outperforming the broader Nifty 50 index, which is up only 10.83% year-to-date.
Volume Spread Analysis:
- Volume Surge: The volume panel shows exceptional activity in recent sessions, with December 27 recording 494.78 million shares traded versus the 20-day average of 166.43 million shares, representing nearly 3x the normal volume. This indicates strong institutional and retail interest.
- Second Best Volume in History: Recent sessions have recorded the second-highest volume in the stock's trading history, suggesting a major accumulation or distribution phase.
- Volume Confirmation: The breakout from the triangle pattern is accompanied by robust volume expansion, which validates the move and reduces the probability of a false breakout.
Key Technical Levels:
Support Zones:
- Immediate Support: ₹415-420 zone, which represents the upper boundary of the recently broken triangle pattern. This level previously acted as resistance and should now provide support on any pullback.
- Secondary Support: ₹380-390 range, coinciding with the previous swing high from mid-2024.
- Major Support Base: ₹300-320 zone, which served as a strong consolidation area during the triangle formation phase. This represents a critical support level for the medium-term uptrend.
- Long-Term Base: ₹200-220 area, which marks the ascending trendline of the triangle pattern and would be a key level to watch in case of a deeper correction.
Resistance Zones:
- Immediate Resistance: ₹480-490 zone, representing the current all-time high region for this rally phase.
- Psychological Barrier: ₹500 level, a round number that often acts as psychological resistance.
- Historical Peak: ₹658 (all-time high from 2010), which remains the ultimate resistance target. However, adjusting for inflation and changed market conditions, this level may need to be recalculated.
Base Formation:
- Multi-Year Base (2020-2024): The stock carved out a large accumulation base between ₹150 and ₹450 over approximately four years, characterised by higher lows and repeated tests of the ₹400-420 resistance zone.
- Base Depth and Width: The base shows a well-structured pattern with good width (4+ years) and reasonable depth, which typically precedes significant upward moves.
Technical Patterns:
Ascending Triangle Pattern:
- Formation: Clear ascending triangle pattern visible from 2022 to 2025 with a flat top around ₹420-450 and rising bottoms connecting approximately ₹200 to ₹380.
- Breakout: Decisive breakout occurred in late 2024/early 2025 with strong volume confirmation.
Symmetrical Triangle:
- The cyan-colored triangle marked on the chart shows a shorter-term symmetrical compression pattern forming during 2024-2025, which has also been broken to the upside.
- This pattern suggests continuation of the bullish momentum with potential targets in the ₹500-550 range in the near term.
Higher Highs and Higher Lows:
- Since the 2020 bottom, the stock has consistently printed higher highs and higher lows, establishing a clear uptrend structure across multiple timeframes.
- Each correction has found support at progressively higher levels, indicating strong underlying demand.
Sectoral Backdrop:
Global Copper Market Dynamics:
- Supply-Demand Imbalance: The global copper market is sliding into a deficit, with the International Copper Study Group expecting a refined copper shortfall of around 150,000 tonnes in 2026, reversing previous surplus forecasts.
- Production Challenges: UBS forecasts deficits of 230,000 tonnes in 2025 and more than 400,000 tonnes in 2026 as mine disruptions in Chile, Peru and Indonesia collide with rising demand.
- Price Rally: International copper prices have surged approximately 36% year-to-date, reaching near-record levels above $12,000 per tonne on the LME, driven by tight supply and robust demand.
Structural Demand Drivers:
- AI and Data Centres: Data centres are estimated to need around 1.1 million tonnes of copper annually by 2030, close to 3% of global demand, representing a massive new source of inelastic demand.
- Electric Vehicles: Copper demand from the EV sector is projected to climb from 1.7 million tonnes per annum today to 4.3 million tonnes by 2035, growing at an annual rate of 10%.
- Energy Transition: The shift to renewable energy systems will require an additional 2 million tonnes of copper supply over the next decade, according to Wood Mackenzie research.
- Emerging Market Growth: India and Southeast Asia are expected to add 3.3 million tonnes of demand by 2035, translating to average annual growth rates of 7.8% and 8.2% respectively.
India-Specific Dynamics:
- Strategic Positioning: India is expected to surpass the United States as the world's third-largest copper consumer by 2050, reflecting rapid industrialisation and infrastructure development.
- Import Dependence: India currently imports a significant portion of its copper requirements, making domestic producers like Hindustan Copper strategically important.
- Government Focus: Copper has been included in the US Critical Minerals list, and similar designations globally highlight its strategic importance for economic and national security.
Fundamental Backdrop:
Company Overview:
- Monopoly Position: Hindustan Copper is the only Indian company mining copper and owns all the operating mining leases of copper ore in India, having access to about 45% of India's copper ore reserves and resources as of FY25.
- Vertical Integration: The company is India's sole vertically integrated copper producer, with operations spanning mining, ore beneficiation, smelting, refining, and rod extrusion.
- Government Backing: HCL is a Miniratna Category-I Central Public Sector Enterprise under the Ministry of Mines, providing it with government support and strategic importance.
Production and Operations:
- Production Capacity: Hindustan Copper produced approximately 537,000 tonnes of copper in the financial year 2025, outperforming private sector peers.
- Resource Base: The company holds resources and reserves of 755.32 million tonnes estimated as of April 1, 2024.
- Operational Units: HCL operates mines at Malanjkhand (Madhya Pradesh), Khetri (Rajasthan), and the Indian Copper Complex at Ghatsila (Jharkhand), along with smelting and refining facilities.
Recent Financial Performance:
- Strong Growth: Hindustan Copper reported a 39.1% quarter-on-quarter increase in consolidated revenues for Q2 FY 2025-26, with year-on-year growth of 38.5%.
- Profitability: Net profit increased 38.5% QoQ and 83% YoY in Q2 FY26, demonstrating strong operational leverage.
- Debt Reduction: The company has significantly reduced its debt burden, improving financial health and flexibility for expansion projects.
Strategic Initiatives:
- Revival of Rakha Mine: The company successfully executed a mining lease deed for the strategically important Rakha Mine in September 2024, which should boost future copper output.
- International Collaboration: HCL signed an MoU with CODELCO, Chile's state-owned copper mining giant, in April 2025 to exchange expertise and enhance capabilities in mineral exploration and processing.
- Expansion Plans: An MoU with NTPC Mining Ltd was signed in December 2025 to jointly pursue copper and critical minerals block auctions, indicating an aggressive expansion strategy.
- State-Level Partnerships: MoU signed with Madhya Pradesh State Mining Corporation for exploration of critical minerals, including copper, in the state.
Valuation Metrics:
- PE Ratio: The stock trades at a trailing PE of approximately 80x, which is elevated but reflects its monopoly position and growth expectations.
- Market Capitalisation: As of December 27, 2025, the company's market cap stands at approximately ₹42,992 crore.
Key Developments:
- LIC Stake Sale: Life Insurance Corporation of India reduced its stake from 6.086% to 4.072% through open market sales between August 2024 and December 2025, representing a booking of profits after the strong rally.
Risk Factors:
Technical Risks:
- Overextension: The stock has rallied 75% year-to-date and is trading well above its intrinsic value estimates, suggesting vulnerability to profit-booking.
- Resistance Ahead: The stock is approaching psychological resistance at ₹500 and faces uncertain price discovery beyond current levels.
- Volume Concerns: Extremely high volumes could indicate climactic buying, which sometimes precedes consolidation or correction phases.
Fundamental Risks:
- Commodity Price Volatility: As a pure-play copper producer, the company is susceptible to international copper price fluctuations.
- Production Constraints: Several of the company's smelting and refining facilities have remained suspended since 2019, limiting downstream value addition.
- Operational Efficiency: The company currently sells copper concentrate rather than finished products from some facilities, reducing margins.
- Execution Risk: Ambitious expansion plans through auctions and partnerships carry execution and capital deployment risks.
Market Risks:
- Valuation Multiple Compression: At current elevated valuations, any disappointment in earnings growth or copper prices could trigger sharp corrections.
- Global Economic Slowdown: Recession fears or China slowdown could impact copper demand despite structural growth drivers.
- Supply Response: Higher prices may eventually incentivise new supply additions globally, potentially easing the deficit.
Bull Case:
- India's Only Copper Miner: Monopoly position in copper ore mining provides strategic moat and pricing power.
- Structural Demand Drivers: AI, EVs, renewable energy, and India's industrialisation create multi-year demand tailwinds.
- Supply Deficit: Global copper market moving into deficit with limited near-term supply additions supporting prices.
- Operational Leverage: Fixed cost base means higher copper prices flow directly to the bottom line.
- Strategic Importance: Government backing and critical mineral status provide support for expansion.
Bear Case:
- Extreme Valuation: Trading at a 257% premium to intrinsic value leaves little room for error.
- Production Limitations: Suspended facilities and the concentrate sales model limit revenue potential.
- Execution Uncertainty: New projects through auctions are years away from production.
- Commodity Cyclicality: Copper prices could correct sharply if macro conditions deteriorate.
- Institutional Profit-Booking: LIC stake reduction signals some smart money taking profits.
My 2 Cents:
NSE:HINDCOPPER is at a critical juncture, benefiting from a rare combination of technical breakout, commodity super-cycle dynamics, and structural demand shifts driven by AI and electrification. But at these elevated valuations, be cautious and have disciplined risk management.
Full Coverage on my Mid-Week Newsletter coming Wednesday.
Keep in the Watchlist and DOYR.
NO RECO. For Buy/Sell.
📌Thank you for exploring my idea! I hope you found it valuable.
🙏FOLLOW for more
👍BOOST if you found it useful.
✍️COMMENT below with your views.
Meanwhile, check out my other stock ideas on the right side until this trade is activated. I would love your feedback.
As per the Latest SEBI Mandate, this isn't a Trading/Investment RECOMMENDATION nor for Educational Purposes; it is just for Informational purposes only. The chart data used is 3 Months old, as Showing Live Chart Data is not allowed according to the New SEBI Mandate.
Disclaimer: "I am not a SEBI REGISTERED RESEARCH ANALYST AND INVESTMENT ADVISER."
This analysis is intended solely for informational purposes and should not be interpreted as financial advice. It is advisable to consult a qualified financial advisor or conduct thorough research before making investment decisions.

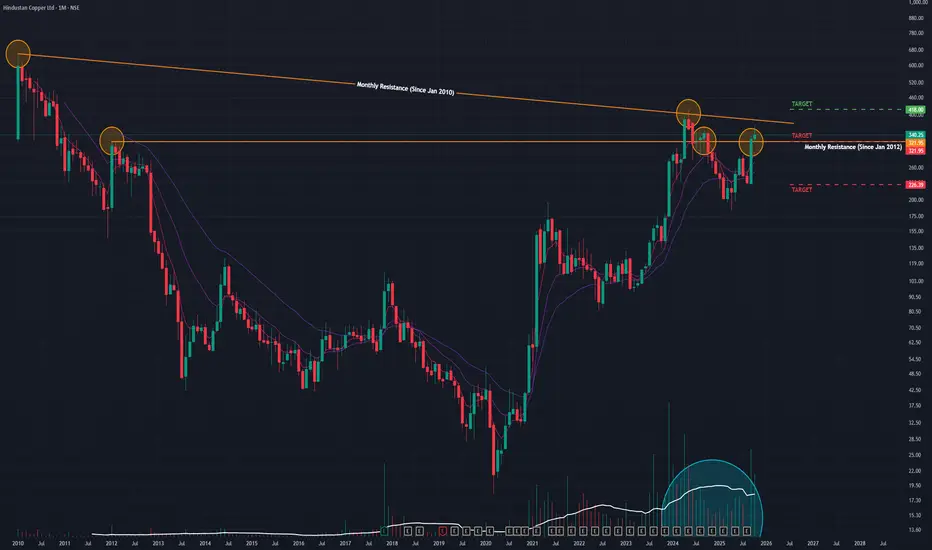
HindCopper (M): Very Bullish, but at a major inflection pointThe stock has successfully completed a multi-decade base breakout and is now challenging its final long-term resistance. The momentum is bullish, but a new ATH will require a confirmed break of the 2010 trendline.
📈 1. The Long-Term Context (The "Big Picture")
- Parabolic Uptrend: After hitting its all-time low in March 2020, the stock has been in a massive bullish uptrend, surging over 2,170% from its bottom.
- Brief Correction: This major move was followed by a healthy, brief downtrend/consolidation that found its low in May 2025, allowing the chart to reset for its next move.
- Recent Rising Volume: Critically, trading volume has been rising significantly in recent months, confirming strong investor interest in this new trend.
🚀 2. The Current Breakout (The Decisive Move)
The stock is currently navigating two of the most significant resistance levels on its multi-decade chart:
1. Jan 2012 Horizontal Resistance: A major structural level that capped all rallies for over 12 years.
2. Jan 2010 Angular Resistance: A long-term downtrend line that forms the final barrier to a new price discovery phase.
In September and October, the stock achieved a major milestone: it broke out and closed above the 12-year horizontal resistance line .
During October, the stock successfully retested this old resistance as new support . While it finished the month with a 3.28% gain on exceptionally high volume , it also formed an "inverted hammer" candle. This candle at a new support level is a sign of a "battle," where sellers tried to push the price down but buyers ultimately stepped in, defending the breakout.
📊 3. Key Technical Indicators
The underlying momentum on higher timeframes supports a bullish resolution:
- RSI: The Relative Strength Index is rising on the Monthly chart, indicating strong, sustained buying momentum.
- EMAs: The short-term Exponential Moving Averages are in a "PCO" (Price Crossover) state on the Monthly timeframe, confirming the long-term trend is powerfully bullish.
🎯 4. Future Scenarios & Key Levels to Watch
The stock is currently coiled less than 15% below its final angular resistance from 2010.
🐂 The Bullish Case (Final Breakout)
- Trigger: A decisive, high-volume breakout and close above the 2010 angular resistance trendline .
- Confirmation: This would confirm the start of a new, long-term bull market and put the stock into "blue-sky" price discovery.
- Target: The next logical technical price target is projected to be ₹415 , with a high probability of a move toward a new ATH.
🐻 The Bearish Case (Breakout Failure)
- Trigger: The stock fails to break the 2010 trendline and, more importantly, loses its new support (the 2012 breakout level).
- Confirmation: A high-volume close below the ₹320 support level.
- Target: This failure would signal a fake breakout and could lead to a sharp correction, retesting the next major support level at ₹225 .
Conclusion
This is a high-conviction breakout setup. The successful retest of the 12-year resistance is a very bullish sign. All eyes should now be on the 2010 angular trendline . A break above it would be the final confirmation, while a failure and drop below ₹320 would invalidate the immediate bullish thesis.
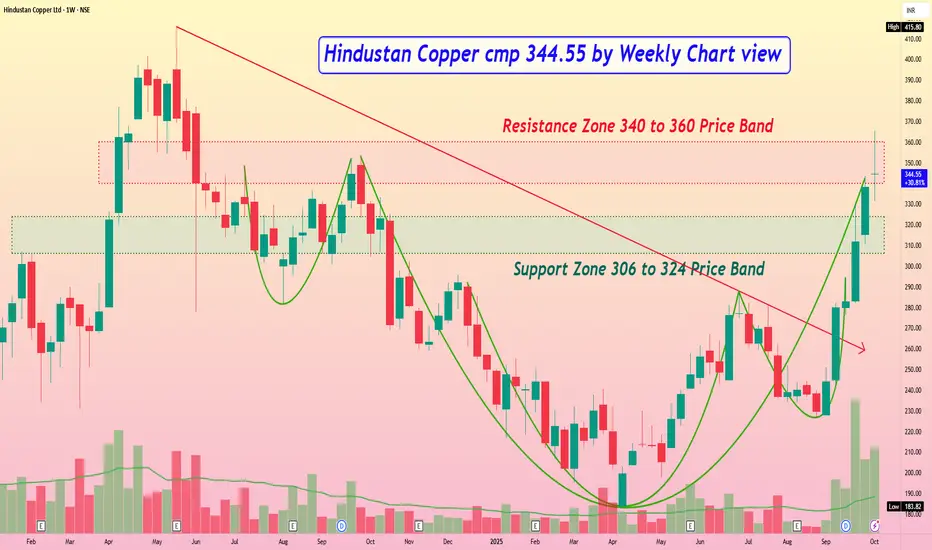
Hindustan Copper cmp 344.55 by Weekly Chart viewHindustan Copper cmp 344.55 by Weekly Chart view
- Support Zone 306 to 324 Price Band
- Resistance Zone 325 to 337 Price Band
- Falling Resistance Trendline Breakout is well sustained
- Bullish Rounding Bottom formed by Resistance Zone neckline
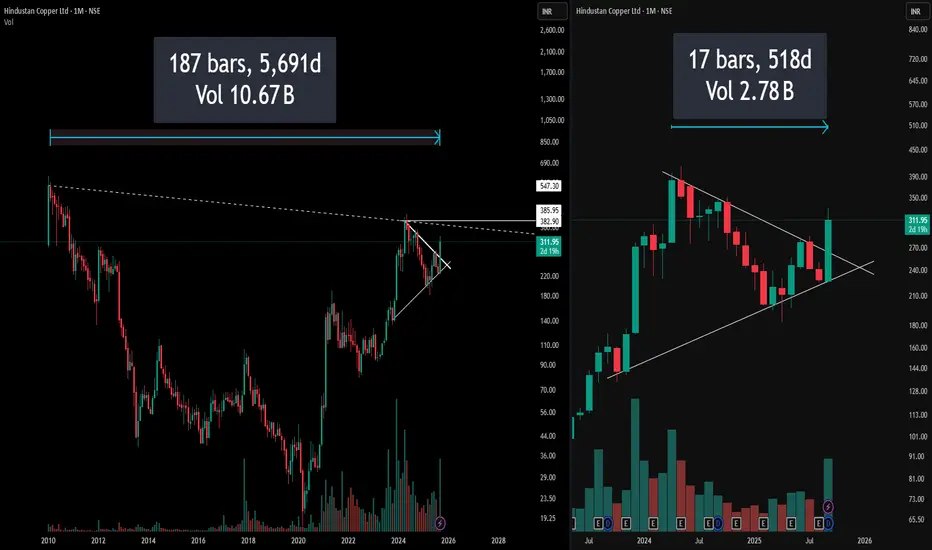
5000 Days vs 500 Days of Data : Which is better ?Most traders jump straight into attractive chart patterns and impulsively take trades, ignoring the bigger picture. Here’s a powerful case study
Left Side: Full Monthly Chart with Hidden Resistance
On the left, the chart captures over a decade of price action, immediately drawing attention to a long-standing downward-sloping resistance stretching from all-time highs. This hidden resistance line is not visible on the usual zoomed-in view, yet it presents a formidable barrier that traders often neglect.
(Pro Insight: Always extend trendlines and resistance zones till the inception of the instrument for real swing perspective)
(Risk Reminder: What looks like a clear breakout on a recent timeframe may actually be approaching a multi-year resistance trap)
Right Side: Symmetrical Triangle – The Pattern Focus
The right segment restricts focus to the last few years, zooming in on a visually perfect symmetrical triangle. While the setup looks neat and promising—indicating contraction and likely expansion ahead—this trimmed view risks obscuring the bigger, hidden resistance directly overhead.
Disclaimer: This post reflects technical views for educational purposes only, not investment advice. Always perform your own due diligence before trading.
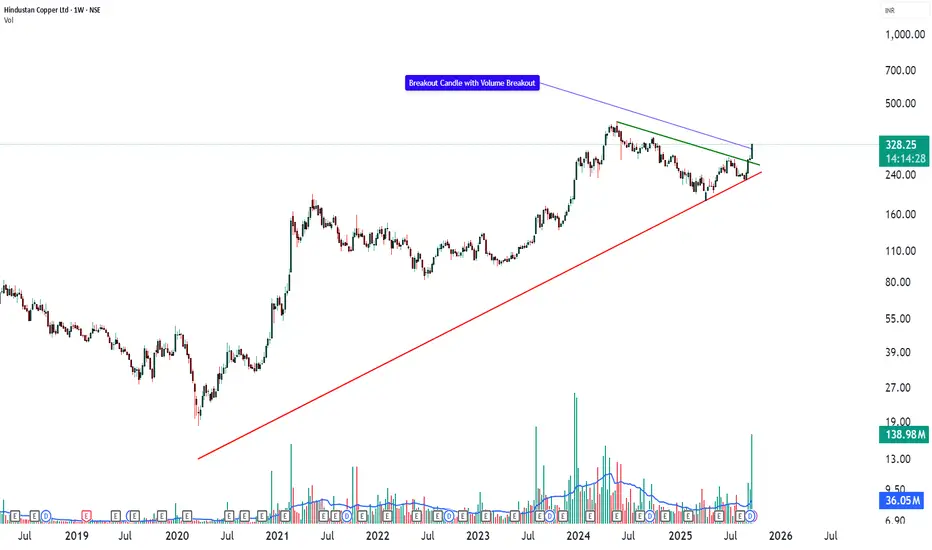
HINDCOPPER _ Multi-Year Triangle BreakoutHindustan Copper (HINDCOPPER) – Multi-Year Triangle Breakout with Educational Trade Analysis
Hindustan Copper Ltd. (CMP: ₹328) has delivered a decisive breakout on the weekly chart. The stock had been compressing within a multi-year symmetrical triangle formed by a rising trendline from the 2020 lows (red) and a descending resistance from the 2022 highs (green). The most recent candle shows a sharp +16% surge with strong volume, pushing price above the descending trendline and signaling a potential continuation of the long-term uptrend.
From a technical perspective, ₹250–260 remains a key support zone, while the next major resistance cluster lies near ₹400–420, which aligns with the measured-move projection from the triangle’s height. This price structure sets up an instructive case study in pattern breakouts for market participants.
Fundamentally, Hindustan Copper enjoys a unique monopoly as India’s only fully integrated copper producer, covering mining through to refined products. It commands a vast resource base of roughly 755 million tonnes of copper ore, providing decades of visibility. Management is working to ramp mining capacity from 4 MTPA to 12.2 MTPA, led by the historic Rakha mine restart and multiple underground expansions. FY25 was a landmark year with ₹2,071 crore revenue and ₹469 crore PAT, and Q1 FY26 has already delivered an ~18 % YoY PAT growth. The balance sheet is healthy and nearly debt-free, offering flexibility to fund expansion.
On the macro side, global copper demand is in a structural uptrend, driven by EV adoption, renewable energy installations, and power-grid upgrades. Supply disruptions at major global mines have tightened the market, creating a favorable price backdrop for Hindustan Copper.
📝 Educational Trade Analysis
For traders studying breakouts, this setup offers a clear example of blending chart structure with fundamental support. A typical learning plan could observe a hypothetical entry zone on a sustained close above ₹335–340, with illustrative targets near ₹400 and ₹450, which correspond to the pattern’s measured move. A protective stop for case-study purposes might be placed around ₹295, just below the breakout and the 50-week moving average.
These levels are for educational illustration only—not a recommendation to buy or sell.
This integrated perspective shows how a commodity-backed PSU with strong fundamentals and an expansion pipeline can align with a technically significant breakout, offering a valuable lesson in combining price action with fundamental drivers.
⚠️ Disclosure & Disclaimer – Please Read Carefully
I/we have no financial interest or position in Hindustan Copper at the time of writing.
The information shared here is meant purely for learning and awareness. It is not a buy or sell recommendation and should not be taken as investment advice. I am not a SEBI-registered investment adviser, and all views expressed are based on personal study, chart patterns, and publicly available market data.
Trading—whether in stocks or options—carries risk. Markets can move unexpectedly, and losses can sometimes exceed the money you have invested. Past performance or past setups do not guarantee future results.
If you are a beginner, treat this as a guide to understand how the market works and practice on paper trades before risking real money. If you are experienced, always assess your own risk, position sizing, and strategy suitability before entering trades.
Consult a SEBI-registered financial adviser before making any real trading decision. By engaging with this content, you acknowledge full responsibility for your trades and investments.
💬 Found this useful?
🔼 Give this post a Boost to help more traders discover clean, structured learning.
✍️ Drop your thoughts, questions, or setups in the comments — let’s grow together!
🔁 Share with fellow traders and beginners to spread awareness.
👉 “If you liked this breakdown, follow for more clean, structured setups with discipline at the core.”
🚀 Stay Calm. Stay Clean. Trade With Patience.
Trade Smart | Learn Zones | Be Self-Reliant 📊
Master Inside Bar Strategy with this Twist ( Wtf edition )Learn how to create a simple strategy and simply backtest it on Trading view .

HINDCOPPER H&S BREAKOUTHindcopper breaking H&S pattern weekly
huge volume this week with bullish rsi above 60
target1 375 target2 416
trading above all key ema
NO BUY/SELL RECOMENDATION

Hindustan Copper - LongHindustan Copper has recently shown strength by breaking above the 280 resistance zone with heavy volumes. This breakout is important as the stock was consolidating below this level for a long period, and now that resistance has turned into support. The overall trend since April has been upward, with price forming higher highs and higher lows, which is a classic sign of an uptrend.
From a volume perspective, the breakout candle is backed by one of the highest volumes in recent months. This suggests strong participation from big players and institutions, making the move more reliable compared to a low-volume breakout. Sustained high volumes on up-days further confirm demand at higher levels.
The price pattern also supports bullish sentiment. After a long consolidation phase between 240–280, the price has given a clean breakout, indicating that accumulation may have taken place and buyers are now in control. Such range breakouts often lead to extended rallies if supported by market sentiment.
Support is now placed at 280, with deeper support around 245. As long as the stock trades above these levels, the structure remains positive. On the upside, 330 is the first resistance and 360 is a major resistance zone to watch.
Trade plan: A buy-on-dips approach near 285–295 with a stop loss at 270 can be considered. Targets may be set at 330 and 360. If the stock fails to hold 270, it would signal weakness and the trade should be exited.
Disclaimer: This analysis is for educational purposes only and not a recommendation to buy or sell. Trading and investing in the stock market involve risks. Please do your own research or consult a financial advisor before making any trading decisions.

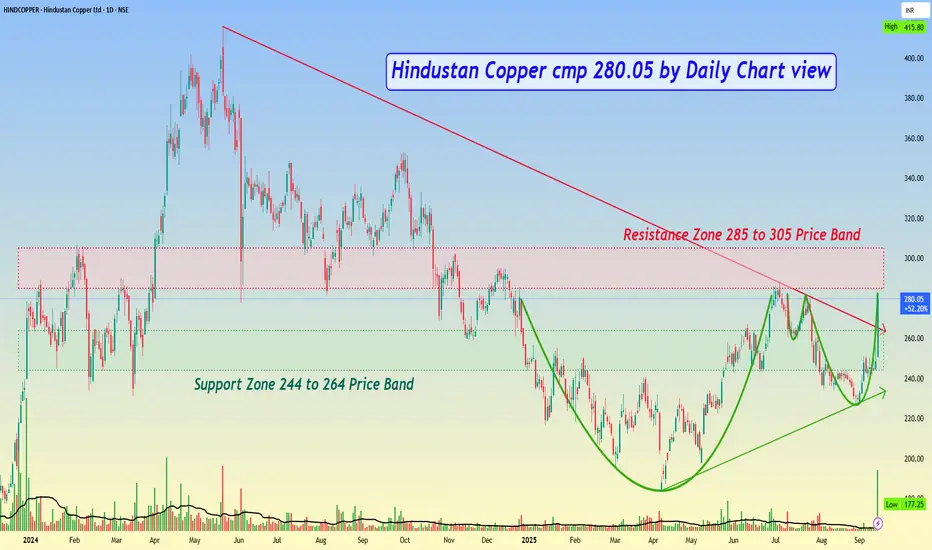
Hindustan Copper cmp 280.05 by Daily Chart viewHindustan Copper cmp 280.05 by Daily Chart view
- Support Zone 244 to 264 Price Band
- Resistance Zone 285 to 305 Price Band
- Huge Volumes surge by demand based buying
- Falling Resistance Trendline Breakout sustained closure
- Support Zone got well tested and retested over past few days
- Bullish Rounding Bottoms formed by the Resistance Zone neckline
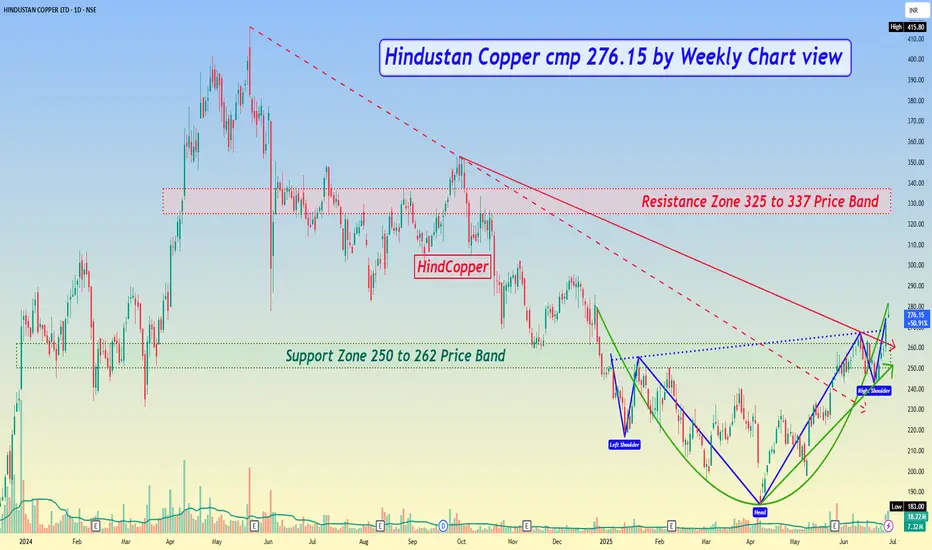
Hindustan Copper cmp 276.15 by Weekly Chart view*Hindustan Copper cmp 276.15 by Weekly Chart view*
- Support Zone 250 to 262 Price Band
- Resistance Zone 325 to 337 Price Band
- All major Technical indicators BB, EMA, MACD, RSI trending positively
- Stock is seen trending with positive momentum on Daily and Weekly Charts
- Rising Support Trendline respected with Falling Resistance Trendline Breakout
- Bullish Head & Shoulders pattern within Bullish Rounding Bottom seen completed
- Volumes are getting attractive and spiking heavily above the average traded quantity
- Stock seems to have tested and retested the Support Zone and attempting upwards momentum
HINDCOPPER | Supply-Demand Flip & Structure This chart shows a clean structural shift on the weekly timeframe for Hindustan Copper Ltd (NSE: HINDCOPPER):
🔷 Blue Zone: A key Supply-to-Demand Flip area. Price reacted strongly from this zone after multiple touches, showing its relevance.
📉 CT Line (Compression Trendline): Price was getting compressed under this trendline. It's now visibly breached.
➡️ Arrow Zone: Highlights a smaller supply-demand zone, formed after consolidation and breakout. Marked for structural clarity.
Volume also shows higher activity during this move, indicating strength behind the recent price action.

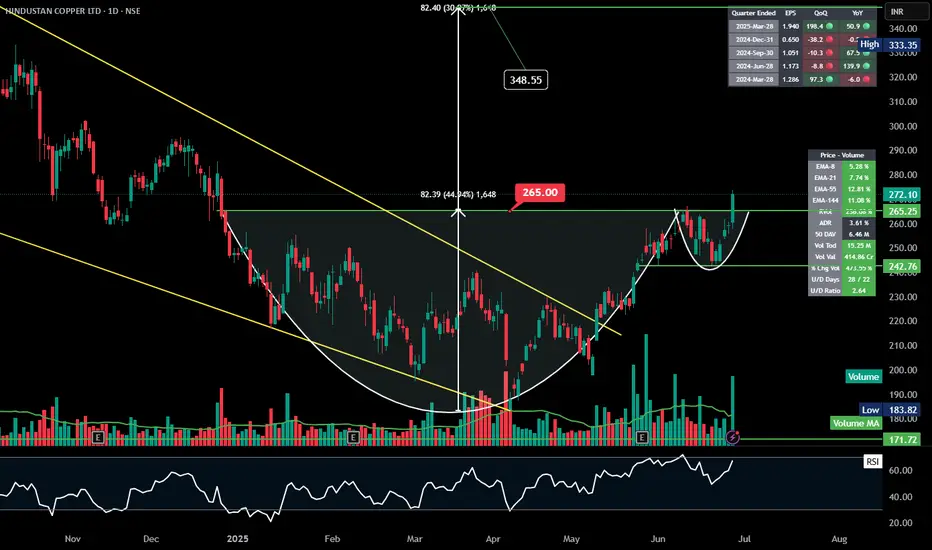
HINDCOPPER |CupandHandle Breakout! #HINDCOPPER - #CupandHandle Breakout!
Price breaks above ₹265 with strong volume
can test: ₹348.55 (+30.9%) Support - 265
EMAs stacked bullish, momentum building!
#StocksToWatch #Breakout #TechnicalAnalysis #NSE
COPPERHello & welcome to this analysis
Copper (MCX) is making a bullish Harmonic Seahorse breakout. A weekly close above 885 would activate it for a potential upside probable target of 1000. Post breakout if it slips below 700 the pattern will have become invalid.
Good risk reward set up currently for accumulation.
Stocks which could gain from increase in copper prices - Hind Copper, Hindalco & Vedanta.
Sectors which could get hammered from increase in copper prices since its a part of their raw material for manufacturing - White goods consumer durables manufactures, Electric cables and wire manufactures & Automobile manufacturers.
All the best

BUY HINDCOPPERBuy hindcopper as it is oversold stock, making inverted head and shoulder also ema crossover giving a strong buy signal.

Hindustan Copper cmp 262.70 by Weekly Chart view*Purely my point of view for the Technical Setup on the Stock Chart for a probable outcome*
Hindustan Copper cmp 262.70 by Weekly Chart view
- Stock seems weak on the Daily and Weekly Charts
- Support Zone at 255 to 260 Price Band, if broken may show up +/- 235
- Weekly basis Support at 229 > 185 > 151 with Resistance at 303 > 340 > 377
- Stock seems attempting to take reversal from Support Zone 255 to 260 Price Band
- Volumes are less attractive and needs to pump up by good numbers for fresh upside

metals are getting cold.metal stocks and index are not looking good for longs right now with global slowdown especially with china slowdown . any positive news from china for real estate sector will bring boost to metal prices.its not TA or FA but a opinion . avoid ferrous metal contracts/stocks . when time comes for long zinc/magnesium/coppper/aluminium are the ones that perform better than any other.
: just a educational guess and not a trading call for buy or sell.

Hindcopper - Monthly TimeframeHindcopper is consolidating since few months.
There is breakout above 420 and then we can see 500-600.
There is all time high breakout above 660, so it will touch to 1000.
Volume is increasing very slowly which is very good for the stock.
Good to buy on the dip.

Copper was once used to make dinars.is it in the game again ?its monthly chart so horizon should be 2/3 years to achieve all the targets.


HINDCOPPER Analysis & PredictionThis is the analysis of HINDCOPPER in Daily Time Frame. Watch carefully. The chart explains itself.
There are some prediction levels. These Levels act as Support and Resistance according to position of price. You have to trade according to level breakout or breakdown.
Always maintain your risk management.
Book your profit according to your “STOMACH”.
Disclaimer:
This is not investment advice. I am not a SEBI Registered Analyst. Anything posted here is my own analysis and views. This is created for educational purposes only. Always consult your Financial Advisor before taking any decision or trade.
Happy trading.
About HINDCOPPER :
Hindustan Copper Ltd. engages in the exploration, exploitation, and mining of copper and copper ore. Its products include cast copper rod, copper cathode, copper concentrate, copper sulphate, sulphuric acid, reverts, anode slime, and nickel hydroxide. The company was founded on November 9, 1967 and is headquartered in Kolkata, India.

Hindustan Copper Ltd - Breakout Setup, Move is ON...#HINDCOPPER trading above Resistance of 352
Next Resistance is at 413
Support is at 259
Here are previous charts:
Chart is self explanatory. Levels of breakout, possible up-moves (where stock may find resistances) and support (close below which, setup will be invalidated) are clearly defined.
Disclaimer: This is for demonstration and educational purpose only. This is not buying or selling recommendations. I am not SEBI registered. Please consult your financial advisor before taking any trade.
