HINDPETRO Price Action1. Trend Bullish
2. Structure - HH & HL
3. Set up - Pull back reversal
4. Price Trading at discount level
HINDPETRO

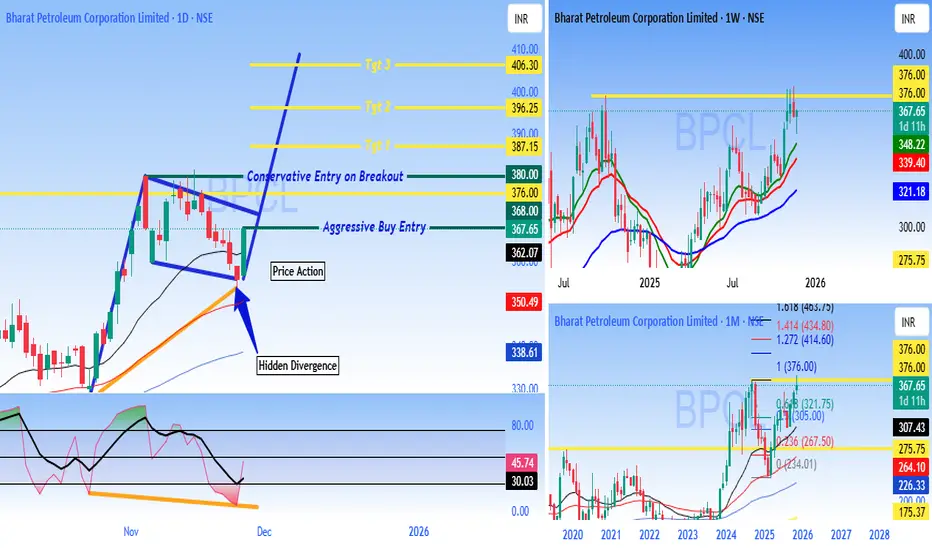
BPCL - Buy - ATH breakout - Technical Analysis#Bharat Petroleum Corporation Limited (BPCL) - #Technical Analysis Report
Current Price: 356.80 (Daily)
Multi-Timeframe Technical Analysis:
BPCL is displaying strong bullish momentum across multiple timeframes with a compelling technical setup featuring **Hidden Divergence** and a clear breakout structure on the daily chart.
Daily Chart Analysis - Key Technical Patterns:
1. Hidden Divergence Confirmed
- Classic Trend continuation signal indicating the uptrend is likely to resume with strength
2. Breakout Structure
- Stock has broken out from a consolidation zone around ₹362
- Currently trading above key resistance turned support
3. Trade Entry:
Aggressive Buy Entry:
As #Priceaction has formed already for traders who want immediate entry Buy will be active above 367.65
Conservative Entry on Breakout:
Initiate trades on candle close above 380
Price Targets
Target 1: 387.15
Target 2: 396.25
Target 3: 406.30
These targets are based on Fibonacci extensions and resistance zones from the pattern structure.
Weekly & Monthly Chart Context
Weekly Chart Shows:
- Strong uptrend since 2024 lows
- Stock trading near multi-year highs around 367-370 zone
- Higher highs and higher lows pattern intact
- Moving averages well-aligned in bullish configuration
Monthly Chart Indicates:
- Long-term recovery from 2020-2023 correction phase
- Breaking out from multi-year resistance zone
- Potential for extended rally toward ₹376-400 zone
Momentum Indicators
- Hidden divergence on daily timeframe = Bullish continuation
- Price action showing strength above key moving averages
- Volume expansion on breakout candles (positive sign)
- RSI/Momentum indicators supporting the upward move
The combination of bullish patterns and momentum indicators suggests potential for continuation toward higher targets. Traders should maintain strict risk management and adjust positions based on price action at key levels.
DISCLAIMER
This analysis is for educational and informational purposes only and should NOT be considered as investment advice or a recommendation to buy, sell, or hold any securities - I am NOT a SEBI registered analyst or investment advisor - This is purely a technical analysis based on chart patterns, indicators, and price action - Past performance and technical patterns do not guarantee future results - Trading and investing in stocks involves substantial risk of loss and may not be suitable for all investors - Always conduct your own research, due diligence, and analysis before making any investment decisions - Consult with a qualified financial advisor before taking any investment positions - The author/analyst holds no responsibility for any profits or losses incurred based on this analysis - Risk management is crucial - never invest more than you can afford to lose - Stop losses are mandatory for capital protection - Markets can remain irrational longer than you can remain solvent
Trade/Invest at your own risk. DYOR (Do Your Own Research).
#BPCL #TechnicalAnalysis #StockMarket #NSE #IndianStocks #Trading #HiddenDivergence #Breakout #OilAndGas #PSU #ChartAnalysis #TradingView #SwingTrading #DayTrading #PriceAction #StockTrading #MarketAnalysis #OMC #EnergyStocks #BullishSetup
HindPetro (M): Strongly Bullish, Breakout in ProgressThe stock has decisively broken out of a 10-month accumulation phase on high volume, signaling a potential new leg up. The bullish indicators are all aligned, and the focus now shifts to whether this breakout can be sustained.
📈 1. The Long-Term Context
- Consolidation Phase: The stock has been in a broad sideways trend since January 2024, building a large base.
- Key Resistance: A horizontal resistance line formed in September 2024 has acted as a "lid," rejecting all price advances for the past year.
- Drying Volume: volume has been "drying up" during this consolidation. This is a classic sign of seller exhaustion and accumulation by buyers.
🚀 2. The Decisive Breakout
- The Surge: In October, the stock finally broke this pattern with a decisive 7.35% surge.
- High-Conviction Volume: This move was backed by massive, high-conviction volume of 106.56 Million shares, confirming strong institutional interest and the validity of the breakout.
- The Close: Most importantly, the stock closed firmly above the horizontal resistance trendline , turning that old "lid" into a new potential "floor" (support).
📊 3. Key Technical Indicators
The underlying momentum supports this bullish move:
- EMAs: Short-term Exponential Moving Averages are in a "PCO" (Price Crossover) state, confirming strong, positive momentum.
- RSI: The Relative Strength Index (RSI) is rising, showing that buying strength is accelerating with the price.
🎯 4. Future Scenarios & Key Levels to Watch
⚠️ A Note of Caution
Instead of a "double-top," the key risk to watch for is a "fakeout" (or a "look above and fail"). Also watch for bearish divergence
🐂 The Bullish Case (Breakout Confirmation)
- Confirmation: The stock must now hold above the old resistance level (the breakout point). A successful retest of this level would be the strongest bullish confirmation.
- Target 1: ₹565
- Target 2: ₹700 (if upside momentum accelerates)
🐻 The Bearish Case (Breakout Failure)
- Trigger: If the current breakout is a "fakeout," the price will fail to hold and will drop back below the resistance line it just broke.
- Target: A failure here would likely see the stock fall to retest the immediate support level of ₹375.

Hindpetro - BreakoutHindpetro has given a breakout and ready to move up.
Good to buy and hold for the target level.
After big consolidation in the broadening wedge pattern, it's ready to give big movement.

Hindustan Petroleum Corporation Ltd - Breakout OpportunityDate : 26-Dec-2024
LTP : Rs. 419.30
Targets: (T1) Rs. 439 --> (T2) Rs. 457 --> (T3) Rs. 520
SL : Rs. 388
Technical View:
• NSE:HINDPETRO is in primary uptrend and was recently going through secondary downtrend within primary uptrend.
• After touching a high of 457.15 on 5-Sep-2024, it has retraced 22% to 354.90 level.
• NSE:HINDPETRO has breakout from it's secondary downtrend with higher than average volume on 26-Dec-2024.
• NSE:HINDPETRO is trading above 20 DEMA and 50 DEMA since last few sessions. 20 DEMA has also crossed over 50 DEMA.
• RSI is trading at 63.98 and MACD is trading at 6.66.
• Looking strong to start a new swing from here.
Liked the analysis? Boost/Like this idea and follow my ID for more ideas.
Disclaimer: I am not a SEBI registered analyst/consultant and not recommending anyone to take any BUY or SELL position in stock market. Investing in stock market is risky and one should do a self analysis and validation before investing in stock market. My ideas are published for learning purpose only and are available to everyone at no cost/charge.

HINDUSTAN PETROLEUM By KRS ChartsDate: 21st Aug 2024
Time: 1:34 PM
Why HINDPETRO?
1. All over its a Bullish Stock with Good Fundamentals.
2. Recently made Flag Pattern and broke it as we can see in Chart ⬆️
3. Also, something is not visible in chart is Cup & Handle Pattern in Weekly and Monthly TFs.
1st Target will be 525 Rs with SL of 375 Rs from CMP.

Morning Star at several Fib clusters in HINDPETRO Wave C of Flat correction has fulfilled the rule of equality (Wave A and Wave C are equal).
There is also a Fib level of fib retracement of the previous impulse at this level.
We can also see the Morning Star pattern forming at this cluster.
This suggests a high probability of a buy trade in HINDPETRO .
Stop-loss for this trade can be put below 61.8%, i.e., around 360 level.
This analysis is for educational purposes only.

Candlestick Pattern: HindpetroPattern:- Evening Star.
Result:- Indicaton of Bearish sentiment.
Entry:- Breakout of the low of the current candle (below 432)
Pro tip:- Wait for a breakout of the range 432-430 for the entry.
Target:- 408, 402
SL:- 439
Prices in spot

Hind Petro Breakout & Retest PatternHello Traders,
Hindustan Petroleum has Started rising again & given the breakout above the 415 retest zone.
Plan out for a swing trade.
Boollinger Band Expansion on hourly chart with volumes, can give better targets.
Educational Purpose only
Thank you
Prince

Hindpetro Breaks Out on Daily Chart: Bullish Momentum AheadHindpetro's bullish breakout on the daily chart suggests strong upward momentum and the potential for further gains. Traders may look to capitalize on this opportunity by entering on confirmation of the breakout, targeting higher resistance levels while keeping an eye on the previous resistance as a new support zone.

Swing Trade - HINDPETRO📊 Script: HINDPETRO
📊 Sector: Refineries
📊 Industry: Refineries
Key highlights: 💡⚡
📈 Script is trading at upper band of BB.
📈 MACD is giving crossover .
📈 Double Moving Averages are giving crossover.
📈 Right now RSI is around 68.
📈 One can go for Swing Trade.
⏱️ C.M.P 📑💰- 407
🟢 Target 🎯🏆 - 432
⚠️ Stoploss ☠️🚫 - 393
⚠️ Important: Always maintain your Risk & Reward Ratio.
✅Like and follow to never miss a new idea!✅
Disclaimer: I am not SEBI Registered Advisor. My posts are purely for training and educational purposes.
Eat🍜 Sleep😴 TradingView📈 Repeat 🔁
Happy learning with trading. Cheers!🥂

#HindpetroHindpetro also similar line like BPCL
HIndpetro BAMM Active B point crucial now
If red line broken then fall will be there till D point
D point is good investment pick
Sharing this idea only for educational purpose

MACD Crossover Swing Trade - HINDPETRO📊 Script: HINDPETRO
📊 Sector: Refineries
📊 Industry: Refineries
⏱️ C.M.P 📑💰- 350
🟢 Target 🎯🏆- 371
⚠️ Stoploss ☠️🚫 - 341
⚠️ Important: Always maintain your Risk & Reward Ratio.
✅Like and follow to never miss a new idea!✅
Disclaimer: I am not SEBI Registered Advisor. My posts are purely for training and educational purposes.
Eat🍜 Sleep😴 TradingView📈 Repeat 🔁
Happy learning with trading. Cheers!🥂

HINDPETRO - Swing Trade Analysis - 11th April #stocksHINDPETRO (1W TF) - Swing Trade Analysis given on 11th April, 2024
Pattern: FALLING WEDGE BREAKOUT
- Trendline Resistance Breakout - Done ✓
- Volume buildup at Resistance - In Progress
- Demand Zone Retest & Consolidation - In Progress
#hindpetro #niftyenergy

Keep An Eye - Triple Bottom - HINDPETRO📊 Script: HINDPETRO
📊 Sector: Refineries
📊 Industry: Refineries
Key highlights: 💡⚡
📈 Script is forming Triple Bottom on Weekly Chart, it has given breakout once and again it retested.
📈 Script is trading near neck line of Triple Bottom which is around 492.
📈 Keep an eye on stock, we may see breakout of it and some good rally into the stock.
📈 One can go for Swing Trade.
⏱️ C.M.P 📑💰- 492
🟢 Target 🎯🏆 - 534/555
⚠️ Important: Always maintain your Risk & Reward Ratio.
✅Like and follow to never miss a new idea!✅
Disclaimer: I am not SEBI Registered Advisor. My posts are purely for training and educational purposes.
Eat🍜 Sleep😴 TradingView📈 Repeat 🔁
Happy learning with trading. Cheers!🥂

HINDPETRO Good to StudyNSE:HINDPETRO
Good to keep on the radar
Always respect SL & position sizing
Expecting good strength above 503
========================
Trade Secrets By Pratik
========================
Disclaimer
SEBI UNREGISTERED
This is our personal view and this analysis
is only for educational purposes
Please consult your advisor before
investing or trading
You are solely responsible for any decisions
you take on basis of our research.

HINDPETRO Analysis(Symmetric Triangle)!Two methods to project the Targets while trading based on SYMMETRIC TRIANGLE PATTERN
HINDPETRO Analysis on Weekly Timeframe!
Symmetric Triangle formation in HINDPETRO on Weekly Timeframe
Symmetric Triangle Resistance Trendline Breakout
HINDPETRO has made symmetric Triangle pattern on Weekly Timeframe. HINDPETRO is forming Symmetric Triangle Pattern about 6 months. The price has given resistance trendline breakout with low volume which is a negative point but is has made successfully closed above it. On the chart I have illustrated, how to project targets based on SYMMETRIC TRIANGLE PATTERN in two ways. You can follow any method while dealing with Symmetric Triangle Pattern. Both ways are valid. I have referred John J Murphy's TECHNICAL ANALYSIS OF THE FINANCIAL MARKETS book for this Analysis. I hope you'll like it. One more important thing do Follow and share my ideas for support so I can post more and more ideas on daily basis.
Trade Psychology and Setup =
Entry = Aggressive Investors can enter at current levels, Conservative Investors can enter after retest between 239.80 - 243.15
Target = 505.30
Stop Loss = Below 220.10
Disclaimer = All my analysis are for Educational Purpose only. Before entering into any trade - 1) Educate Yourself 2) Do your own research and analysis 3) Define your Risk to Reward ratio 4)Don't trade with full capital

hindustan petrolfib Retracement tgt was around Rs.575 acc to stock retraced above Rs.500 levels...next tgt Rs. 630 in next few months..

HINDPETROPole and pennant pattern however still a move to lower edge is possible.
It may still be very slow so don't expect result in near term

Hindpetro Ready TO ROAR...50%Hindustan Petroleum Corporation Ltd is mainly engaged in the business of refining of crude oil and marketing of petroleum products, production of hydrocarbons as well as providing services for management of E&P Blocks.
- Stock is trading at 0.96 times its book value.
- Stock P/E 2.63
- Running on Lowest P/E ever.
- sept. quater net profit nearly 6000cr, 2nd highest quaterly net profit.
-Good financial stock may be double ,tripple in next 1,2 year.

HINDPETRO | Swing Trade📊 Details
Hindustan Petroleum Corporation Ltd is mainly engaged in the business of refining of crude oil and marketing of petroleum products, production of hydrocarbons as well as providing services for management of E&P Blocks.
Disclaimer: This analysis is solely for educational purposes and does not make me a SEBI registered analyst.
If you found this analysis helpful, I encourage you to like and share it. Your observations and comments are also welcomed below. Your support, likes, follows, and comments motivate me to consistently share valuable insights with you.
🔍 More Analysis & Trade Setups 🔍
For more technical analysis and trade setups, make sure to follow me on TradingView: www.tradingview.com

HINDPETRO go longIf the price croses 267.95
Entry Price : 268
Stop loss : 246.15
Target: 308 , 309, 310

impulse wave in HINDUSTAN PETRO. Alternative wave.Elliott Wave Analysis:-
Both correction and impulse wave we are expecting a correction.
once correction get ended an impulse take place.
View 1:-
There is also expected an impulse wave i) completed and a correction wave ii) was almost over if raise start then impulse wave iii) is expected to move on.
View2:-
Correction wave was still pending and a low was expected.
once the low was completed then the impulse wave of v wave was expected .
I'm not a SEBI registered advisor.
Kindly consult your financial advisor.
