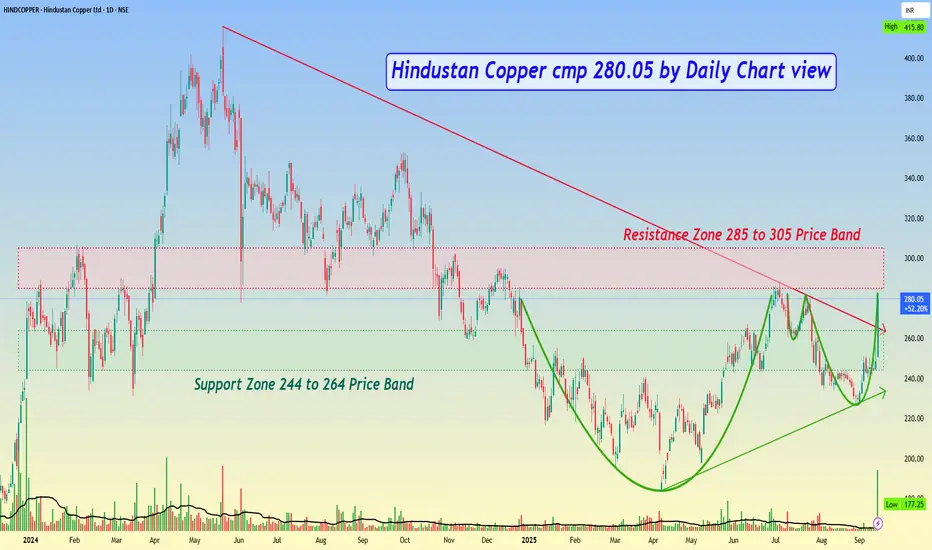
Hindustan Copper cmp 280.05 by Daily Chart viewHindustan Copper cmp 280.05 by Daily Chart view
- Support Zone 244 to 264 Price Band
- Resistance Zone 285 to 305 Price Band
- Huge Volumes surge by demand based buying
- Falling Resistance Trendline Breakout sustained closure
- Support Zone got well tested and retested over past few days
- Bullish Rounding Bottoms formed by the Resistance Zone neckline
Hindustancopperltd
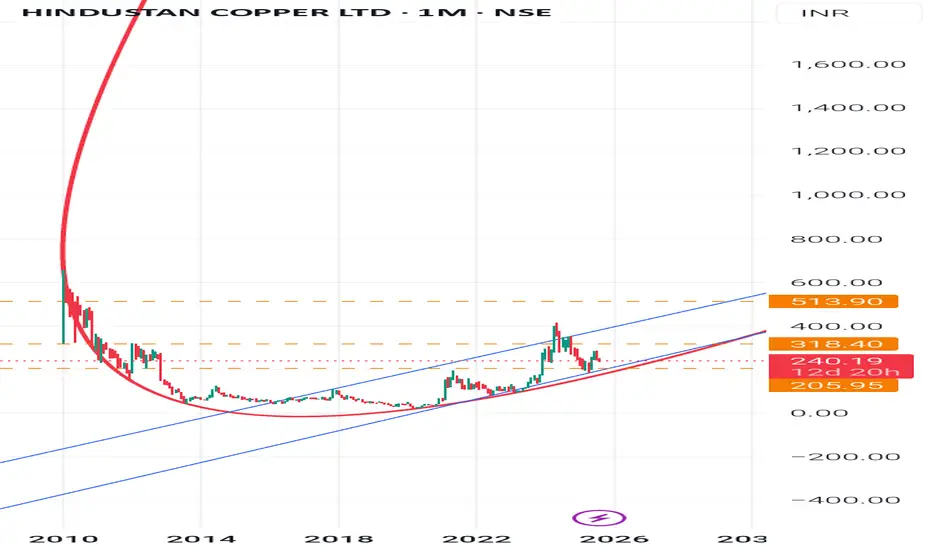
Hindustan copper Trend AnalysisHindustan Copper (HINDCOPPER) - Monthly Chart : Trend Analysis-
Long-term Trend: Strong uptrend since 2020, visible with higher highs and higher lows.
Current Position: After a sharp rally to 414, the stock corrected and is now consolidating around 280.
200-Month MA (red curve): Acts as a strong long-term support trendline.
Chart Pattern👉
Cup & Handle Formation: The stock formed a long cup (2010-2020) and has broken out. Now it is forming a handle/consolidation phase.
Rising Channel: Price is moving inside an upward channel (blue lines).
Support Levels
1. 240 - Strong immediate support (monthly close basis).
2. 205 - Next strong support (channel + trendline confluence).
3. 165- Major base (only if bigger correction comes).
📈 Resistance Levels
1. 318- First hurdle (recent swing high).
2. 414- Previous top, very important resistance.
3. 513- Long-term target zone shown on your chart.
🚀 Next Big Leap🎯
If stock sustains above 318, momentum buying can take it back toward 414.
A monthly close above 414 will confirm a fresh breakout, next big target opens to 513-550 zone.
In the longer run (2-3 years), if 513 is crossed and sustained, stock could head towards 750+.
Risk Note:
Below 240 on monthly close- weakness.
Below 205- trend reversal risk (long-term investors must watch this level closely).
Summary:
Hindustan Copper is in a long-term bullish structure. It is currently consolidating in a handle phase between 240-318. A breakout above 318 can lead to a retest of 414, and then a big move towards 513+. Long-term investors should stay put as long as 205 support holds.
Disclaimer-
This analysis is only for educational and learning purposes.
It is not an investment or trading advice.
Stock market investing is risky- please consult a SEBI-registered financial advisor before making any decisions.
#StockMarket #TechnicalAnalysis #PriceAction
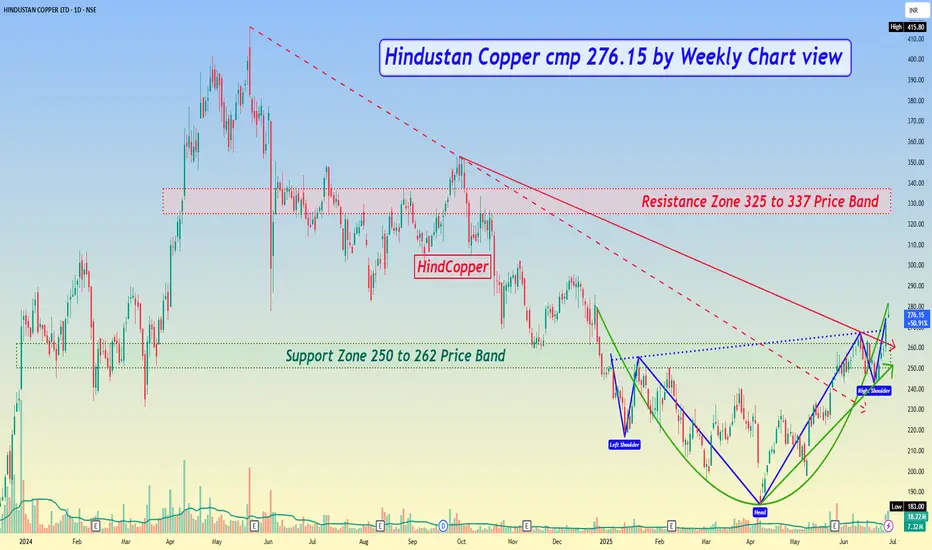
Hindustan Copper cmp 276.15 by Weekly Chart view*Hindustan Copper cmp 276.15 by Weekly Chart view*
- Support Zone 250 to 262 Price Band
- Resistance Zone 325 to 337 Price Band
- All major Technical indicators BB, EMA, MACD, RSI trending positively
- Stock is seen trending with positive momentum on Daily and Weekly Charts
- Rising Support Trendline respected with Falling Resistance Trendline Breakout
- Bullish Head & Shoulders pattern within Bullish Rounding Bottom seen completed
- Volumes are getting attractive and spiking heavily above the average traded quantity
- Stock seems to have tested and retested the Support Zone and attempting upwards momentum
Hindustan Copper cmp 262.70 by Weekly Chart view*Purely my point of view for the Technical Setup on the Stock Chart for a probable outcome*
Hindustan Copper cmp 262.70 by Weekly Chart view
- Stock seems weak on the Daily and Weekly Charts
- Support Zone at 255 to 260 Price Band, if broken may show up +/- 235
- Weekly basis Support at 229 > 185 > 151 with Resistance at 303 > 340 > 377
- Stock seems attempting to take reversal from Support Zone 255 to 260 Price Band
- Volumes are less attractive and needs to pump up by good numbers for fresh upside
