BUY TODAY SELL TOMORROW for 5%DON’T HAVE TIME TO MANAGE YOUR TRADES?
- Take BTST trades at 3:25 pm every day
- Try to exit by taking 4-7% profit of each trade
- SL can also be maintained as closing below the low of the breakout candle
Now, why do I prefer BTST over swing trades? The primary reason is that I have observed that 90% of the stocks give most of the movement in just 1-2 days and the rest of the time they either consolidate or fall
Resistance Breakout in HINDZINC
BUY TODAY SELL TOMORROW for 5%
HINDZINC

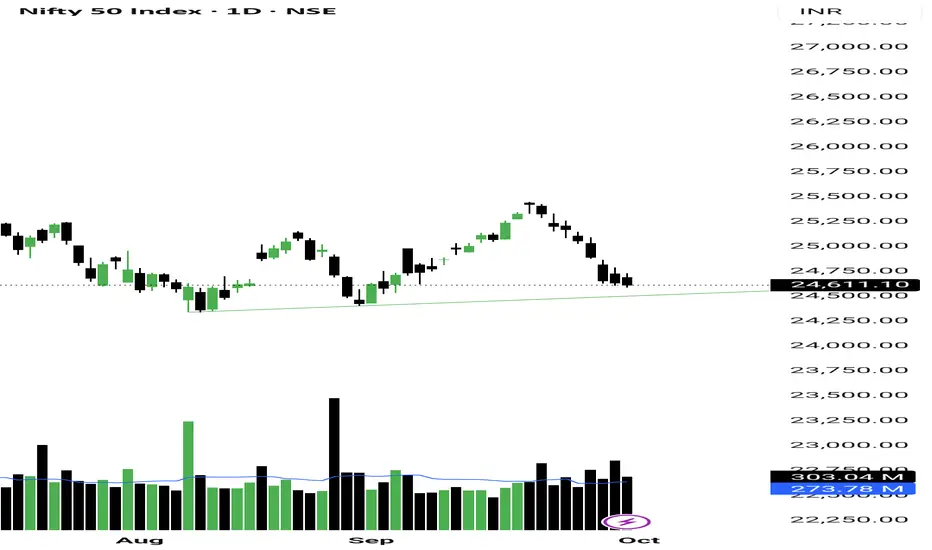
Accumulation in Nifty seen again! This is the 2nd straight session where NSE:NIFTY price closed below the day low but buyers’ volume was higher.
Red candle + green volume = a clear institutional accumulation footprint.
On top of that, the retailers index is going down, which confirms the view even more.
Normally, after yesterday’s strong buyers’ volume, we should have seen a bounce in the index today. But thanks to the weekly + monthly expiry, price was suppressed.
That suppression means one thing – the market can pop out anytime.
Remember the 3-step process I shared before:
1. Accumulation
2. Manipulation
3. Distribution (uptrend)
Right now we’re in the accumulation phase. A manipulation phase cannot be ruled out – it could come as a direct drop or a bounce with sell-on-rise characteristics. So, watch closely over the next 2–3 days.
Personally, I think from next week we’ll enter the 3rd phase – distribution or simply, the uptrend. Until then, accumulating dips whenever buyers’ volume is up is the right strategy. That’s exactly what I’m doing.
Now for tomorrow:
– Pivot is at 24644, PP is 0.13%
– If index opens above the pivot and holds on the hourly chart, we can see a sharp move to 24760 / 24880
– Downside support is at 24570
Sector-wise, PSU Banks and Metals are looking strong.
I’m holding NSE:HINDZINC and added NSE:REDINGTON today. I won’t be adding more until market breadth improves.
That’s all for today. Take care. Have a profitable tomorrow.
---
📊 Levels at a glance:
Pivot: 24644
Support: 24570
Resistance 1: 24760
Resistance 2: 24880
Pivot Percentile: 0.13% (sharp move possible)
Bias: Accumulation phase, buy dips on buyers’ volume uptick
Sectors to watch: NSE:CNXPSUBANK , NSE:CNXMETAL
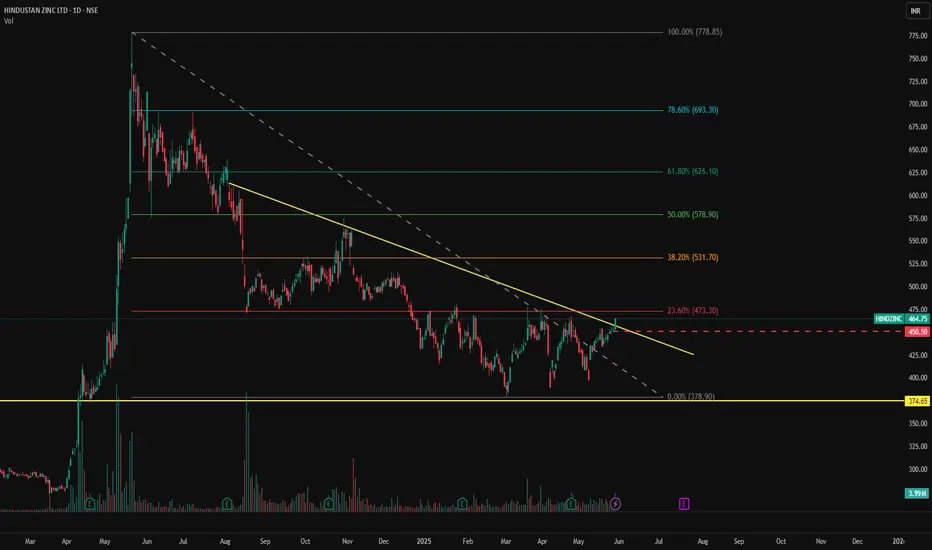
HINDZINC - NSE | Daily Chart Analysis📊 HINDUSTAN ZINC LTD (HINDZINC) – NSE | Daily Chart Analysis
📅 Date: May 30, 2025
📈 CMP: ₹464.75 (+2.68%)
📌 Ticker: NSE:HINDZINC
🧠 Technical Breakdown
🟢 Descending Trendline Breakout 🟢
The stock is showing early signs of strength as it approaches the apex of a long-term descending trendline. Price action is attempting a trendline breakout from a nearly year-long downtrend, suggesting the possibility of a bullish reversal.
🔍 Volume Confirmation
Steady volume buildup over the past few sessions, potentially indicating accumulation ahead of a confirmed breakout.
📉 Well-Defined Support
₹374.65 has acted as a strong demand zone on multiple occasions, offering a solid base for the current move.
📍 Key Price Levels
🔺 Resistance (Trendline Breakout Zone): ₹465
🔻 Major Support: ₹374.65
🎯 Upside Targets (on breakout):
₹500
₹535
₹575+
🛡️ Stop Loss: Below ₹440 (on breakout failure)
📌 Trading Strategy
Aggressive Entry: On breakout + closing above ₹465 with volume surge
Conservative Entry: Retest of trendline post-breakout
SL: ₹440
Target Zone: ₹500–₹575
⚠️ Disclaimer
This post is for educational purposes only and does not constitute financial advice. Always conduct your own analysis or consult a financial advisor before investing.
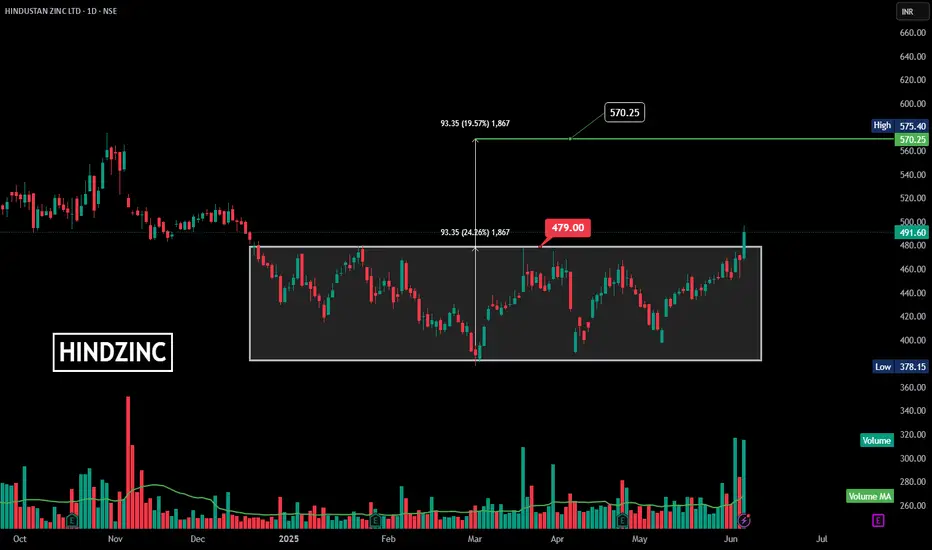
HINDZINC | Rectangular Consolidation | Breakout | DailyHere’s a detailed **technical summary and analysis** of the Hindustan Zinc Ltd. (HINDZINC) chart you shared:
---
### **Chart Pattern & Setup:**
✅ **Rectangular Consolidation / Range Breakout:**
* The stock has been trading within a range (rectangle) from approximately **378.15 (low)** to **479.00 (resistance)** for several months (since December 2024).
* This consolidation pattern signifies **accumulation**.
✅ **Breakout:**
* Price action has decisively broken out of the **rectangle’s upper boundary at 479.00 INR**.
* **Current price:** 491.60 INR, showing bullish momentum.
---
### **Measured Move & Target:**
* The height of the range (rectangle) is **93.35 INR** (24.26% move).
* **Target Calculation:**
$\text{Breakout Level (479)} + \text{Height (93.35)} = \approx \textbf{570.25 INR}$.
* Immediate resistance level is around 570-575 INR.
---
### **Volume Analysis:**
✅ A **significant spike in volume** confirms the breakout, validating the buying interest.
✅ The **Volume MA line** is also trending up, showing sustained interest.
---
### **Key Levels:**
* **Resistance (Breakout level):** 479.00 INR
* **Target:** 570.25 INR
* **Current Price:** 491.60 INR
* **Immediate support:** 479.00 INR
* **Low support:** 378.15 INR
---
### **Conclusion & Trade Idea:**
This breakout from a **rectangle consolidation** is a strong bullish signal, especially with the volume confirmation. If the price sustains above 479 INR, the next likely target is **570-575 INR**.
---
Would you like me to:
✅ Create a YouTube video title and description with these details?
✅ Suggest a possible trading plan or risk management idea?
✅ Generate hashtags for maximum YouTube SEO visibility?
Let me know! 🚀✨
HINDZINC HINDZINC has given trendline breakout with very good volume. On upperside it may face resistance near 540-45 level and lower side support can be seen near 455 levels. It has given breakout on weekly as well and seems momentum may continue. Risk reward is quite in favor.

HINDZINCApproaching descending trendline, can be a good breakout candidate. RSI has bullish divergence.

metals are getting cold.metal stocks and index are not looking good for longs right now with global slowdown especially with china slowdown . any positive news from china for real estate sector will bring boost to metal prices.its not TA or FA but a opinion . avoid ferrous metal contracts/stocks . when time comes for long zinc/magnesium/coppper/aluminium are the ones that perform better than any other.
: just a educational guess and not a trading call for buy or sell.

HINDUSTAN ZINC POSSIBLE ELLOIT WAVE COUNTSHINDUSTAN ZINC LTD after so many year of consolidation have shown huge volume and workout from 300 to almost 900 there after it come to retracement in range of 480 to 500.
Breakout with huge volume and future prospects and vision of company it may reach target's as shown in chart analysis.

Hindzinc- Do not miss this multiyear consolidation breakout!Hindustan zinc has given big breakout of inverted head and shoulders pattern in monthly time frame. A monthly closing above 330 would confirm the same.
This breakout is mainly because of the shooting zinc prices and growing war tensions.
350-370 is the best price to accumulate the stock.
The volumes are also at multi year high.
If you trust anil agrawal's vision and are a dynamic investor, do not miss this stock in your portfolio for potential multibagger returns.

Golden Crossover - HINDZINC📊 Script: HINDZINC
📊 Sector: Non Ferrous Metals
📊 Industry: Mining / Minerals / Metals
Key highlights: 💡⚡
📈 Golden Crossovers are seen into the Script.
📈 Golden Crossover is where slow moving average line crosses fast moving average above.
📈 Although Script is trading at All Time High we may see some bullish rally.
⏱️ C.M.P 📑💰- 431
⚠️ Important: Always maintain your Risk & Reward Ratio.
✅Like and follow to never miss a new idea!✅
Disclaimer: I am not SEBI Registered Advisor. My posts are purely for training and educational purposes.
Eat🍜 Sleep😴 TradingView📈 Repeat 🔁
Happy learning with trading. Cheers!🥂

HINDZINC | Swing Trade📊 Details
Incorporated in 1966, Hindustan Zinc has a rich experience of more than five decades in Zinc- lead mining and smelting.
Ranked #1 in the Metals and Mining Category in Asia Pacific in Dow Jones Sustainability Index 2019, HZL is one of the lowest cost producers of zinc globally and it is India's Only Integrated producer of Zinc, Lead, Silver.
Disclaimer: This analysis is solely for educational purposes and does not make me a SEBI registered analyst.
If you found this analysis helpful, I encourage you to like and share it. Your observations and comments are also welcomed below. Your support, likes, follows, and comments motivate me to consistently share valuable insights with you.
🔍 More Analysis & Trade Setups 🔍
For more technical analysis and trade setups, make sure to follow me on TradingView: www.tradingview.com

HINDUSTAN ZINC - DAY CHART - 02.02.2023 - BAHAVAN CAPITALHINDUSTAN ZINC as per day chart analysis
Stock ABOVE 350 TARGET 360
Happy Profitable Trading to All...

Hindustan Zinc on a 4 month support lineStock is on a 4 month strong support line. Can move up from here to 375 levels. Expecting a good up move in coming days.

HINDUSTAN ZINC - CHART ANALYSIS - 11.01.2023 - BAHAVAN CAPITALHINDUSTAN ZINC as per day chart analysis
Stock ABOVE 345 TARGET 350
Once again FII Net selling had increased today at 2109.34 Cr and FII Net buying was at 1806.62 Cr.
From Jan 2nd - Jan 10th in these 7 trading sessions alone FII Net selling at 10125.91 Cr and DII Net Buying at 6286.99 Cr.
Bank Nifty looks weak with support at 41569 / 41295.
Nifty looks weak with Support at 17771
Happy Profitable Trading to all...

Long HINDZINCHindzinc chart is looking good for higher high highe low formation wave pattern. It may reach 365 zone
SL below Brekaout retest zone

HINDUSTAN ZINC - DAY CHART - 01.12.2022 - BAHAVAN CAPITALHINDUSTAN ZINC Posted 29.11.2022 Stock ABOVE 304 TARGET 309. Today Stock made a High of 309 and closing at 307.
Target hit
Happy Profitable Trading to all..

hindhindzinc upar jane ko ready ho raha hai qki daily time pe invert head & shoulder form ho rha hai

Hindzinc long (11 Nov)Hindzinc long (11 Nov)
RSI- 65
Since May stock facing resistance at 200 day EMA
Buy at CMP - 294
SL- 283
Target- 325, 345, 367
Join us, Learn more, Earn more
Disclaimer- We are not SEBI registered advisor.
Charts and views are only for educational purpose.

Hindzinc long (13 Oct)Hindzinc long (13 Oct)
RSI- 57
Inverse Head & Shoulders pattern
Buy at CMP - 289
SL- 278
Target- 335, 350, 370
Join us, Learn more, Earn more
Disclaimer- We are not SEBI registered advisor.
Charts and views are only for educational purpose.


HINDZINC Trend and Fundamental AnalysisFundamental Analysis:
1) Segment - Zinc- lead mining and smelting
2) PE -11.1
3) Debt to Equity - 0.08(Promoter pledged 85% of share)
4) ROE -28
5) Sales Doubles in last three years
Trend:
unable to close( monthly TF) above the previous swing high ( lot of rejection)
Rejection from level of 1.236 level of FIB.
Two possibility from this level
option 1: Since it took a support from trend line , It can move higher from this level
Stop loss- 245
Target -415
Option 2:
It make break the trend line and move downward
Target -218(0.5 level of Fib)

HINDZINC bagged 10%, check for fresh entry levels !! NSE:HINDZINC
#NSE:HINDZINC shared with entry level @ 327 and made high of 356 = 29 Points.
Fresh entry may possible with SL @ 346.
**Only for Practice.
Happy LEarning !!

