Learn from the Charts: Educational Stock Watchlist (Aug 29, 2025Here’s today’s carefully selected Watchlist of Stocks. Each stock has been shortlisted based on its chart structure, indicators, and candlestick behavior. These are not trade tips — the goal is to help you learn how to analyze live setups.
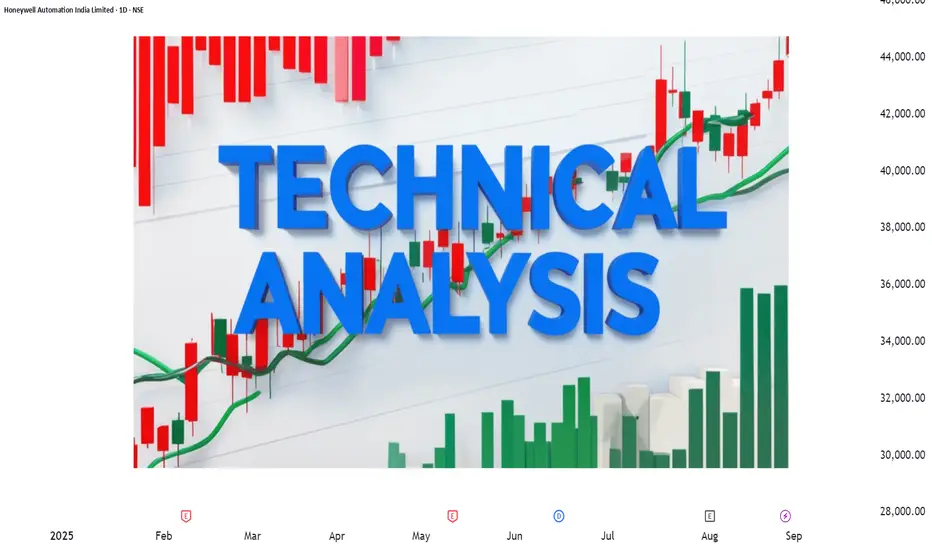
🔹 HONAUT (Honeywell Automation)
💼 Industrial Automation Leader
About: A leader in industrial automation and engineering solutions, known for stable long-term growth.
Technicals: The stock shows strong bullish momentum with high volume participation. RSI and Stochastic confirm strength, while candlesticks are forming higher highs and higher lows.
👉 Why Track This? Excellent case study to see how large-cap, fundamentally strong companies sustain momentum rallies. It will help you understand the role of volume confirmation in bullish breakouts.
🔹 ASTRAZEN (AstraZeneca Pharma)
💼 Global Pharma Giant
About: A global pharma major focused on medicines for oncology and chronic diseases.
Technicals: The stock is showing short-term bearish pressure with MACD and CCI negative, though volumes remain high. Candles are showing signs of volatility and possible reversal attempts.
👉 Why Track This? Great learning to watch how heavy volumes can precede potential reversals even in weak phases. Pharma stocks often give sharp swings — observing this helps in spotting bottoming-out patterns.
🔹 WAAREE ENER (Waaree Energies)
💼 Renewable Energy – Solar Solutions
About: A key player in renewable energy, specializing in solar PV modules and solutions.
Technicals: The stock is in strong bullish momentum. RSI is in overbought territory, CCI also signals strength, and candlesticks point toward continuation of trend.
👉 Why Track This? Perfect example of how high-momentum renewable stocks can keep trending despite overbought indicators. A good study for understanding extended rallies in growth sectors.
🔹 JUBILANT CPH (Jubilant Pharmova)
💼 Diversified Pharma
About: Diversified pharma and life sciences company.
Technicals: High momentum stock but currently undergoing a bearish phase. Charts show lower highs forming, and candlesticks suggest pullbacks.
👉 Why Track This? Useful for studying retracements within otherwise strong momentum stocks. This teaches how to differentiate between temporary corrections and deeper reversals.
🔹 CAPLIPOINT (Caplin Point Laboratories)
💼 Fast-Growing Export Pharma
About: A fast-growing pharma company with strong presence in exports.
Technicals: Stock is trending bullish with low risk. Indicators are supportive, and candlesticks are showing higher lows, confirming accumulation.
👉 Why Track This? A good case study for observing how a stock consolidates before making higher moves. Helps you understand the concept of “low-risk bullish entries” on charts.
🔹 MALLCOM
💼 Safety Gear Manufacturer
About: Manufacturer of industrial safety gear and protective equipment.
Technicals: Despite strong past moves, momentum has turned bearish. Charts show indecision with candles testing support levels.
👉 Why Track This? Great example to learn how indecisive candlestick patterns (dojis, small-bodied candles) can signal either breakdowns or reversals. Watching closely here will help you understand market psychology.
🔹 TTKHLTCARE (TTK Healthcare)
💼 Healthcare & Consumer Products
About: A diversified healthcare and consumer products company.
Technicals: Bullish momentum with low risk. RSI and MACD are supportive, and candles show steady accumulation.
👉 Why Track This? A classic case to learn how accumulation patterns look before bigger price movements. Tracking this will build your ability to spot early entry setups.
📊 Each of these stocks showcases different market phases — strong rallies, corrections, consolidations, and reversal attempts. Observing them today will sharpen your technical analysis skills.
Happy Learning & Observing,
STWP
⚠️ Disclaimer – Please Read Carefully
The information shared here is meant purely for learning and awareness. It is not a buy or sell recommendation and should not be taken as investment advice. I am not a SEBI-registered investment advisor, and all views expressed are based on personal study, chart patterns, and publicly available market data.
Trading — whether in stocks or options — carries risk. Markets can move unexpectedly, and losses can sometimes exceed the money you have invested. Past performance or past setups do not guarantee future results.
If you are a beginner, treat this as a guide to understand how the market works — practice on paper trades before risking real money. If you are experienced, always assess your own risk, position sizing, and strategy suitability before entering trades.
Consult a SEBI-registered financial advisor before making any real trading decision. By engaging with this content, you acknowledge full responsibility for your trades and investments.
💬 Found this useful?
🔼 Give this post a Boost to help more traders discover clean, structured learning.
✍️ Drop your thoughts, questions, or setups in the comments — let’s grow together!
🔁 Share with fellow traders and beginners to spread awareness.
👉 “If you liked this breakdown, follow for more clean, structured setups with discipline at the core.”
🚀 Stay Calm. Stay Clean. Trade With Patience.
Trade Smart | Learn Zones | Be Self-Reliant 📊
HONAUT
HONEYWELL AUTOHoneywell Automation India Limited (HAIL)was started in the year 1987 as a JV between Tata and Honeywell. It was known as Tata Honeywell Limited each holding 39.54% stake. Later in 2004 Honeywell Asia Pacific Inc. bought Tata's stake and the name was changed to Honeywell Automation India Limited.
Leader in Integrated automation solutions
Honeywell Automation India Limited (HAIL) is a leader in providing integrated automation and software solutions besides process solutions and building solutions. A Fortune 500 company, it has a wide product portfolio in environmental and combustion controls, sensing controls, etc. It also provides engineering services in the field of automation and control to global clients.
Technology Sharing by Holding company
HAIL has the privilege to access a few of the latest products and technologies of its ultimate holding company Honeywell International Inc. for launching in Indian markets.
Business segments
HAIL caters to its esteemed clientele in domestic markets through various segments which are Process solutions, Building solutions, Management Systems, Advanced Sensing Technologies. It caters to its customers in export markets through the Global Engineering Services Segment and the Global Manufacturing Segment.
Caters to Diversified Industries
Honeywell automation is well placed to cater services through its various business segments to various industries like Aerospace, Buildings & Cities, Chemicals & Materials, Healthcare, Industrial & Manufacturing, Retail, and Safety
Esteemed clientele
Honeywell has a strong track record of serving clients who are having presence across industries in India. Its clientele includes well-known companies with good presence in domestic markets as well as international markets. Some of its reputed customers include Reliance, Vedanta, HPCL, TCS, Delhi Airport, AIIMS, ITC Hotel, Kolkata airport, Mahindra & Mahindra, Kirloskar Oil Engines.
Major Concerns
Major concerns of the co. include rising international crude oil prices, forex rate fluctuations and disruption of the global supply chain.

HONAUT, 1D forms Hammer after a dwntrndNSE:HONAUT Honeywell Automation India Limited (HAIL) is a ~$350 million+ company listed on the Bombay Stock Exchange (BSE) and the National Stock Exchange (NSE). It was incorporated in India in 1984 and its registered office in Hadapsar, Pune. HAIL is a leader in providing integrated automation and software solutions, including process solutions and building solutions. It has a wide product portfolio in environmental and combustion controls, and sensing and control, and also provides engineering services in the field of automation and control to global clients.
HONAUT dorms Bullish Hammer after a downtrend on Daily time frame and gave closing above it.
Entry : 39941
Target : 41100/41400
SL : 38600
RR : 0.85/1

HONAUTHONAUT:- Ascending triangle pattern has formed, wait for breakout, till then keep an eye on the stock
Hello traders,
As always, simple and neat charts so everyone can understand and not make it too complicated.
rest details mentioned in the chart.
will be posting more such ideas like this. Until that, like share and follow :)
check my other ideas to get to know about all the successful trades based on price action.
Thanks,
Ajay.
keep learning and keep earning.

Honaut good Breakout in channel patternHonaut good Breakout in channel pattern good movie in website more than 10% upside move in this channel I find out double bottom pattern in 30 minutes time frame you can check now and by position in retest and correction.

HONAUT: Honeywell automation LongHonaut retesting important fib levels of ratio 1.414 (40800). Can enter into a long position with CMP with SL of 39000 and more can be added around 1.27 (39500) with targets as mentioned on the graph.

HONAUT- Tweezer Bottom at Strong Support LevelsFollowing Chart is of Honeywell Automation which Clearly shows Tweezer Bottom at the Support Level of @39130
The trend must get reversed with Targets anywhere around @48000 to @50000 if the Strong Resistance Level is Broken @45000
The RSI is just reversing from the Oversold Region which hints a nice time to buy.
All in all you will end up with a sweet 11% profit in short term even if you book the profits @45000
Risk averse traders might wait for another day to confirm.
Do follow for more trading setups like these
Thanks, if you have any queries/suggestions related to above pattern, feel free to type below in the comment section.

#RICOAUTO CMP49.05 #TARGET 68 #JBMA #JAMNAAUTO #HONAUT #AUTOIND#RICOAUTO
LONG TERM INVESTMENT
NSE: RICOAUTO
CMP 49.05
Target 68.30
SL 44.25
Profit 40%
Can Hold For Long Term
Factors:
Trend Following
Follow the trends.
Rising Volume with rising Prices.
Flag pattern breakout.
Pennant Pattern Breakout with Bullish Candle.
Retest Successful.
Higher Highs & Higher Lows.
Broken above RESISTANCE levels
Trading at SUPPORT levels
Earnings are strong.
Bullish Wedge Breakout
Risk Return Ratio is healthy.
And
Rising from Double Bottom Pattern to Flag Pattern forming.
If you like my work KINDLY LIKE SHARE & FOLLOW this page for free Stock Recommendations.
With 💚 from Rachit Sethia

HONAUT PredictionShort term trend looks positive but high volume on 19th march suggest that it could be go down and take support at suggested point.

Buy for target of 37000 in coming weeks or monthsLong Honeywell automation for the target of 34799 and 37000
Stop Loss 26820 on closing basis
