Nifty - Wave-B or Boon? (Short Term) Time Holds the Answer!🔹 The Fall as Expected
The fall we anticipated in our weekend video has unfolded exactly as discussed.
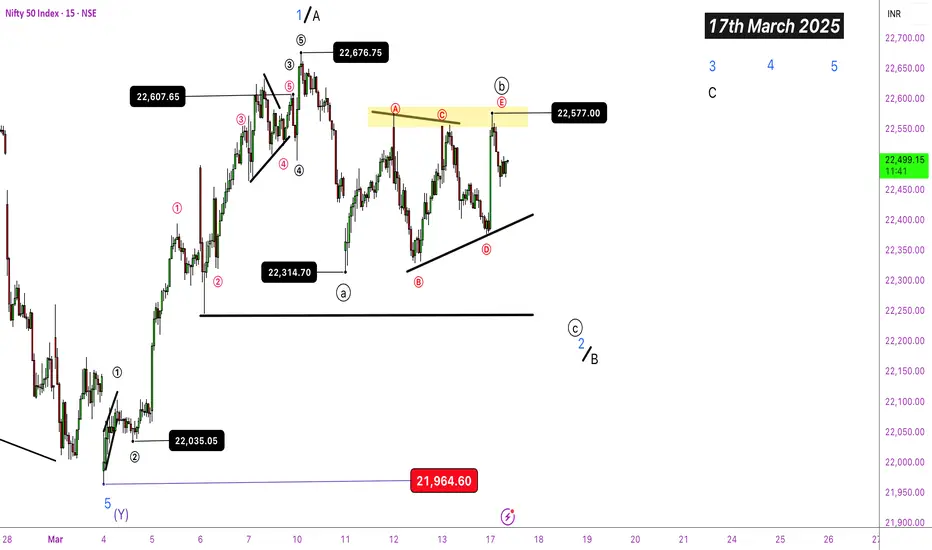
Triangular Pattern in Wave-B (proposed)
Copyright Notice – WaveTalks Original Content
Snapshot and analysis are original content from WaveTalks, protected under copyright laws. Any unauthorized use, distribution, or copying without written permission is strictly prohibited.
The pattern appears to be forming a triangle in Wave-B (proposed), but the bigger question remains—
Has (Wave-e) topped out at 22,577, forming a double top with (Wave-a) within the triangle?
🔹 Bullish Momentum & Market Complexity
Interestingly, the bullish momentum slightly surpassed (Wave-c) of the proposed triangular structure adding complexity to the structure but pattern still intact as wave-a & wave-e both made similar top so far .
🔹 Key Levels to Watch
- Will this decline hold above the swing low at 21,964?
- Or is this just a pause before Nifty resumes its upside journey post the expanded ending diagonal in the larger degree as discussed on 26th Feb2025?
🔹 TradingView Idea - 26th Feb 2025
Last Idea
This structure was already pointing towards higher targets—but now, the answer to all these uncertainties lies with only one entity—⏳ time.
🔹 The Final Truth Lies in Time
Main Samay Hoon… Aur main sab kuch dekh sakta hoon!
Just like in the epic Mahabharat, only time reveals the truth in the market!
Stay Tuned for More Insights!
Catch me with another exciting idea from WaveTalks, Market Whispers! Can you hear them?
Howtotradeusingelliottwave
ONGC- Is it ONGC or OUCH!!! (Will You Buy or Sell?) Elliott Wave20th Feb 2025
Last time, ONGC traded at ₹241 on February 20, 2025 , as shown in the snapshot. Today, February 28, 2025, the stock hit a low of ₹223. The big question—Is this a buying opportunity, or is more downside ahead?
Let’s break it down:
Double Divergence Unfolding
- The RSI image on the daily chart (shown above the price chart) indicates a potential reversal.
- Price is making lower lows, while RSI is making higher lows— a regular bullish divergence , signaling that the downtrend is losing strength.
Waiting for the Final Leg Downside ( Since 20th Feb 2025)
- Though the stock has dropped to ₹223 lows as of today ( 28th Feb 2025), we are possibly in the last phase of the correction before a reversal attempt.
Trendline Confluence – Price vs. RSI
- Price chart: The stock has touched a falling trendline three times (1st, 2nd, and 3rd touch points), which could act as dynamic support.
- RSI image: A rising trendline with three touch points suggests regular bullish divergence, strengthening the case for a potential bottom formation.
Andrew Cardwell’s RSI Magic
- According to Cardwell’s RSI principles, a rising RSI against a falling price often signals an upcoming reversal.
Final Thought
- If the RSI divergence holds, ONGC might be nearing a trend reversal, making this a potential buying opportunity.
- However, a break below ₹223 with increasing momentum could invalidate this setup, opening doors for further downside.
Would you buy at these levels, or are you waiting for more confirmation? Have a great weekend
Catch me with another exciting idea from WaveTalks- Market Whispers! Can You Hear Them?
ONGC - The Big Idea - Did You Check Them?
Regards,
Abhishek
WaveTalks
