Gold (XAUUSD) - Daily ICT Based Analysis🗓️ Date Range: IPDA Range (June 9 – July 4, 2025)
This chart is built using ICT methodology focusing on market structure, liquidity, PD arrays, and smart money price delivery.
🧠 Narrative Breakdown:
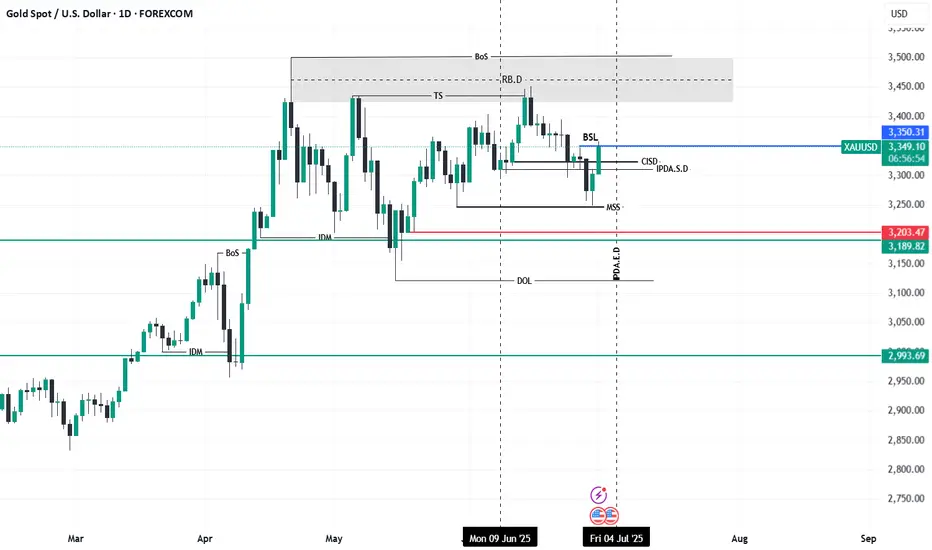
✅ IPDA Range is defined from June 9 to July 4 (20 trading days), providing the valid high and low to map premium/discount.
✅ A Market Structure Shift (MSS) confirms the intent to shift bearish after internal liquidity was swept.
✅ Price ran the Buy Side Liquidity (BSL) and rejected from the Daily Rejection Block (RB.D) and CISD + IPDA S.D., indicating institutional selling interest.
✅ The recent rally into the premium zone failed to close above BSL, showing weakness and potential continuation to the downside.
🎯 Key Points:
BSL Swept above internal range.
RB.D + CISD + IPDA S.D.: Price rejected from these confluences.
Current Bias: Bearish until 3,203.47 and 3,189.82 are met (internal sell-side liquidity).
Extended Target: 2,993.69 — external liquidity resting below the May low.
DOL marked inside the range suggests smart money is engineering price toward sell-side targets.
⚒️ Tools Used:
IPDA Range (20D)
MSS / BoS
Rejection Block (RB.D)
CISD + IFVG
PD Arrays (BSL, IDM, DOL)
📌 Summary:
This is a classic Sell Model within a defined IPDA range. Liquidity was swept, price rejected from premium, and now seeks inefficiencies + sell-side liquidity.
🧠 Wait for price action confirmations on lower timeframes (1H/15M) near PD arrays to engage.
Icttrader
Gold (XAUUSD) - Daily ICT Based AnalysisThis chart reflects a detailed breakdown of Gold using Inner Circle Trader (ICT) concepts on the daily timeframe.
🧠 Key Highlights:
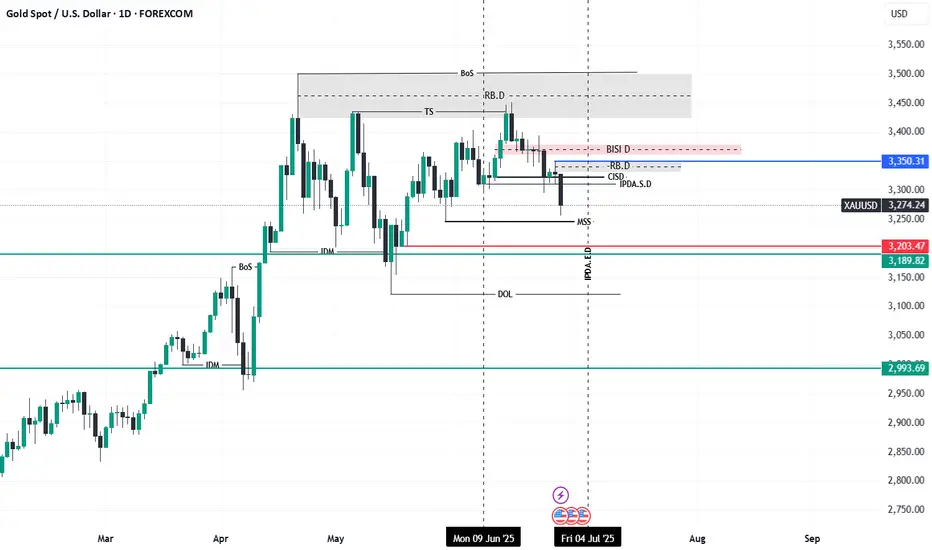
Break of Structure (BoS) and Market Structure Shift (MSS) confirm bearish intent.
Price recently delivered a strong displacement to the downside, breaking through the prior IDM low and forming a clean MSS.
The price has rejected from the Daily Bearish Imbalance (BISI D) and Refined Breaker Block (RB.D) — acting as a key supply zone.
Confluence of Liquidity and Imbalance:
Internal liquidity has been swept from equal highs.
Bearish rebalancing observed in the CISD + IPDA S.D. zone.
Next probable draw on liquidity sits near the 3,203.47 and 3,189.82 PD arrays.
Ultimate downside target marked around 2,993.69, aligned with a previous BMS + DOL zone.
🛠 Tools Applied:
PD Arrays: BISI, RB, FVG, SIBI
Liquidity Zones: IDM, DOL, IPDA S.D.
Price Action: MSS, Displacement, and Retracement Concepts
📌 Bias: Bearish
📌 Narrative: Liquidity has been engineered above highs; current price action seeks sell-side liquidity and inefficiencies beneath recent lows.
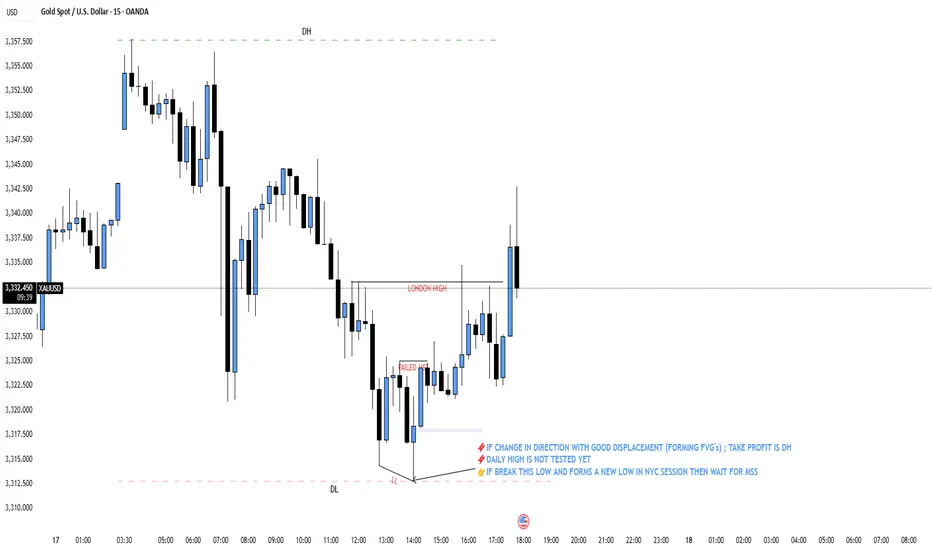
XAUUSD Intraday Liquidity Flow – Key Intraday Triggers
If price breaks the current low and forms a new low during the NYC session, wait patiently for a Market Structure Shift (MSS) before entering.
Daily High (DH) is not tested yet – potential target for price.
If change in direction with good displacement (forming FVGs): Consider taking profit at Daily High (DH).
OANDA:XAUUSD
NIFTY FIN VIEW FOR 26.MARCH.2024Fin Nifty has covered the Imbalance. It also tested Demand zone ( 20485 - 20235 ) and then trying move up higher to fill the Gap area .But looking at the market conditions, it looks like it can break the Demand zone and move down lower.
THIS IS MY PERSONAL ANALYSIS, FOR MY PERSONAL TRADING.
IM NOT SEBI REGISTERED

NIFTY 50 VIEW FOR 26 MARCH 2024Nifty making simple LL,LH structure . Expecting it to continue moving down by testing the Supply zone ( 22134 - 22197 ) marked on the picture. If the Protected Swing high get's taken out, we'll change our bias to bullish again.
This is my personal analysis, for my personal trading
Im not SEBI Registered.

IPDA (interbank price delivery algo) trap trader | ICT learning in this short video I'm going to tell you about how interbank price delivery algorithm traps trader and how market move against as per the expectation of retail traders
