IDBI (W): Aggressive BullishTimeframe: Weekly | Scale: Logarithmic
The stock has confirmed a breakout from a 2-year consolidation phase (₹67–₹107). This move is supported by the highest weekly volume in months .
📈 1. The Chart Structure (The Box Breakout)
> The Consolidation: ₹67 – ₹107 range. The stock spent nearly 24 months in this zone, absorbing all supply.
> The Breakout: This week's close of ₹114.85 (+13%) is a decisive "Jailbreak."
- Significance: Breaking a 2-year base often leads to a trend that lasts for several quarters, not just weeks.
📊 2. Volume & Indicators
> Volume Ignition: The 174.74 Million volume is an "Institutional Stamp." It confirms that "Smart Money" is entering to ride the privatization/growth story.
> RSI: Rising in all timeframes. The Monthly RSI crossing 60 is a "Super Bullish" signal, indicating the start of a long-term momentum phase.
🎯 3. Future Scenarios & Key Levels
The stock is now facing its final "Boss Level" resistance.
> 🐂 Bullish Target (The Blue Sky):
- The Hurdle: ₹115 – ₹120 . This is a historical pivot. The stock closed right at the edge of this zone.
- The Trigger: A weekly close above ₹120 .
- Target 1: ₹135 .
- Target 2: ₹147 .
> 🛡️ Support (The "Must Hold"):
- Immediate Support: ₹107. The breakout level must now act as a rigid floor (Polarity Principle).
- Stop Loss: A weekly close below ₹100 would imply the breakout was a "Bull Trap."
Conclusion
This is a Grade A Turnaround Setup .
> Refinement: The stock has cleared the Consolidation (107) but is testing the Historical Resistance (115-120) .
> Strategy: The volume suggests the resistance at 120 will likely break. Buy on dips to ₹108-110 or wait for a clear close above ₹120 to go full throttle.
Idbibank

IDBI BANK LTD ANALYSISTHIS IS MY CHART OF THE WEEK PICK
FOR LEARNING PURPOSE
IDBI BANK- The current price of IDBI is 114.73 rupees
I am going to buy this stock because of the reasons as follows-
1. It has given a breakout of last 11 year resistance with some good volume and looks great.
2. This stock has seen some great buying from mid 2022 to March 2024. Then it went for some time and price correction which was needed.
This stock has been in my watchlist from last weeks.
I am personally more aggressive on Banks as they are holding really well.
3. It is showing better relative strength as it stood strong in volatile times including last few weeks.
4. The risk and reward is favourable.
5. The stock is one of the outperformers in this market. The structure is great as of now. It has also outperformed it's sector in very short term but it was more of a lagging stock in long term and probably it will show better strength in coming days.
6. Another good part- The overall sector has shown some decent strength and have good momentum.
I am expecting more from this in coming weeks.
I will buy it with minimum target of 35-40% and then will trail after that.
My SL is at 100 rupees.
I will be managing my risk.

IDBI Bank cmp 114.73 by Monthly Chart view - UpdateIDBI Bank cmp 114.73 by Monthly Chart view
* Support Zone 74 to 94 Price Band
* Resistance Zone 112 to 128 Price Band
* Bullish Head & Shoulders by Resistance Zone Neckline
* Stock headed for probable major breakout above 11 ½ years old price level of 116.40 done in June 2014

IDBI Bank cmp 104.62 by Monthly Chart viewIDBI Bank cmp 104.62 by Monthly Chart view
- Support Zone at 64 to 84 Price Band
- Resistance Zone at 108 to 128 Price Band
- Breakout attempted from Falling Resistance Trendline
- Bullish Head and Shoulders by the Resistance Zone neckline
- Monthly Volumes spiking regularly over a year since Sept 2024
- Positively trending Technical Indicators BB, EMA, MACD, RSI, SAR, SuperTrend

IDBI Bank and the Bullish Cup & Handle Pattern📈 Technical Analysis Spotlight: IDBI Bank and the Bullish Cup & Handle Pattern
In the world of technical analysis, chart patterns often serve as powerful indicators of potential price movements. One such pattern, the Cup and Handle, has recently emerged on the daily chart of IDBI Bank Limited, offering traders and investors a compelling bullish setup.
🏦 Current Market Snapshot
As of the latest data, IDBI Bank is trading at ₹100.42. This price action is notable not just for its level, but for the structure it has formed—a classic Cup and Handle pattern, which is widely regarded as a bullish continuation signal.
☕ Understanding the Cup and Handle Pattern
The Cup and Handle pattern resembles the shape of a tea cup:
The "cup" forms after a rounded bottom, indicating a period of consolidation and accumulation.
The "handle" follows as a short-term pullback, typically on lighter volume, before a potential breakout.
This pattern reflects a shift in market sentiment—from bearish to bullish—as buyers gradually regain control.
📊 Technical Confirmation
Several factors strengthen the bullish outlook for IDBI Bank:
The stock is trading above its 50-day and 100-day Simple Moving Averages (SMA), suggesting medium-term strength and trend alignment.
The neckline resistance—the key breakout level—is identified at ₹106. A decisive move above this level would confirm the completion of the Cup and Handle pattern.
🚀 What Happens After the Breakout?
If IDBI Bank breaks above ₹106 with strong volume, it could trigger a bullish rally, as the pattern implies renewed buying interest and momentum. Traders often look for price targets by measuring the depth of the cup and projecting it upward from the breakout point.
🧠 Final Thoughts
The Cup and Handle pattern on IDBI Bank’s chart, combined with its position above key moving averages, presents a textbook bullish setup. While no pattern guarantees future performance, this formation is a favorite among technical analysts for its reliability and clarity.
As always, traders should consider risk management and broader market conditions before acting on any signal.

BUY TODAY SELL TOMORROW for 5%DON’T HAVE TIME TO MANAGE YOUR TRADES?
- Take BTST trades at 3:25 pm every day
- Try to exit by taking 4-7% profit of each trade
- SL can also be maintained as closing below the low of the breakout candle
Now, why do I prefer BTST over swing trades? The primary reason is that I have observed that 90% of the stocks give most of the movement in just 1-2 days and the rest of the time they either consolidate or fall
Resistance Breakout in IDBI

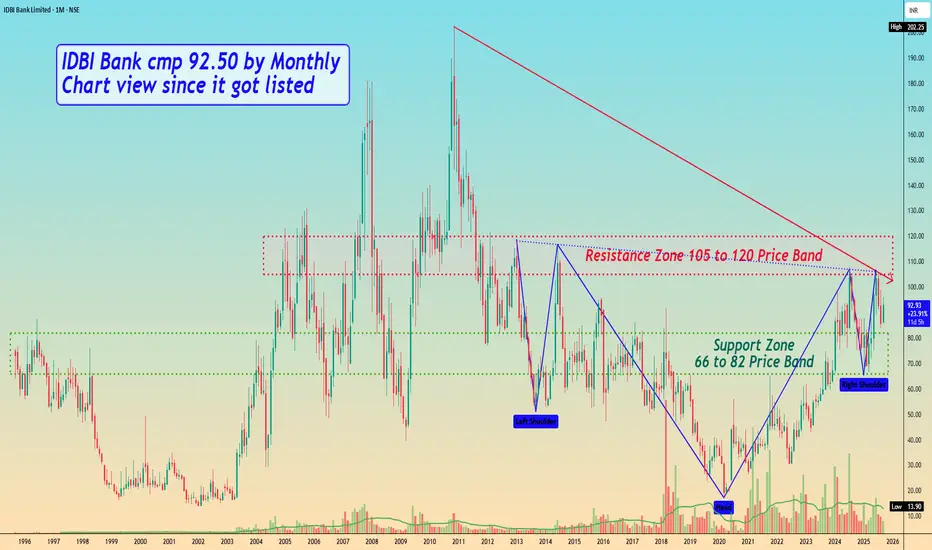
IDBI Bank cmp 92.50 by Monthly Chart view since it got listedIDBI Bank cmp 92.50 by Monthly Chart view since it got listed
- Support Zone 66 to 82 Price Band
- Resistance Zone 105 to 120 Price Band
- Bullish Cup and Handle done indicative of good upside probability
- Resistance Zone acting strongly hence Price move getting rejected since October 2011
- Breakout above Resistance Zone needs heavy traded Volumes increase and needs to sustain above it for few days to foresee and anticipate fresh upside 🤞🏽🤞🏽🤞🏽🤞🏽
IDBIBANK PARELLEL CHANNEL BREAKOUTIdbibank breaking parellel channel weekly basis
breaking 20ema taking #support at 200ema
with huge volume,strong rsi
#target 107 sl 65
#q3result on 20 january
NO BUY/SELL RECOMENDATION

IDBI Bank breakout resistance for Long Term targetBuy at 98-102
T1- 131, T2- 183, T3- 201 and T4- 252.
SL- 61
Safe traders exit 60% of the investment at T2 and continue till T3. Only risky traders can go for T4 if price gives a good breakout at 201. And exit of price reverses from T3 with a candlestick pattern.
Note: This is only for educational purpose and not a recommendation.

IDBI BANKIDBI BAnk CMP 92.5 trying to BO abv 93 for last 6 months, if crosses then next technical tgt is 110 and 135. The bank is showing a good growth and profits. Please do ur own analysis before investing.
If fails to BO then price may again fall to 80-82 levels that will be again better place to add.

IDBI BANK - Good long term investment?Price observation & overview:
1. Price is in HH-HL formation.
2. Currently near the highs of the channel, once it retraces down we can plan for a fresh entry near the support area.
3. Momentum is clearly lacking.
4. Underperformance is likely to continue unless it breaks above 130 and sustains.
5. Earnings are great.
6. Volumes are good too.
Weekly tf view:
- Stay tuned for further insights, updates and trade safely!
- If you liked the analysis, don't forget to leave a comment and boost the post. Happy trading!
Disclaimer: This is NOT a buy/sell recommendation. This post is meant for learning purposes only. Please, do your due diligence before investing.
Thanks & Regards,
Anubrata Ray

IDBI BANK - Swing Trade Analysis - 3rd April #stocksIDBI BANK (1D TF) - Swing Trade Analysis given on 3rd April, 2024
Pattern: FALLING WEDGE BREAKOUT
- Trendline Resistance Breakout - Done ✓
- Volume buildup at Resistance - Done ✓
- Demand Zone Retest & Consolidation - In Progress

IDBI - Ichimoku BreakoutTradingview :
📈 Stock Name - IDBI Bank Limited
🌐 Ichimoku Cloud Setup:
1️⃣ Today's close is above the Conversion Line.
2️⃣ Future Kumo is Turning Bullish.
3️⃣ Chikou span is slanting upwards.
All these parameters are shouting BULLISH at the Current Market Price and even more bullishness anticipated AFTER crossing 81.
🚨 Disclaimer: This is not a Buy or Sell recommendation. It's for educational purposes and a guiding light to learn trading in the market.
#CloudTrading
#IchimokuCloud
#IchimokuFollowers
#Ichimokuexpert
Excited about this analysis? Share your thoughts in the comments below!
👍 Like, Share, and Subscribe for daily market insights! 🚀
#StockAnalysis #MarketWatch #TradingEducation #ichimoku

IDBI DOUBLE BOTTOM BREAKOUTIDBI breaking double bottom neckline
with good volume
near #target can be 73
educational idea only


IDBI BANK: 2 year Cup and Handle BreakoutIDBI BANK is breaking out of a 2 year long cup and handle pattern with high volume and high RSI. The breakout is sustaining over the support.

Cup&Handle Pattern Spotted Multi Year Breakout with Good VOLUMEEverything Explained in Chart IF you have any question . Please comment down Below

IDBIBANK BREAKINGOUT FROM F&PIDBIBANK giving breakout from F&P
good volume,trading above 20 ema
posted good q4 result
educational idea only


IDBI High risk bet
#IDBI
IDBI Bank
TOO RISKY
TOO TOO RISKY
But tempted to add it in parts with SL of 45 on WCB.
Not a short term play.
#vr

IDBI BANKPOSSIBLE UP MOVE
EVERYTHING IS MENTIONED ON THE CHART
DEEP VOLUME ANALYSIS + BREAKOUT + ADVANCE ANALYSIS
NOTE - THIS is for educational purposes only. This is not any recommendation. I am not SEBI registered.

IDBIHead & Shoulder Breakout Retracing back , Take entry on completion of retracement , Keep Your Stop loss

TARGET HIT IN IDBI BANK (LATE POST)idbi bank made breakout from cup &handle pattern
it was perfect
NSE:IDBI
