BEL // 2hr Support and ResistanceAs of April 29, 2025, here are the key 2-hour support and resistance levels for Bharat Electronics Ltd (NSE: BEL) based on recent technical analyses:
📈 2-Hour Support and Resistance Levels
Type Level (₹)
Resistance 1 (R1) ₹292.55
Resistance 2 (R2) ₹294.85
Resistance 3 (R3) ₹296.35
Support 1 (S1) ₹286.35
Support 2 (S2) ₹284.05
Support 3 (S3) ₹282.10
These levels are derived from recent intraday price action and can serve as potential reversal or breakout zones for the stock.
📊 Additional Technical Indicators
Relative Strength Index (RSI): Approximately 55.26, indicating a neutral to slightly bullish momentum.
Money Flow Index (MFI): Approximately 50.44, suggesting balanced buying and selling pressure.
Moving Average Convergence Divergence (MACD): Approximately -0.92, indicating a bearish trend.
Average True Range (ATR): Approximately 8.7, indicating moderate volatility.
📌 Key Observations
Resistance Levels: If BEL breaks above ₹292.55, it may face resistance at ₹294.85 and ₹296.35.
Support Levels: A decline below ₹286.35 could lead to further support at ₹284.05 and ₹282.10.
Trend Analysis: The stock is currently trading within a range, with key levels at ₹292.55 on the upside and ₹286.35 on the downside. A breakout above or below these levels could indicate the next directional move.
Please note that these levels and indicators are based on historical data and technical analysis, and actual market conditions may vary. It's advisable to conduct further research or consult with a financial advisor before making investment decisions.
IDFC

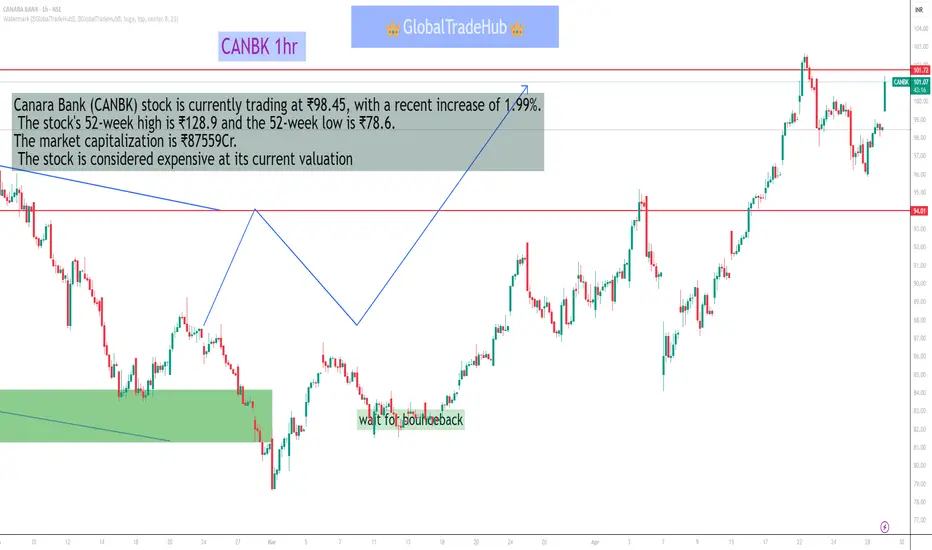
Canara BankAs of April 29, 2025, here are the key 1-hour support and resistance levels for Canara Bank (NSE: CANBK) based on recent technical analyses:
📈 1-Hour Support and Resistance Levels
Type Level (₹)
Resistance 1 (R1) ₹108.05
Resistance 2 (R2) ₹109.51
Support 1 (S1) ₹104.56
Support 2 (S2) ₹102.53
These levels are derived from recent intraday price action and can serve as potential reversal or breakout zones for the stock.
📊 Additional Technical Indicators
Relative Strength Index (RSI): Approximately 60, indicating a neutral to slightly bullish momentum.
Moving Average Convergence Divergence (MACD): Currently in a bearish crossover, suggesting potential downward pressure.
Bollinger Bands: The stock is trading near the upper band, indicating high volatility and potential overbought conditions.
📌 Key Observations
Resistance Levels: If Canara Bank breaks above ₹108.05, it may face resistance at ₹109.51.
Support Levels: A decline below ₹104.56 could lead to further support at ₹102.53.
Trend Analysis: The stock is currently testing the upper resistance zone. A breakout above ₹108.05 could signal a continuation of the upward trend. Conversely, a drop below ₹104.56 may indicate a bearish reversal.
Please note that these levels and indicators are based on historical data and technical analysis, and actual market conditions may vary. It's advisable to conduct further research or consult with a financial advisor before making investment decisions.
Reliance Industries //1 day Support and ResistanceAs of April 29, 2025, here are the key daily support and resistance levels for Reliance Industries Ltd (NSE: RELIANCE) based on recent technical analyses:
📈 Daily Support and Resistance Levels
Level Type Value (₹)
Support 1 (S1) ₹1,191.37
Support 2 (S2) ₹1,177.43
Support 3 (S3) ₹1,153.37
Resistance 1 (R1) ₹1,229.37
Resistance 2 (R2) ₹1,253.43
Resistance 3 (R3) ₹1,267.37
These levels are derived from recent technical analyses and can serve as potential reversal or breakout zones for the stock.
📊 Additional Technical Indicators
Relative Strength Index (RSI): Approximately 48.94, indicating a neutral to slightly bearish momentum.
Moving Averages:
5-Day Simple Moving Average (SMA): ₹1,210.41
50-Day Simple Moving Average (SMA): ₹1,213.72
200-Day Simple Moving Average (SMA): ₹1,216.23
The stock is trading near its short-term moving averages, suggesting a consolidation phase.
📌 Key Observations
Resistance Levels: If Reliance Industries breaks above ₹1,229.37, it may face resistance at ₹1,253.43 and ₹1,267.37.
Support Levels: A decline below ₹1,191.37 could lead to further support at ₹1,177.43 and ₹1,153.37.
Trend Analysis: The stock is currently trading within a range, with key levels at ₹1,229.37 on the upside and ₹1,191.37 on the downside. A breakout above or below these levels could indicate the next directional move.
Please note that these levels and indicators are based on historical data and technical analysis, and actual market conditions may vary. It's advisable to conduct further research or consult with a financial advisor before making investment decisions.

Bank Nifty IndexAs of April 29, 2025, here are the key support and resistance levels for the Bank Nifty Index based on recent technical analyses:
📈 Bank Nifty Support and Resistance Levels:
Type Level (₹)
Resistance 1 (R1) 46,000
Resistance 2 (R2) 46,375
Resistance 3 (R3) 47,200
Support 1 (S1) 45,236
Support 2 (S2) 44,936
Support 3 (S3) 44,100
These levels are derived from recent technical analyses and can serve as potential reversal or breakout zones for the index.
📊 Additional Technical Indicators
Relative Strength Index (RSI): Approximately 52, indicating a neutral to slightly bullish momentum.
Moving Averages:
5-Day Average: ₹53,435.41
50-Day Average: ₹51,815.64
200-Day Average: ₹50,455.01
The stock is trading above its 5-day and 50-day simple moving averages (SMAs), suggesting a short-term bullish trend.
📌 Key Observations
Resistance Levels: If Bank Nifty breaks above ₹46,000, it may face resistance at ₹46,375 and ₹47,200.
Support Levels: A decline below ₹45,236 could lead to further support at ₹44,936 and ₹44,100.
Trend Analysis: The index is currently testing the upper resistance zone. A breakout above ₹46,000 could signal a continuation of the upward trend. Conversely, a drop below ₹45,236 may indicate a bearish reversal.
Please note that these levels and indicators are based on historical data and technical analysis, and actual market conditions may vary. It's advisable to conduct further research or consult with a financial advisor before making investment decisions.

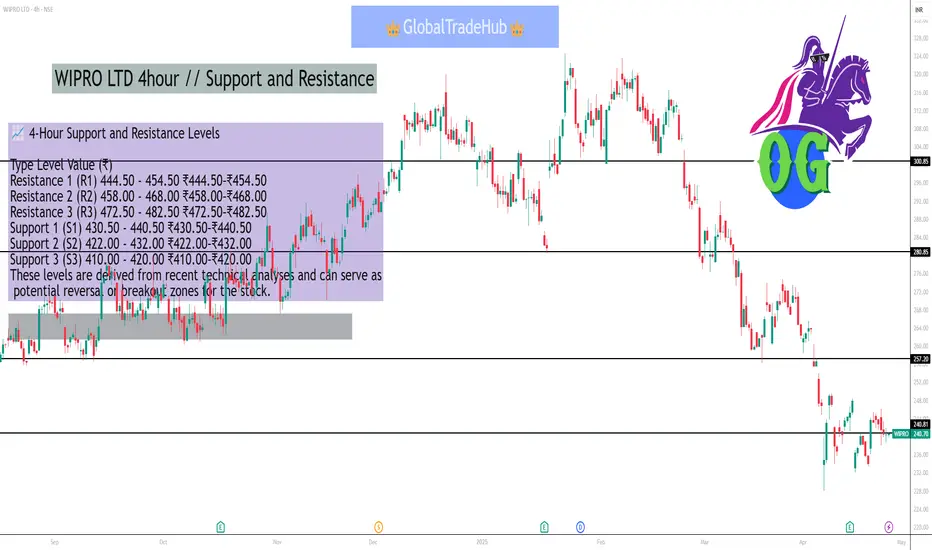
WIPRO LTD 4hour // Support and ResistanceAs of April 29, 2025, here are the key 4-hour support and resistance levels for Wipro Ltd (NSE: WIPRO) based on recent technical analyses:
📈 4-Hour Support and Resistance Levels
Type Level Value (₹)
Resistance 1 (R1) 444.50 - 454.50 ₹444.50–₹454.50
Resistance 2 (R2) 458.00 - 468.00 ₹458.00–₹468.00
Resistance 3 (R3) 472.50 - 482.50 ₹472.50–₹482.50
Support 1 (S1) 430.50 - 440.50 ₹430.50–₹440.50
Support 2 (S2) 422.00 - 432.00 ₹422.00–₹432.00
Support 3 (S3) 410.00 - 420.00 ₹410.00–₹420.00
These levels are derived from recent technical analyses and can serve as potential reversal or breakout zones for the stock.
📊 Additional Technical Indicators
Relative Strength Index (RSI): Approximately 60, indicating a neutral to slightly bullish momentum.
Moving Average Convergence Divergence (MACD): Currently in a bearish crossover, suggesting potential downward pressure.
Bollinger Bands: The stock is trading above the upper band, indicating high volatility and potential overbought conditions.
📌 Key Observations
Resistance Levels: If Wipro breaks above ₹444.50, it may face resistance at ₹458.00 and ₹472.50.
Support Levels: A decline below ₹430.50 could lead to further support at ₹422.00 and ₹410.00.
Trend Analysis: The stock is currently testing the upper resistance zone. A breakout above ₹444.50 could signal a continuation of the upward trend. Conversely, a drop below ₹430.50 may indicate a bearish reversal.
Please note that these levels are based on historical data and technical analysis, and actual market conditions may vary. It's advisable to conduct further research or consult with a financial advisor before making investment decisions.
Adani Green Energy Ltd As of April 29, 2025, here are the key weekly support and resistance levels for **Adani Green Energy Ltd based on recent technical analyses:
📈 Weekly Support and Resistance Levels
| Type | Level | Value (₹) |
|------------|--------|-----------|
| Resistance 1 (R1) | 991.77 | ₹991.77 |
| Resistance 2 (R2)| 1,040.48 | ₹1,040.48 |
| Resistance 3 (R3) | 1,066.17 | ₹1,066.17 |
| Support 1 (S1) | 917.37 | ₹917.37 |
| Support 2 (S2) | 891.68 | ₹891.68 |
| Support 3 (S3) | 842.97 | ₹842.97 |
These levels are derived from recent technical analyses and can serve as potential reversal or breakout zones for the stock.
📊 Additional Technical Indicators
Relative Strength Index (RSI): The RSI is 42.48, indicating that the stock is in the neutral territory, suggesting neither overbought nor oversold conditions.
- Moving Averages:
- 5-Day EMA: ₹825.40
- 50-Day EMA: ₹973.00
- 200-Day EMA: ₹1,335.50
- Current Price: ₹919.15
The stock is trading below its 50-day and 200-day exponential moving averages (EMAs), suggesting a short-term bearish trend.
⚠️ Important Notes
- Market Conditions: The stock has experienced significant volatility, with a 52-week high of ₹1,753.17 and a low of ₹455.37. The recent price decline of 19.92% over the past month indicates increased market uncertainty. )
- **Trading Restrictions**: Please be aware of any trading restrictions or circuit limits that may apply to the stock.
Please note that these levels and indicators are based on historical data and technical analysis, and actual market conditions may vary. It's advisable to conduct further research or consult with a financial advisor before making investment decisions.

Bajaj Finance LTD // 1hour Support and ResistanceAs of April 28, 2025, Bajaj Finance Ltd (NSE: BAJFINANCE) is trading at ₹8,731.60. Based on the latest technical analysis, here are the key support and resistance levels for the 1-hour timeframe:
📊 1-Hour Support and Resistance Levels
Immediate Support (S1): ₹8,744.55
Immediate Resistance (R1): ₹9,002.55
These levels are derived from recent market data and technical analysis. Movements beyond these points may indicate potential changes in the stock's trend.
🔍 Technical Indicators
20 EMA (Exponential Moving Average): ₹8,393.26
50 EMA: ₹8,381.46
Signal: Strong Bearish
The 1-hour chart indicates a strong bearish trend, as both the 20 EMA and 50 EMA are trending downward. This suggests potential selling pressure in the short term.
⚠️ Important Notes
Breakout Above Resistance: If the stock price breaks above ₹9,002.55, it may signal a bullish trend.
Breakdown Below Support: A drop below ₹8,744.55 could indicate further downside potential.
Please note that technical analysis is subject to change based on market conditions. It's advisable to monitor the stock closely and consider consulting with a financial advisor before making any trading decisions.

AXIS BANK LTDAXIS BANK LTD-1W.NSE
Vol
Good chart structure
After a big breakout in previous week, stock has shown a profit booking from higher levels
If it closes above 1185-1200 levels, then more up move is possible
Entry Above 1200
Target 1270/1340
Stop loss 1120

ACC LTDACC LTD:-
As of April 28, 2025, ACC Ltd (NSE: ACC) is trading at ₹2,327.85. Based on recent technical analysis, here are the key intraday support and resistance levels for a 15-minute chart timeframe:
📉 Support Levels (15-Minute Chart)
Support 1 (S1): ₹2,316.93
Support 2 (S2): ₹2,306.02
Support 3 (S3): ₹2,294.98
These levels are derived from recent pivot point calculations and may act as potential entry points or stop-loss levels for short trades.
📈 Resistance Levels (15-Minute Chart)
Resistance 1 (R1): ₹2,327.97
Resistance 2 (R2): ₹2,338.88
Resistance 3 (R3): ₹2,349.92
These resistance levels are based on recent pivot point calculations and can serve as potential targets for long trades or areas to watch for price reversals.
🔍 Technical Indicators (15-Minute Chart)
EMA (5): ₹2,310.56 (Bullish)
EMA (10): ₹2,309.98 (Neutral)
EMA (15): ₹2,310.18 (Bullish)
EMA (20): ₹2,310.68 (Mild Bullish)
EMA (50): ₹2,319.19 (Mild Bearish)
The shorter-term EMAs (5, 10, and 15) indicate a bullish trend, suggesting upward momentum. However, the 50-period EMA shows a mild bearish trend, indicating potential resistance at higher levels.
⚠️ Important Notes
Market Conditions: The stock market is influenced by various factors, including economic data, corporate earnings, and global events. It's essential to stay informed about these factors when making trading decisions.
Risk Management: Always use proper risk management techniques, such as setting stop-loss orders and only risking a small percentage of your trading capital on each trade.
Consult Professionals: Consider consulting with a financial advisor or conducting further research before making any trading decisions.

Database Trading part 3InfluxDB is a high-performance, purpose-built time-series database designed for real-time analytics. It boasts low-latency writes, efficient storage, and a powerful query engine tailored for event-driven systems like algorithmic trading.

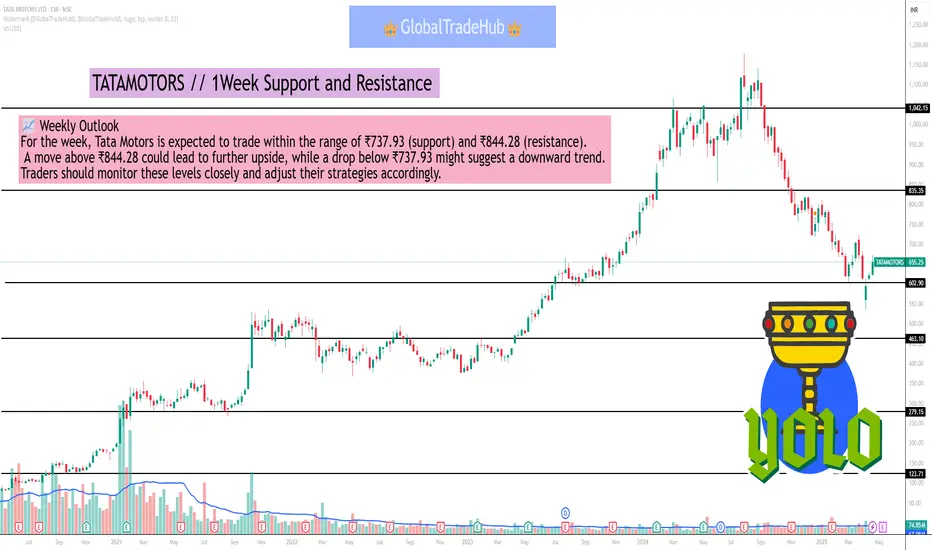
TATAMOTORS // 1Week Support and Resistance As of the latest available data, here are the key support and resistance levels for Tata Motors Ltd. (TATAMOTORS) for the upcoming week:
📊 Weekly Support and Resistance Levels
Type Level Value (₹)
Support S1 773.38
S2 756.47
S3 737.93
Resistance R1 808.83
R2 827.37
R3 844.28
These levels are derived from technical analysis and serve as potential entry, exit, or stop-loss points for traders. A breach below the support levels could indicate a bearish trend, while a breakout above the resistance levels may signal a bullish move.
🔍 Technical Indicators Overview
RSI (14): 43.38 — Indicates neutral momentum.
MACD (12,26): 0 — Suggests a neutral trend.
Moving Averages:
20-day SMA: 655.61 — Slightly below current price, indicating a potential short-term downtrend.
50-day SMA: 655.34 — Aligns with the 20-day SMA, reinforcing the neutral to bearish outlook.
200-day SMA: 655.93 — Further confirms the downtrend.
📈 Weekly Outlook
For the week, Tata Motors is expected to trade within the range of ₹737.93 (support) and ₹844.28 (resistance). A move above ₹844.28 could lead to further upside, while a drop below ₹737.93 might suggest a downward trend. Traders should monitor these levels closely and adjust their strategies accordingly.
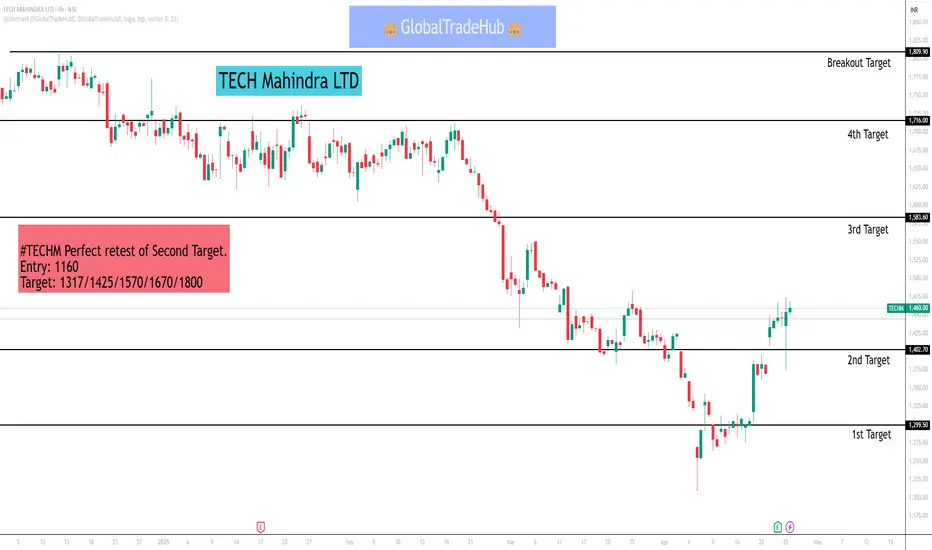
TECH Mahindra LTD
#TECHM Perfect retest of Second Target.
Entry: 1160
Target: 1317/1425/1570/1670/1800
Here are the key 4-hour support and resistance levels for Tech Mahindra Ltd. (TECHM) based on recent technical data:
🔹 4-Hour Support Levels
S1: ₹1,589.75
S2: ₹1,575.45
S3: ₹1,554.75
If the price falls below ₹1,589.75, the next support levels to watch are ₹1,575.45 and ₹1,554.75.
🔸 4-Hour Resistance Levels
R1: ₹1,624.75
R2: ₹1,645.45
R3: ₹1,659.75
If the price rises above ₹1,624.75, the next resistance levels are ₹1,645.45 and ₹1,659.75.
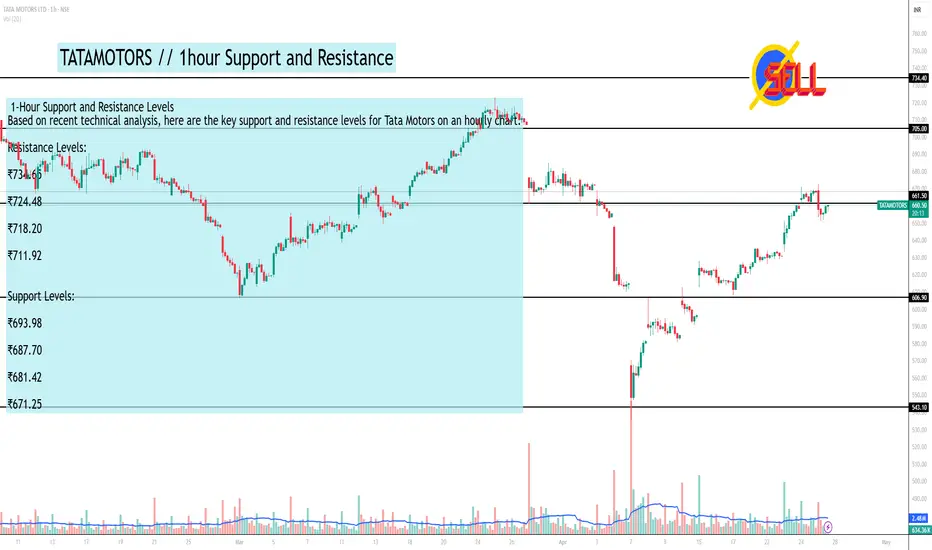
TATAMOTORS // 1hour Support and ResistanceAs of April 25, 2025, Tata Motors (NSE: TATAMOTORS) has experienced a significant intraday surge, reaching ₹606.45, up over 4% from its previous close of ₹582.90. This uptick is attributed to positive sentiment in the auto sector and broader market optimism.
📈 1-Hour Support and Resistance Levels
Based on recent technical analysis, here are the key support and resistance levels for Tata Motors on an hourly chart:
Resistance Levels:
₹734.65
₹724.48
₹718.20
₹711.92
Support Levels:
₹693.98
₹687.70
₹681.42
₹671.25
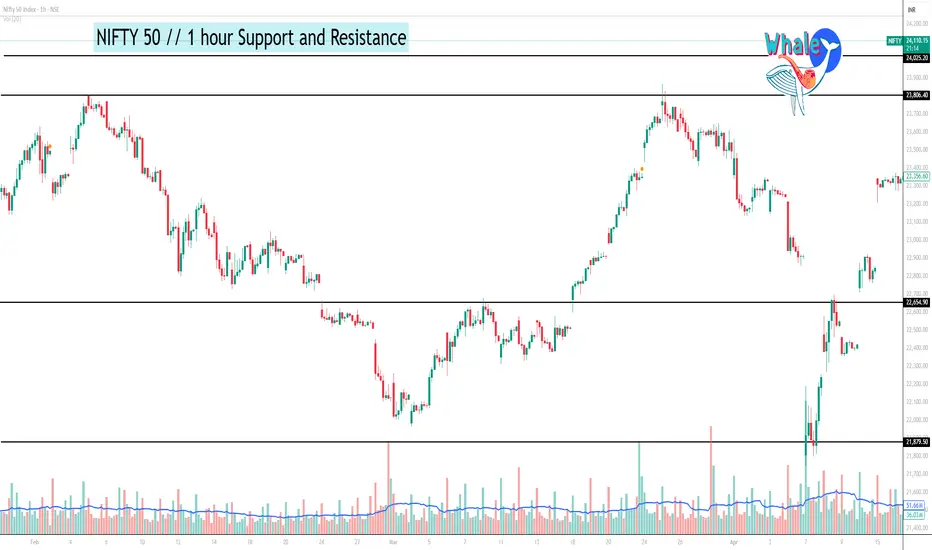
NIFTY 50 1 hour support and resistanceNifty Update
Current Price: 24,150
Nifty crossed 24,300, hitting a high of 24,365 - same as the day before yesterday's open.
Yesterday, it retested this key resistance but failed to sustain.
If Nifty reclaims and sustains above 24,300, it may attempt to break 24,365.
A breakout above that level can lead to an up move towards 24,442-24550.
Key Levels:
Support: 24,100-24000
Resistance: 24,300
#Nifty50 #StockMarket #NSE #TechnicalAnalysis
How we trade in option chain ?To trade using an option chain, you first need to understand its structure and the information it provides. Option chains are organized by strike prices, expiration dates, and whether they are call or put options. You then decide whether to buy (long) or sell (short) a particular option contract, specifying the strike price, expiration date, and quantity. Finally, you submit your order through your brokerage platform.

Candlesticks Pattern Part 2A bullish candlestick is typically green or white and means the closing price is higher than the opening price, indicating upward momentum. Inversely, a bearish candlestick, generally red or black, signals that the closing price was lower than the opening price, reflecting downward pressure.

RSI and RSI DivergenceRSI: Divergence appears when the RSI's highs or lows diverge from price. For example, if the price makes new lows but the RSI bottoms at higher levels, it signals bullish divergence; if the price makes new highs but the RSI peaks at lower levels, it signals bearish divergence.

Double Rounding Bottom | HDFC BANK1️⃣ News on HDFC Bank
📍IPO Launch: ₹12,500 crore IPO for its subsidiary, HDB Financial Services
📍Profit Growth: 5.3% increase in net profit for the last quarter
📍Stock Surge: HDFC Bank shares have risen nearly 20% in three months
📍Market Position: High market cap and favorable investor sentiment
2️⃣Technical Analysis
⭕️Support around ₹1,500; important for maintaining upward momentum.
⭕️Breakout above ₹1,700 for potential buy signals.
⭕️Moving averages indicate bullish momentum.
⭕️Overbought territory suggests potential short-term corrections.
⚠️Conclusion
Strong fundamentals, including solid revenue growth The merger with HDFC Ltd. enhances its market presence, but it faces some margin pressures. Overall, it’s a good time to buy HDFC Bank stocks for long-term stability and growth, while keeping an eye on potential short-term volatility.
✅Check out my TradingView profile to see how we analyze charts and execute trades.
🙋♀️🙋♂️If you have any questions about this stock, feel free to reach out to me.
📍📌Thank you for exploring our idea! We hope you found it valuable.
🙏FLLOW for more !
👍LIKE if useful !
✍️COMMENT Below your view !

IDFC FIRST BANK - BREAKOUT / BREAKDOWNYou guys are smart if you really know how to trade this Pattern !
A rectangle chart pattern forms during a period of consolidation, where the price moves between parallel support and resistance levels. This pattern indicates indecision in the market, with buyers and sellers in equilibrium. The price bounces between these horizontal levels multiple times, creating a rectangular shape. Traders look for a breakout from this range to signal the next move. A bullish breakout occurs above the resistance, while a bearish breakout happens below the support. Volume typically decreases during the formation and spikes during the breakout, confirming the pattern’s validity.
Clear Accumulation/Distribution Happening, pay attention even if you dont want to trade it's fine !

IDFC | All Trendline Bull Breakout at the Same Time⭕️ Swing Trading opportunity: Price Action Analysis Alert !!!⭕️
💡FNO Stocks Trading📉📈📊
✅Check out my TradingView profile to see how we analyze charts and execute trades.
✅We can't conduct a thorough analysis in such a short span of time. We need to review it, post our findings, and then take action.
🙋♀️🙋♂️If you have any questions about this stock, feel free to reach out to me.
📍📌Thank you for exploring our idea! We hope you found it valuable.
🙏FLLOW for more !
👍LIKE if useful !
✍️COMMENT Below your view !

IDFC | Long Term | Cycle RepeatsThe lifecycle of a stock or asset can be broadly understood through a series of phases or stages that represent different patterns of price action. These stages help traders and investors identify where a stock might be in its cycle, and therefore make more informed decisions. Here's a breakdown of the typical lifecycle of a stock:
Stage 1: Accumulation (Consolidation)
Description: During this stage, the stock price moves within a relatively tight range, often after a significant decline or during periods of low market interest. This stage is characterized by low volatility and low trading volumes as institutional investors or informed insiders begin to accumulate shares without significantly moving the price.
Market Sentiment: Neutral to cautiously optimistic.
Price Action: The stock trades sideways, with minor ups and downs, creating a base or a foundation for the next move. This is also known as the consolidation phase.
Technical Indicators: Moving averages might flatten out, and other indicators like the Relative Strength Index (RSI) tend to stay neutral.
Stage 2: Markup (Rise)
Description: In this stage, the stock begins to rise steadily, often breaking out of the consolidation range established during Stage 1. This is when the broader market starts to take notice, and buying interest increases.
Market Sentiment: Bullish, with increasing optimism and momentum.
Price Action: The stock shows a clear uptrend, making higher highs and higher lows. The volume often increases as more participants enter the market.
Technical Indicators: Moving averages typically start to slope upward, and momentum indicators like the RSI often move into overbought territory, though they can stay elevated for extended periods during strong trends.
Stage 3: Distribution (Consolidation)
Description: After a significant rise in price, the stock enters another consolidation phase. This is where the stock price begins to level off after the uptrend, as early investors and institutions start to take profits.
Market Sentiment: Mixed to cautious. Some participants are still bullish, while others are looking to exit.
Price Action: The stock may trade within a range, similar to Stage 1, but typically at a higher price level. The volatility might increase as the market tries to determine the next direction.
Technical Indicators: Indicators like the RSI may show divergence (price making new highs while RSI makes lower highs), signaling weakening momentum. Volume might increase as selling pressure begins to meet or exceed buying pressure.
Stage 4: Mark Down (Bearish) or Markup (Bullish)
Description: This stage can diverge into two different directions:
Bearish (Markdown): If the stock breaks down from the Stage 3 consolidation range, it enters a downtrend. Selling accelerates as more investors look to exit, leading to a decline in the stock price.
Bullish (Further Markup): Alternatively, the stock might resume its upward movement, leading to another rise if the overall market conditions remain favorable and demand continues.
Market Sentiment:
Bearish: Sentiment turns negative, with increasing fear and pessimism.
Bullish: Sentiment remains positive, driven by continued optimism or external factors like strong earnings reports.
Price Action:
Bearish: The stock makes lower lows and lower highs, confirming the downtrend.
Bullish: The stock breaks out of the range to the upside, continuing its uptrend.
Technical Indicators:
Bearish: Moving averages may cross downward (e.g., the "death cross"), and RSI can drop into oversold territory.
Bullish: Moving averages continue to trend upwards, and RSI can remain in overbought territory.
Cycle Repeats:
Once Stage 4 completes, the cycle can begin a new. After a markdown (bearish phase), the stock might enter another accumulation (consolidation) phase as the price stabilizes, setting the stage for a new potential uptrend. Conversely, if the stock continues to rise in the bullish scenario, it may eventually enter a new distribution phase at a higher level.
Understanding these stages helps traders and investors to anticipate potential moves in the market, allowing them to position themselves accordingly.

IDFC FIRST BANKI am posting this idfc first bank chart third time, idfc bank in 4th elliot wave as per bigger time frame chart it will need to form 5th wave.
we can see a corrective wave of abc to form 5th wave so I am sharing two cases in this script:
- in 1st case if last low doesn't broken it will come around 71.35 then it will go around 95 target
- in second case it will go below last low around 69 levels then it will go around 88 levels, it will give breakout of 84 zone
Thanks

IDFC FIRST BANKIdfc first bank is consolidating from long time in a range or we can flag and pole in long term, currently idfc is making second wave or resistance becoming support for this share.
If this can happen we can see 88 in idfc first bank as breakout of this structure or abcd pattern
Thanks
