MARUTI SUZUKI INDIA LTD.MARUTI SUZUKI INDIA LTD.
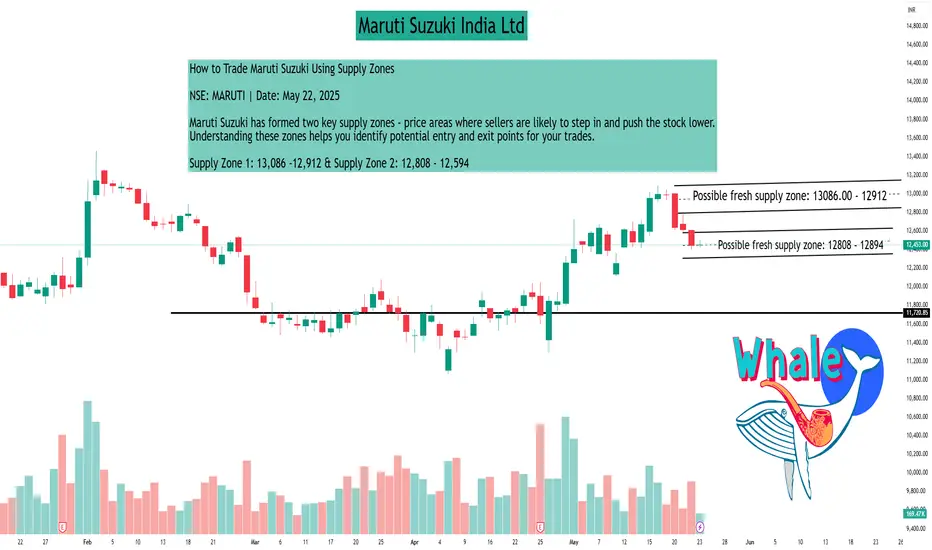
How to Trade Maruti Suzuki Using Supply Zones
NSE: MARUTI | Date: May 22, 2025
Maruti Suzuki has formed two key supply zones - price areas where sellers are likely to step in and push the stock lower. Understanding these zones helps you identify potential entry and exit points for your trades.
Supply Zone 1: 13,086 -12,912 & Supply Zone 2: 12,808 - 12,594
Bearish Scenario:
Maruti is currently trading near 12,445, below both identified supply zones. Recent price action shows a strong bearish candle accompanied by above- average volume, indicating active selling pressure around these resistance levels. If the price continues to remain below 12,800, selling pressure may persist. Traders could consider cautious short-selling strategies either at current levels or wait for the price to move back into the supply zones for confirmation before initiating short positions. It is important to follow proper risk management practices, including placing stop-loss orders above the supply zones, to manage potential downside risks.
Bullish Scenario:
A sustained breakout above 13,100 with strong volume confirmation would indicate that buying interest has surpassed selling pressure within the supply zones. Such a breakout may invalidate the resistance levels and signal renewed upward momentum in the stock, presenting potential opportunities for long positions. Traders may consider initiating or increasing long positions once the breakout is confirmed through price action and volume. It is important to use appropriate risk management measures, such as placing stop-loss orders below the breakout level.
For Learners:
Think of supply zones like traffic jams for bulls - when the price enters these zones, you can expect potential slowdowns or reversals unless there's strong momentum to push through. Always combine supply zone analysis with other confirmations like volume, candlestick patterns, and broader market context.
▲ Risk Management Tip: Always trade with a clearly defined stop loss. Avoid entering positions impulsively. It is advisable to start with a smaller quantity and increase your exposure only if the price action confirms the continuation of the trend. Capital protection should always be the priority.
Disclaimer
This content is created purely for educational and informational purposes. It is not intended as investment advice, stock recommendations, or trading tips. Trading and investing in the stock market involves risk. Please consult with a SEBI- registered financial advisor before making any investment decisions. The author/creator is not registered with SEBI and shall not be held responsible for any losses incurred based on this information. Always do your own research and use proper risk management.
If you found this analysis helpful, don't forget to Follow, so you never miss out on a trade-worthy setup, breakout opportunity, or valuable educational insight again. Stay updated and trade smarter!?
IDFC
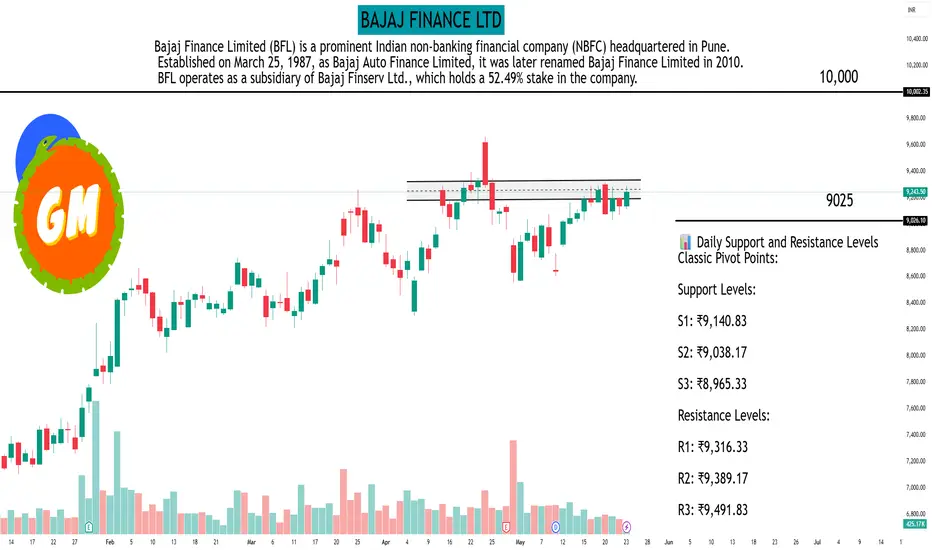
BAJAJ FINANCE LTDAs of the market close on May 23, 2025, Bajaj Finance Ltd. (NSE: BAJFINANCE) was trading at ₹9,243.50. Based on recent technical analyses, here are the key daily support and resistance levels:
📊 Daily Support and Resistance Levels
Classic Pivot Points:
Support Levels:
S1: ₹9,140.83
S2: ₹9,038.17
S3: ₹8,965.33
Resistance Levels:
R1: ₹9,316.33
R2: ₹9,389.17
R3: ₹9,491.83
Pivot Point: ₹9,213.67
Fibonacci Pivot Points:
Support Levels:
S1: ₹9,146.63
S2: ₹9,105.21
S3: ₹9,038.17
Resistance Levels:
R1: ₹9,280.71
R2: ₹9,322.13
R3: ₹9,389.17
Pivot Point: ₹9,213.67
Camarilla Pivot Points:
Support Levels:
S1: ₹9,227.41
S2: ₹9,211.33
S3: ₹9,195.24
Resistance Levels:
R1: ₹9,259.59
R2: ₹9,275.67
R3: ₹9,291.76
Pivot Point: ₹9,213.67
📈 Technical Indicators Overview
Moving Averages:
20-day EMA: ₹9,046.05
50-day EMA: ₹8,838.25
100-day EMA: ₹8,444.91
200-day EMA: ₹7,961.51
Current Price: ₹9,243.50
Interpretation: The current price is above all major moving averages, indicating a bullish trend.
Technical Summary:
Overall Rating: Strong Buy
Moving Averages: Buy
Technical Indicators: Strong Buy
🔍 Key Observations
The stock is trading above its pivot point and all major moving averages, suggesting bullish
Immediate resistance is observed around ₹9,316.33 (Classic R1), with further resistance at ₹9,389.17 (Classic R2).
Immediate support lies at ₹9,140.83 (Classic S1), with stronger support at ₹9,038.17 (Classic S2).
Please note that these levels are based on historical data and technical analysis, and actual market conditions may vary. It's advisable to use these levels in conjunction with other indicators and market news when making trading decisions.
Learn Institutional Level Trading part 6Institutional trading involves the buying and selling of financial instruments for large organizations and entities, like mutual funds, pension funds, and insurance companies, on behalf of their clients or members. These entities trade large volumes, potentially influencing market prices and liquidity.

Learn Institutional Level Trading part 3Trading institutions operate through entities which combine multiple investment funds from investors to invest in financial markets. These firms operate differently from people who maintain brokerage accounts since they oversee massive asset portfolios while their market-shaping trading volume defines their operations.

PCR Trading Strategy part 2Typically, a put-call ratio is a derivative indicator. It is designed to enable traders to determine the sentiment of the options market effectively. This ratio is computed either by factoring in the open interest for a given period or based on the volume of options trading

PCR Trading Strategy part 1The Put-Call Ratio (PCR) is a technical indicator used by traders to gauge market sentiment and identify potential trend reversals. It's calculated by dividing the total open interest of put options by the total open interest of call options. A high PCR (above 1) suggests bearish sentiment, while a low PCR (below 1) indicates bullish sentiment. Traders often use PCR as a contrarian indicator, meaning they might look to buy when the PCR is high, anticipating a reversal, or sell when it's low, expecting a downturn.

RSI and RSI Divergence RSI: Divergence appears when the RSI's highs or lows diverge from price. For example, if the price makes new lows but the RSI bottoms at higher levels, it signals bullish divergence; if the price makes new highs but the RSI peaks at lower levels, it signals bearish divergence.

Technical Concept A "technical concept" refers to a term or idea that has a specific meaning within a particular technical field, often different from its everyday meaning. These concepts are fundamental to understanding and working within that field.

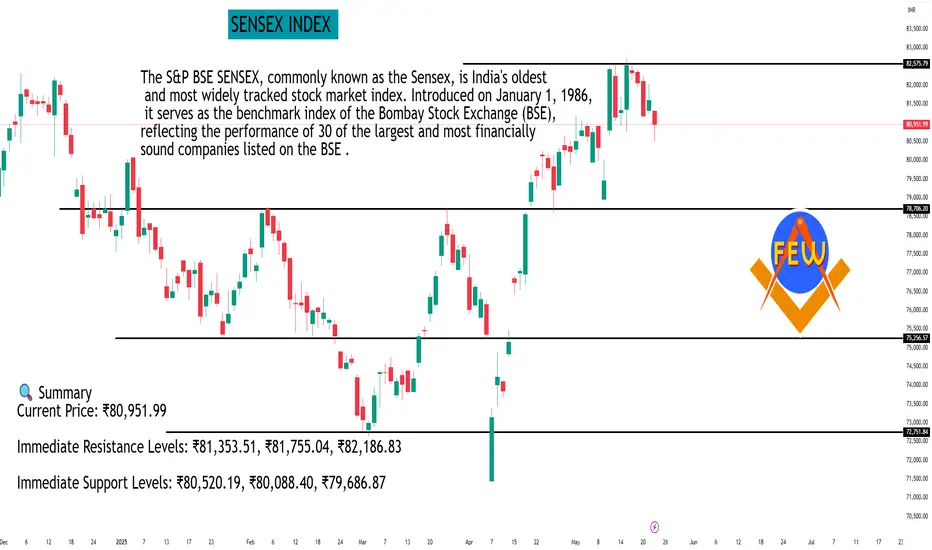
SENSEX INDEX As of the close on May 22, 2025, the BSE Sensex stood at 80,951.99, marking a decline of 0.79% from the previous session.
📊 Daily Support and Resistance Levels
Based on technical analysis, the following support and resistance levels have been identified for the BSE Sensex:
Classic Pivot Points:
Pivot Point: ₹80,921.72
Resistance Levels:
R1: ₹81,353.51
R2: ₹81,755.04
R3: ₹82,186.83
Support Levels:
S1: ₹80,520.19
S2: ₹80,088.40
S3: ₹79,686.87
Fibonacci Pivot Points:
Resistance Levels:
R1: ₹81,240.04
R2: ₹81,436.71
R3: ₹81,755.04
Support Levels:
S1: ₹80,603.39
S2: ₹80,406.72
S3: ₹80,088.40
Camarilla Pivot Points:
Resistance Levels:
R1: ₹81,028.38
R2: ₹81,104.77
R3: ₹81,181.15
Support Levels:
S1: ₹80,875.60
S2: ₹80,799.21
S3: ₹80,722.83
📈 Technical Outlook
The Sensex has entered a negative trend in the last trading session. It is considered bearish until it trades above ₹81,974 on a daily closing basis.
🔍 Summary
Current Price: ₹80,951.99
Immediate Resistance Levels: ₹81,353.51, ₹81,755.04, ₹82,186.83
Immediate Support Levels: ₹80,520.19, ₹80,088.40, ₹79,686.87
Bearish Threshold: A daily close below ₹81,974 indicates a bearish trend.
Traders should monitor these levels closely and consider broader market trends and economic indicators when making investment decisions.
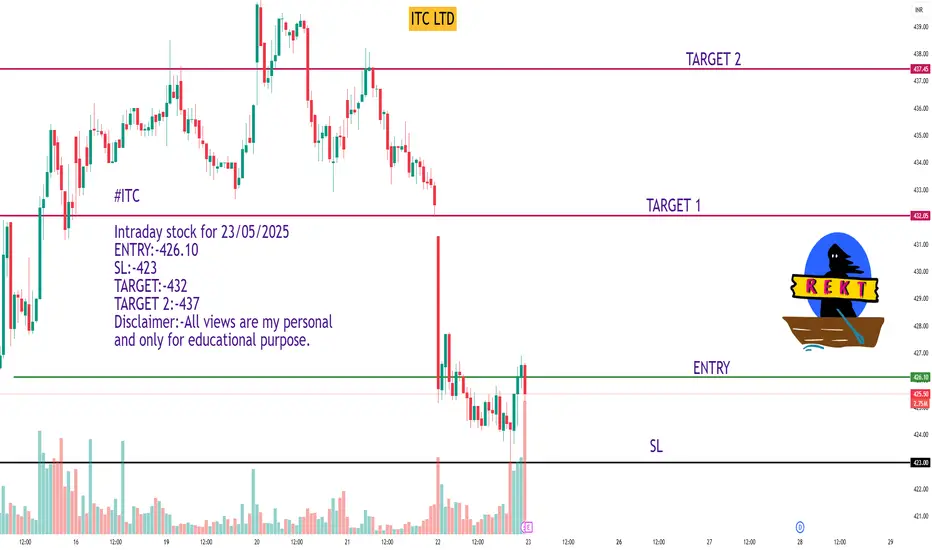
ITC LTD#ITC
Intraday stock for 23/05/2025
ENTRY:-426.10
SL:-423
TARGET:-432
TARGET 2:-437
Disclaimer:-All views are my personal and only for educational purpose.
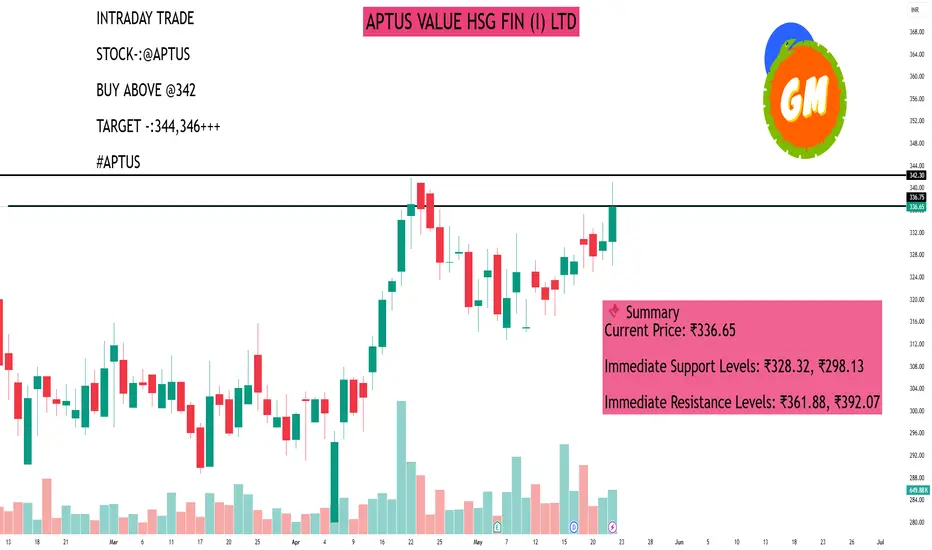
APTUS VALUE HSG FIN (I) LTDAs of May 22, 2025, Aptus Value Housing Finance India Ltd (NSE: APTUS) closed at ₹336.65, marking a 1.89% increase from the previous session.
📊 Daily Support and Resistance Levels
Based on technical analysis, the following support and resistance levels have been identified for Aptus Value Housing Finance India Ltd:
Classic Pivot Points:
Pivot Point: ₹328.32
Support Levels:
S1: ₹298.13
S2: ₹264.57
S3: ₹234.38
Resistance Levels:
R1: ₹361.88
R2: ₹392.07
R3: ₹425.63
Fibonacci Retracement Levels (from recent downtrend):
Resistance Levels:
23.6%: ₹319.49
38.2%: ₹323.75
50%: ₹327.20
61.8%: ₹330.65
76.4%: ₹334.91
📈 Technical Indicators Overview
Relative Strength Index (RSI): 43.56 (indicates a bearish trend)
Stochastic RSI: 11.05 (oversold condition)
MACD: 0.47 (bullish crossover)
Average Directional Index (ADX): 31.01 (indicates a strong trend)
Commodity Channel Index (CCI): -165.91 (suggests the stock is oversold)
📌 Summary
Current Price: ₹336.65
Immediate Support Levels: ₹328.32, ₹298.13
Immediate Resistance Levels: ₹361.88, ₹392.07
Given the current technical indicators and support/resistance levels, traders should exercise caution. Monitoring the stock's movement around these key levels can provide insights into potential trading opportunities. It's advisable to consider these technical factors in conjunction with broader market trends and fundamental analysis before making investment decisions.
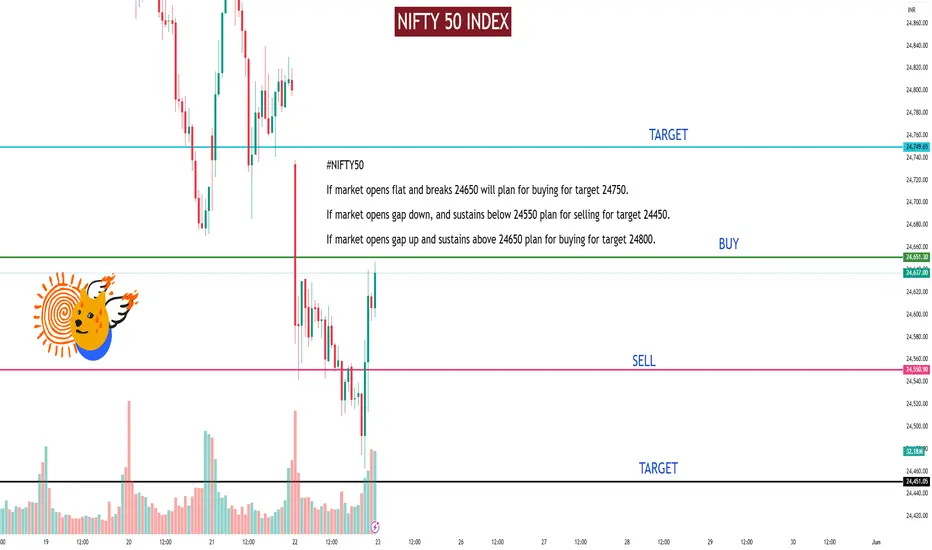
NIFTY 50 INDEXPre Market analysis for 23/05/2025
#NIFTY50
If market opens flat and breaks 24650 will plan for buying for target 24750.
If market opens gap down, and sustains below 24550 plan for selling for target 24450.
If market opens gap up and sustains above 24650 plan for buying for target 24800.
Disclaimer:-All views are my personal and only for educational purpose.
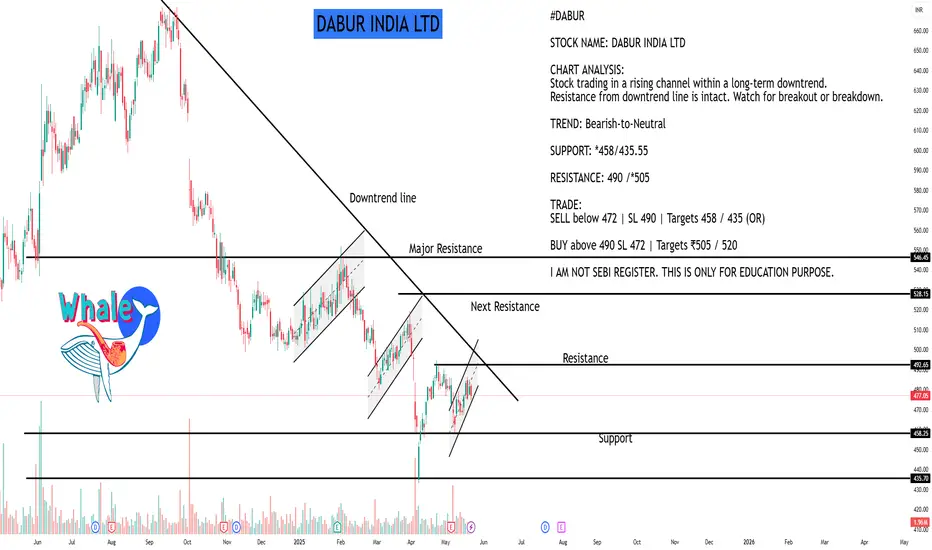
DABUR INDIA LTDAs of May 22, 2025, Dabur India Ltd (NSE: DABUR) closed at ₹477.05, reflecting a 0.98% decline from the previous session.
📊 Daily Support and Resistance Levels
Based on technical analysis, the following support and resistance levels have been identified for Dabur India Ltd:
Classic Pivot Points:
Pivot Point: ₹476.48
Support Levels:
S1: ₹474.61
S2: ₹473.23
S3: ₹471.36
Resistance Levels:
R1: ₹477.86
R2: ₹479.73
R3: ₹481.11
Additional Support and Resistance Levels:
Support: ₹470.28, ₹473.67, ₹478.38
Resistance: ₹481.77, ₹486.48, ₹489.87
📈 Technical Indicators Overview
The current technical indicators suggest a bearish outlook for Dabur India Ltd:
Relative Strength Index (RSI): 43.56 (indicates a bearish trend)
Stochastic RSI: 11.05 (oversold condition)
MACD: 0.47 (bullish crossover)
Average Directional Index (ADX): 31.01 (indicates a strong trend)
Commodity Channel Index (CCI): -165.91 (suggests the stock is oversold)
📌 Summary
Current Price: ₹477.05
Immediate Support Levels: ₹474.61, ₹473.23, ₹471.36
Immediate Resistance Levels: ₹477.86, ₹479.73, ₹481.11
Given the current technical indicators and support/resistance levels, traders should exercise caution. Monitoring the stock's movement around these key levels can provide insights into potential trading opportunities. It's advisable to consider these technical factors in conjunction with broader market trends and fundamental analysis before making investment decisions.
Institution Trading Strategies part 5Institutional traders incorporate strategies that emphasize both long-term value and diversification in their trading practices. They leverage significant amounts of capital to build portfolios diversified across multiple assets, which helps reduce risk while seeking improved market prices.

Institution Trading part 4Institutional trading involves the buying and selling of large quantities of financial assets, typically conducted by institutional investors like hedge funds, mutual funds, and pension funds. These entities manage money for others and trade in securities, including stocks, bonds, and derivatives.

Support and Resistance part 2Support is a price point below the current market price that indicate buying interest. Resistance is a price point above the current market price that indicate selling interest. S&R can be used to identify targets for the trade. For a long trade, look for the immediate resistance level as the target.

Basic to Advance Trading The very best way to get into trading is to find a platform you trust, learn as much as you can about trading beforehand and then practise to get your skill, technique and strategies right. Thereafter, all that remains to be done is to create a trading plan and open a live account.

Put and Call RatioThe put-call ratio (PCR) is a technical indicator in options trading that reflects the overall sentiment of the market. It compares the volume of put options traded to the volume of call options traded. Put options give the holder the right to sell an asset at a specific price, while call options give the right to buy it.

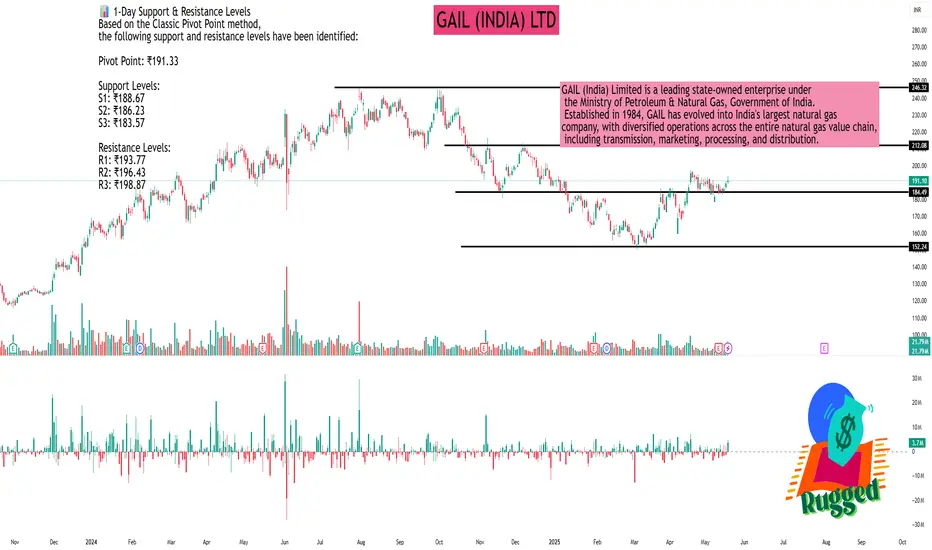
GAIL (INDIA) LTDAs of May 21, 2025, GAIL (India) Ltd. (NSE: GAIL) is trading at ₹191.10, reflecting a 0.86% increase from the previous close.
📊 1-Day Support & Resistance Levels
Based on the Classic Pivot Point method, the following support and resistance levels have been identified:
Pivot Point: ₹191.33
Support Levels:
S1: ₹188.67
S2: ₹186.23
S3: ₹183.57
Resistance Levels:
R1: ₹193.77
R2: ₹196.43
R3: ₹198.87
📈 Technical Indicators
Relative Strength Index (RSI): 60.63 – Indicates bullish momentum.
MACD (12,26): 1.34 – Suggests a bullish crossover.
Average Directional Index (ADX): 35.59 – Reflects a strong trend.
Commodity Channel Index (CCI): 48.46 – Neutral.
Rate of Change (ROC): 2.75 – Positive momentum.
Money Flow Index (MFI): Not specified.
📉 Moving Averages
50-day EMA: ₹226.29
200-day EMA: Not specified.
The current price is below the 50-day EMA, indicating a potential bearish trend in the short term.
🔍 Market Outlook
GAIL (India) Ltd. is exhibiting mixed signals. While technical indicators like RSI and MACD suggest bullish momentum, the stock trading below its 50-day EMA indicates caution. Traders should monitor the support and resistance levels closely; a breach above R1 (₹193.77) could indicate further upside, while a drop below S1 (₹188.67) might suggest a potential decline.
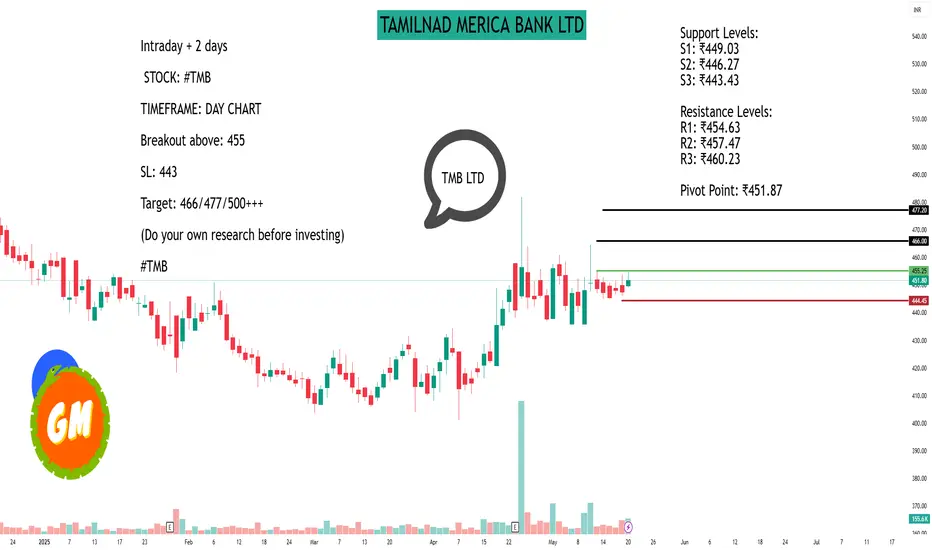
TAMILNAD MERICA BANK LTDAs of May 21, 2025, Tamilnad Mercantile Bank Ltd. (NSE: TMB) is trading at ₹451.80, reflecting a 0.97% increase over the previous day.
📊 1-Day Support & Resistance Levels (Classic Pivot Method)
Based on the previous trading day's price range, the following support and resistance levels have been identified:
Support Levels:
S1: ₹449.03
S2: ₹446.27
S3: ₹443.43
Resistance Levels:
R1: ₹454.63
R2: ₹457.47
R3: ₹460.23
Pivot Point: ₹451.87
📈 Technical Indicators
Moving Averages:
20-day EMA: ₹444.47
50-day EMA: ₹437.38
100-day EMA: ₹438.24
200-day EMA: ₹446.85
Oscillators:
Relative Strength Index (RSI 14): 58.01 (indicates uptrend)
Commodity Channel Index (CCI 14): 62.68 (indicates uptrend)
Money Flow Index (MFI): 74.25 (indicates strong uptrend)
🔍 Trading Insights
The current price is slightly below the pivot point, suggesting a neutral to slightly bullish stance. If the price moves above the pivot point, it may test the resistance levels. Conversely, a drop below the pivot could lead to testing the support levels.
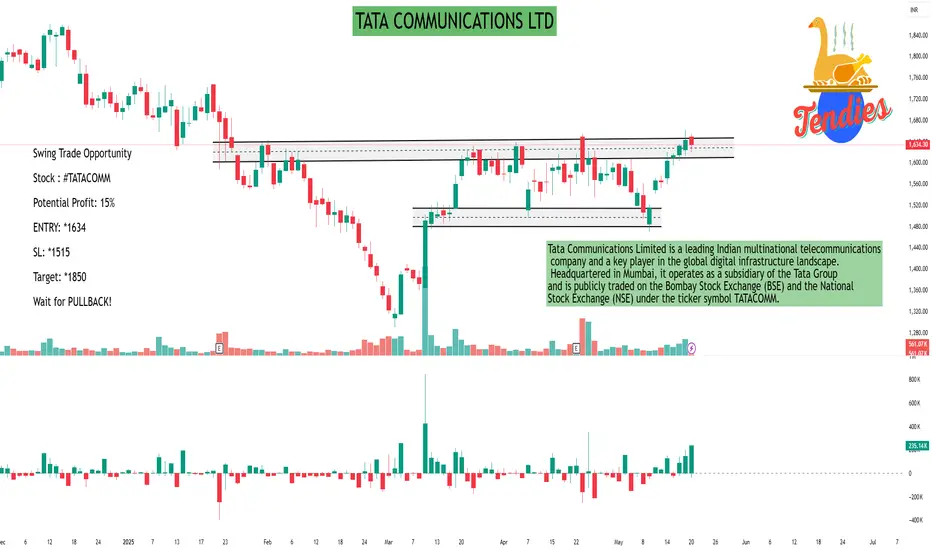
TATA COMMUNICATIONS LTDTata Communications Limited is a leading Indian multinational telecommunications company and a key player in the global digital infrastructure landscape. Headquartered in Mumbai, it operates as a subsidiary of the Tata Group and is publicly traded on the Bombay Stock Exchange (BSE) and the National Stock Exchange (NSE) under the ticker symbol TATACOMM.
🏢 Company Overview
Founded: 1986 as Videsh Sanchar Nigam Limited (VSNL); rebranded to Tata Communications in 2008.
Ownership: Majority-owned by Tata Group (58.87%), with the remaining shares held by public investors.
Global Reach: Operates in over 190 countries and territories, carrying approximately 30% of the world's internet routes.
Leadership:
MD & CEO: Amur Lakshminarayanan
Chairperson: Renuka Ramnath
🌐 Services & Solutions
Tata Communications positions itself as a digital ecosystem enabler, offering a comprehensive suite of services:
Network & Connectivity: Global IP networks, Ethernet, MPLS, and SD-WAN solutions.
Cloud & Edge Computing: Multi-cloud connectivity, edge computing platforms, and managed cloud services.
Cybersecurity: Advanced threat detection, cloud security, and managed security services.
Unified Communications: Solutions like GlobalRapide and JAMVEE for seamless collaboration.
IoT & Mobility: IoT connectivity solutions, including LoRaWAN and private networks.
Content Delivery: Robust CDN services for optimized content delivery.
These offerings cater to diverse industries, including automotive, manufacturing, logistics, aviation, and retail.
📈 Financial Highlights
In the first quarter of fiscal year 2024, Tata Communications reported:
Revenue: ₹56.33 billion (approx. $673.4 million), marking an 18% year-over-year increase.
Data Services Growth: 20% rise, contributing over 80% to total revenue.
Digital Portfolio Expansion: 52% growth, driven by increased demand for digital services.
Net Profit: ₹3.33 billion, a 13% decline due to a 20% rise in expenses.
EBITDA Margin: Contracted to 20% from 21.5% the previous year.
The company aims to achieve data business revenue of ₹280 billion by FY27, up from ₹178.98 billion in FY24.
🔄 Strategic Initiatives
Acquisition of Kaleyra: In October 2023, Tata Communications acquired Kaleyra, a Communications Platform as a Service (CPaaS) company, enhancing its capabilities in cloud communications and customer engagement.
Infrastructure Expansion: Continues to invest in subsea cable systems, including the Tata Global Network, to strengthen global connectivity.
Digital Transformation Focus: Emphasizes enabling digital transformation for enterprises, supporting borderless growth and innovation.
USHA MARTIN LTD.USHA MARTIN LTD.
USHA MARTIN BREAKS OUT! 7.5% SURGE SIGNALS MASSIVE RALLY AHEAD
USHAMART
Made Beautiful Chart Structure of Kinda Triple Bottom Reversal Pattern today after Q4 Results with Good Price and Volume action and Breaking the Trendline.
Price Action:
-The stock has been in a downtrend since November 2024, forming a clear descending resistance line (white diagonal Trendline)
-Currently showing strong breakout momentum at ₹334.85, up *23.75 (+7.46%) in today's session
-Successfully broken above both the downtrend line and horizontal resistance at *320-325
-Multiple tests of support at the *290 level have created a solid base for the current rally
-Higher lows forming since March indicate increasing buying pressure
Volume Analysis:
- Today's volume at 4.98M shares vs. average of 688.65K (over 7x normal volume) -Previous support bounces (green arrows) also occurred with increased volume - Extremely high volume on today's breakout confirms strong institutional interest - Volume profile shows healthy accumulation during support tests
Key Support and Resistance Levels:
- Strong support established at *290 level (green horizontal line)
- Intermediate resistance/support at *320-325 (lower red horizontal line)
-Major resistance at *350 level (upper red horizontal line)
- The previous rejection point at ₹350 (red arrow) now becomes the next target
- Long-term resistance from October to December 2024 around *420
Technical Patterns:
1. Downtrend Line Breakout*- Price has decisively broken above the multi-month downtrend line
2. Kinda Triple Bottom- Formed at ₹290 level (February-May), creating a solid foundation
3. Ascending Triangle- Recent price action shows higher lows against horizontal resistance
4. Volume Confirmation- Massive volume spike validates the technical breakout
5. Bullish Engulfing Candle-Today's price action engulfs previous bearish candles
Trade Setup:
- Pattern: Downtrend line breakout + horizontal resistance break
- Confirmation: Strong price action with 7x normal volume
- Context: Potential trend reversal after extended downtrend and base formation
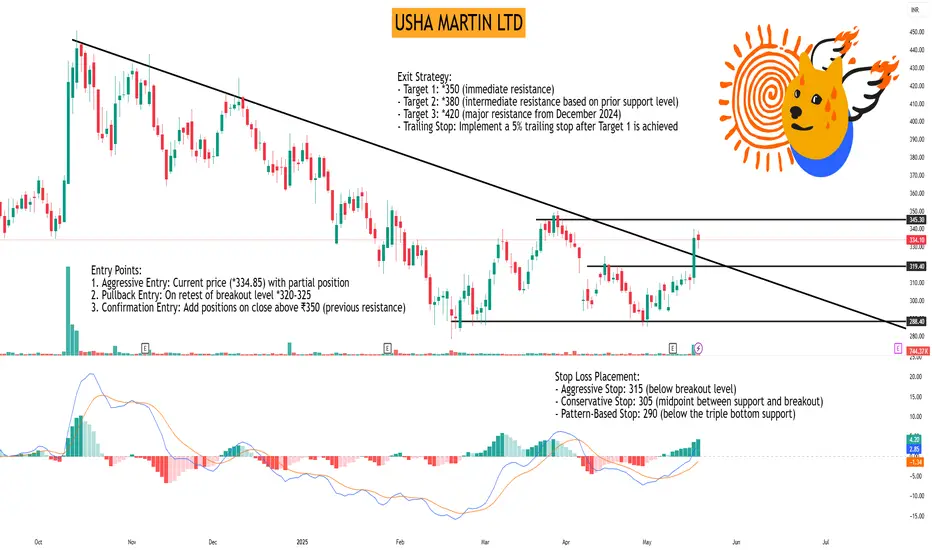
Entry Points:
1. Aggressive Entry: Current price (*334.85) with partial position
2. Pullback Entry: On retest of breakout level *320-325
3. Confirmation Entry: Add positions on close above ₹350 (previous resistance)
Exit Strategy:
- Target 1: *350 (immediate resistance)
- Target 2: *380 (intermediate resistance based on prior support level)
- Target 3: *420 (major resistance from December 2024)
- Trailing Stop: Implement a 5% trailing stop after Target 1 is achieved
Stop Loss Placement:
- Aggressive Stop: 315 (below breakout level)
- Conservative Stop: 305 (midpoint between support and breakout)
- Pattern-Based Stop: 290 (below the triple bottom support)
Risk Management:
- Position sizing: Limit risk to 1-2% of trading capital
-Risk-reward ratio: Maintain at least 1:1.5 (with aggressive stop)
- Consider scaling in: 50% at current level, 25% on pullback, 25% on further confirmation
- Scale out: 30% at Target 1, 40% at Target 2, hold remainder with trailing stop
Today's powerful breakout on record volume after forming a kinda triple bottom pattern suggests a potential trend reversal. The breakout above both the descending trendline and horizontal resistance provides a compelling technical case for upside continuation. If the stock can maintain momentum above the *325 level, it could target the next resistance at ₹350 quickly, with potential for a move toward *380-420 in the coming weeks.
Keep in the Watchlist.
NO RECO. For Buy/Sell.
Thank you for exploring my idea! I hope you found it valuable.
FLLOW for more
BOOST if useful
COMMENT below with your views.
Meanwhile, check out my other stock ideas on the right side until this trade is activated. I would love your feedback.
Disclaimer: "I am not a SEBI REGISTERED RESEARCH ANALYST AND INVESTMENT ADVISER."
This analysis is intended solely for informational and educational purposes and should not be interpreted as financial advice. It is advisable to consult a qualified financial advisor or conduct thorough research before making investment decisions.
DIVI S LABORATORIES LTDDIVI S LABORATORIES LTD
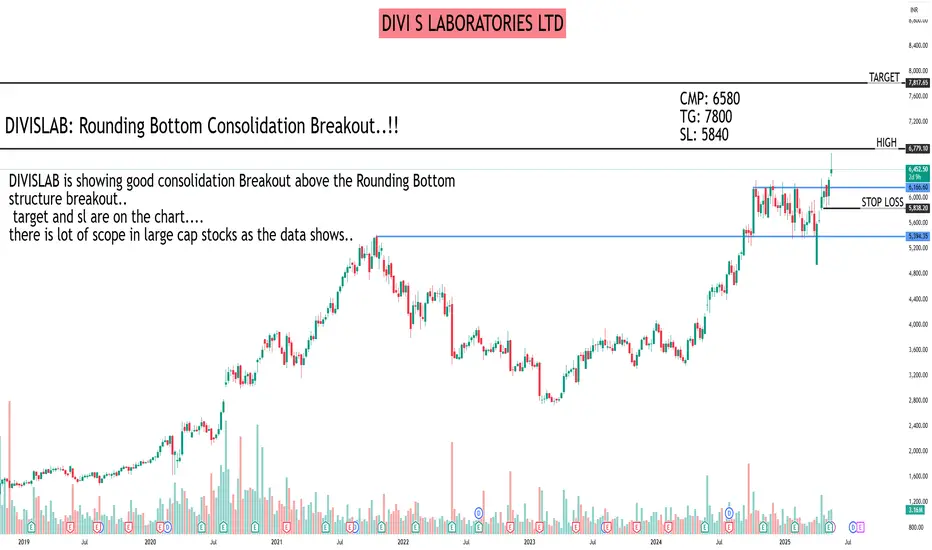
DIVISLAB: Rounding Bottom Consolidation Breakout..!!
DIVISLAB is showing good consolidation Breakout above the Rounding Bottom
structure breakout..
target and sl are on the chart....
there is lot of scope in large cap stocks as the data shows..
All data is available in public domain..
CMP: 6580
TG: 7800
SL: 5840
Stock's selection based on 5 Point Analysis:
1: Idea : Breakout.
2: Support: Volume, Delivery.
3: Technical: 21/55/200-EMA, Super trend up, RS>0 RSI.
4: Fundamental: PE, PAT, Industry & peer PE and sector performance.
5: Timing: Entry Timing on Daily chart.
Disclaimer: It is my personal view as a trader and for educational purpose only. Equity market involves risk.
Please consult your financial adviser before taking any decision.
Disclosure: might be Hold