IEX

19/10/2021 Research Report For IEXDisclaimer:
I am not SEBI registered person and this is not an investment advice and also please note this is only for education purpose. Also note we can use this research for my own portfolios. So don't influence yourself by this research. Please note before investing according to this educational research, please do your own research and also do take advice from your financial adviser before invest any single rupee. Your any profits and loss are totally your liability. No one is liable for that. Also, please note we will not never compensate your any loss. So before investing any single rupee, please do your own research according to your risk taking capacity and after that do invest and book profits on right time.
Buy at C.M.P (Current Market Price)
Target 1: 1000

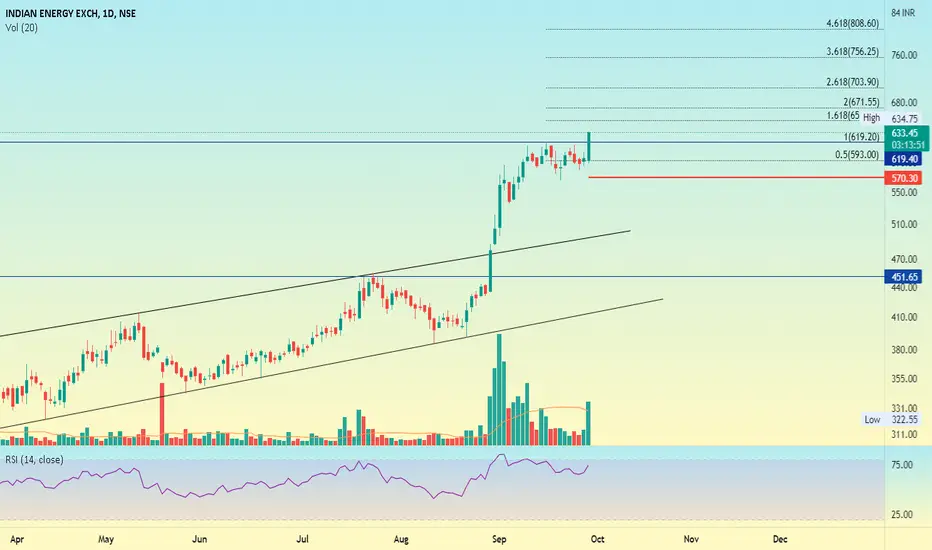
IEX Daily Time Frame Analysis Next Rally or CorrectionIEX Daily Time Frame Analysis Next Rally or Correction
- So IEX has given a good rally again and now resting it is a good resting zone for it before breaking into 3 digit numbers
- It can play in the range of 750-800 for a while making a strong base
- Lookout for volume when it is crossing 810 to ride a good rally
- As long wicks are showing there is a good fight between bulls and bears
- A good news can push it up
KEEP YOUR EYE ON IT
*NOT AN INVESTMENT ADVICE JUST MY VIEWS*


IEX DAILY TIME FRAME ANALYSISIEX DAILY TIME FRAME ANALYSIS
- Giving Good Moves for past 2 months
- Good Monopoly Market
- Good For long term investment
- Doing base formation for past few days breaking it would lead it to 700-800
- Good Support of 600
*Not an investment advice just my views*


IEX Given Breakout and it is at ALL high timeIEX Given Breakout and it is at ALL high time
one can go long with small stoploss.

IEX - On supportIEX is now on one of its recent supports.. Can be watched for quick scalping opportunity.


IEX FRESH BREAKOUTAnother breakout in our evergreen stock IEX. buy above the horizontal line and follow the targets. As said before, my final target for IEX IS 1000.
IEX looks good for swingIEX (Indian Energy Exchange)
- Swing High Breakout - ✔
- Good Breakout Volumes - ✔
- Huge Accumulation & Price activity a few days before - ✔
- Spread Chart Breakout - ✔
- RS+ & Strong Relative Strength - ✔
Other points to note:
The new Electricity (Amendment) Bill 2021 delicenses State Monopoly on Electricity. Which is now open to competition from all private Electricity Distribution Companies. Consumers can now choose their Discom (like telcos)
Along with the boost in Electricity Distributor's business, it will also boost revenues for IEX.
Looks good for swing & Positionally


IEX any time breakout expected The stock is consolidating in the present price zone since few days and is expected to give breakout very soon.
See charts for the targets!!


IEX Res Breakout Risk Reward 1:2BUY CMP
SL-596
TGT- 654
TAKE MIN RISK REWARD 1:2
Disclaimer: This is for demonstration and educational purpose only. This is not buying or selling recommendations. I am not SEBI registered. Please consult your financial advisor before taking any trade.

IEX pre-market intraday analysis and setup🎇Hello Traders👋
Today i have made a post on IEX 15m
I hope you find this post helpful and informative👍
The targets and stoploss would be given in the charts or they would be according to pivot points
Thank You
—DISCLAIMER—
I am not a SEBI registered financial advisor
Please consider your consultant's advise a must , all the setups posted here will be considered as informative and helpful post
I shall not be responsible for your profits and losses

#indianenergyexchange #IEX momentum breakout#indianenergyexchange #IEX momentum breakout
more than 25% breakout on this stock with big volumes.
momentum is bullish on all timeframe though with diluted divergences seen on weekly

How to identify Breakout - Price ActionFor the purpose of demonstrating how one can identify a trend change using Support - Resistance and Price Action, I have taken the daily chart of IEX. I had also identified and posted about it before the recent rally.
The first step is to establish a clear support and resistance line. In case of a breakout, I like to keep my target at around the same price difference range between old support and old resistance after it bounces from the resistance.
The crucial thing lies in identifying the candlestick pattern around the support - resistance. In our case, when the price first hit the resistance, it formed a clear Bearish Engulfing and the next time, it formed a healthy dark cloud cover followed by an engulfing. These are clear red flags when a trader should start booking profits.
Similair bullish patterns can be identified at support region like the Morning Star pattern as in the above chart.
In order for the price to give a breakout, Volume & Momentum play a very crucial role. A rising volume with price rise builds momentum, and increases the chances of a breakout. Another important observation is to see HOW STRONG did the PRICE BOUNCE from the support. Long wicks, very less or almost no consolidation around the support and a bounce back from an area above the support instead of retracing all the way back to the support are clear indications of trend reversal from Bearish to Bullish.
Also notice how the candle formed a Morning Star during the bounce, this further strengthens our conviction that the trend is changing.
Observe how the red candles grow smaller and smaller as they approach support, this indicates weakening of the bearish momentum.
Also the Resistance was approached in a very aggressive foray this time with clear long green candles indicating a very strong pent up demand.
I hope this analysis provides some insight into how the Price action gives an early indication of the future price movement.
Thanks for reading! Keep Learning :)

IEX - 2 BREAKOUTS IEX is a monopoly business and breakout in this stock should not be missed. today's volume was highest ever recorded after the listing day. a long run is expected in this one. my final target would be 1000


IEX - Indian Energy Exchange Fresh Break Out above 454 Hello Everyone,
IEX (Indian Energy Exchange) stocks given a strong break out today above 454 levels and sustained. Now the stock is expected to move towards 560-580 levels in short to medium term as the stock is in continuous uptrend and short term correction already happened in this counter. The stock is best buy at CMP and below till the breakout levels for getting the projected levels.
Only For Educational Purpose.

Trend Support Bounce IEX has completed a MACD cross and EMA 9,21 cross. It also bounched off a healthy trend support line. Hoping to see some upside here

