Nifty – Complex Corrective Structure on Lower Timeframe (ElliottThe attached chart illustrates a developing complex correction in Nifty on the lower timeframe, with multiple flat structures and a terminal impulsive sequence.
Wave (a) – Flat Correction
Wave (a) (marked in red) unfolds as a classic flat, where the internal (A)–(B)–(C) subdivision (in blue) follows a 3–3–5 structure. The retracement in wave (B) is relatively deep, consistent with flat correction behavior.
Wave (b) – Flat Correction
Wave (b) again resolves as a flat correction, reinforcing the sideways and overlapping nature of the broader corrective phase. Price action during this segment remains choppy, typical of corrective markets.
Wave (c) – Five-Wave Impulse
Wave (c) progresses as a clear five-wave impulse, adhering to Elliott Wave principles:
Wave 1: Initiates the bullish leg from the wave (b) low.
Wave 2: Forms a flat correction, providing a controlled retracement without violating wave-1 origin.
Wave 3: Extends impulsively, showing strong momentum and range expansion.
Wave 4: Develops as an expanding triangle (A–B–C–D–E), indicating volatility expansion and time correction.
Wave 5: Concludes with an impulsive push to complete wave (c).
Overall View
The structure suggests a mature corrective pattern composed of multiple flats and a final impulsive leg. Such formations often precede either a higher-degree trend resumption or a larger consolidation. Traders should be mindful of false breakouts and overlapping moves, as complex corrections can remain range-bound longer than expected.
Impulsewave

ETERNALHello & welcome to this analysis
A 3 years bull run could be coming to an end near 350-375 as it completes its 5 impulse waves.
This would be followed by wave 2 - ABC corrective retracement.
The view would be incorrect if it continues to rally beyond 400
All the best

GOLD@ 3890 : Bubble Peak or Just a Pit-Stop?Pullback vs. Correction The 100th-Idea Deep Dive !!
Gold has moved almost 88% in the last two years to new records. The main drivers are falling real yield expectations with an easing bias, persistent geopolitical risk, record central bank buying and the 2025 rebound in ETF demand.
Geopolitics is shifting as Washington pushes for a Gaza ceasefire. Headlines talk about partial acceptance and ultimatums but nothing is done yet. The war premium can fade step by step though headline shocks will still remain.
Key levels:-
Resistance 3890–4000
Pullback zone 3640–3650 (5%)
Correction zone 3475–3480 (11%)
Weekly RSI stretched into high 70s and 80s → risk of mean reversion before any bigger change.
Macro gears:-
Real yields and the dollar:-
Lower real yields = higher gold. That is the key lever. As rate cuts and softer real rates were priced into 2025, gold repriced hard.
Central bank sponsorship:-
Official demand has been consistent three years in a row. 2022 at 1082t, 2023 at 1037t, 2024 at 1045t. This is rare in modern data and explains why dips are shallow.
ETF flows:-
After outflows in 2024, 2025 turned. Three straight months of inflows into August, strongest since 2020, YTD around 588t. Pure fuel ✨
Geopolitics & the premium:-
From 2023 to 2025 Middle East risk kept term premia elevated. Now Gaza peace talks open a path for that premium to fade. But timelines and enforcement are unclear. Strikes still came even with peace headlines. Means the bleed can be gradual but headline spikes remain..
Pullback or true correction:-
3890–4000 is the confluence zone. Psychological milestone + vertical extension after 88% impulse. Bubble behavior meets supply.
Level 1 at 3640 → about -5% pullback. If bids hold, trend resumes.
Level 2 at 3470→ -10 to -12% wash into prior shelf. Would be first real reset in two years.
Weekly momentum overbought. Phases like this don’t end instantly but forward returns improve after reset.
Flows @ CBs rarely chase tops, they buy weakness across months. That softens drawdowns.
ETFs are flighty. Peace plus firmer yields can stall inflows. Any Fed pivot or growth wobble can flip them back fast.
Possible future paths :-
Continuation bubble :- Break 3900 → 4050–4200
Triggers dovish Fed, softer yields, failed peace, ETF flows
Tactic = only add above 3900 on daily/weekly close. No chasing wicks.
Shallow pullback :-Tag 3630–3660 then rotate
Triggers peace holds, modestly firm yields, demand returns
Tactic = scale in near 3640–3650 if H4 shows higher low + reclaim POC. First TP 3780–3820.
True correction :- flush 3520–3460
Triggers Gaza settlement + real yields higher + ETF stall
Tactic = let it wash. Look for capitulation + basing 3480–3460. Best R:R after failed bounce and reclaim.
Levels & invalidation:-
Bull continuation pivot 3890–3900. Opens 4050–4200.
Pullback buy zone 3630(Hvz)–3650 with confirmation. Invalidation H4 <3600.
Correction buy zone 3480 ±20 after basing. Invalidation weekly <3420 → opens 3300–3350.
If flat → stagger entries and size carefully.
If long from lower → trail under last daily HL, book partial 3880–3950.
Surprise risk (Imp) ETF squeeze higher – inflows still not at 2020 peak → late cycle melt-up possible.
Policy shock – faster cuts or fiscal noise sink yields = blow-off. Strong data → pop in yields = sharp air pocket.
Geopolitical whipsaw – peace unravels → $50–100 spike in thin tape!!
Bottom line:-
This is a two year vertical impulse meeting macro reality at 3890.
Level 1 = 3640–3650 pullback line.
Level 2 = 3480 correction line.
Until weekly breaks, dips are still opportunities not obituaries. But only with structure. No blind catching this high up.
Bubbles don’t end quietly – great trends reset then go again ✨
Fade euphoria into 39xx if momentum stalls. Buy fear into 348x if the market finally delivers the reset it owes.
Trade safe ⚡
Sparkrlight ♾️✨⚡

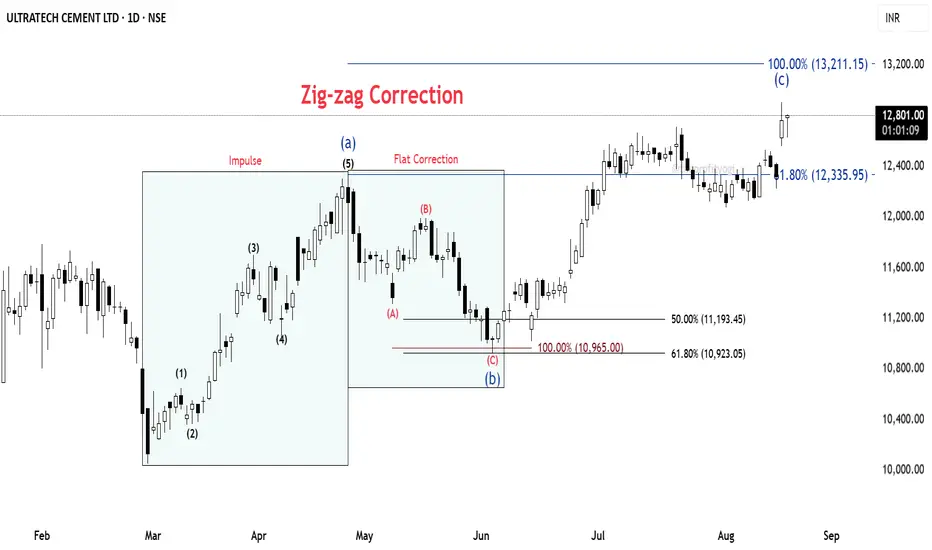
ULTRACEMCO: Wave C started from strong Fib clusterULTRACEMCO – Daily Chart Analysis
🔹 Base Point: The count begins from the low made on 3rd March 2025.
🔹 From this low, the price moved up in the form of a clear impulse wave, completing a 5-wave structure.
🔹 This was followed by a corrective fall, retracing 61.8% Fibonacci of the prior impulse.
⚡ Correction Phase:
The decline is counted as an ABC Flat correction (red).
Within this, the C wave extended fully to the 100% Fibonacci projection.
At this point, we observe a strong cluster zone formed by the 61.8% retracement and 100% extension, indicating confluence and potential support.
📈 Current Development:
From this support, the price has begun to move up again, showing the characteristics of a fresh impulse.
The overall structure fits into a larger Zig-Zag correction, where Wave C is still under development.⏳
📝 Summary:
✅ Impulse up (5 waves)
✅ Flat correction (A-B-C) complete at Fib cluster
🚀 Wave C of Zig-Zag unfolding
#ULTRACEMCO #NSEStocks #ElliottWave #Fibonacci #WaveAnalysis #TradingSetup #PriceAction
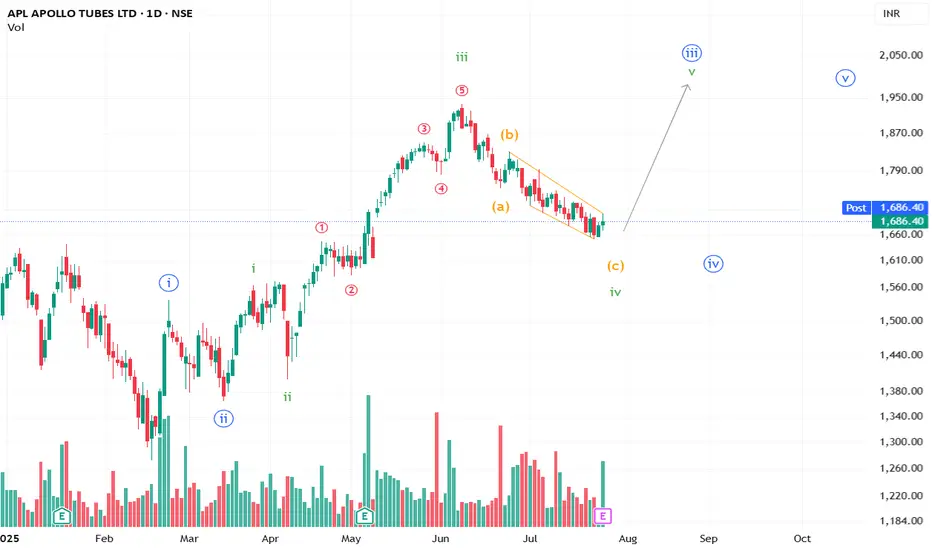
APL Apollo Tubes Limited Set to Surge?A well-formed ABC correction to the downside appears to be losing steam, and an upward move may take shape.
**This is an educational market outlook, not investment advice. Please consult a SEBI-registered advisor before taking any investment decisions.**
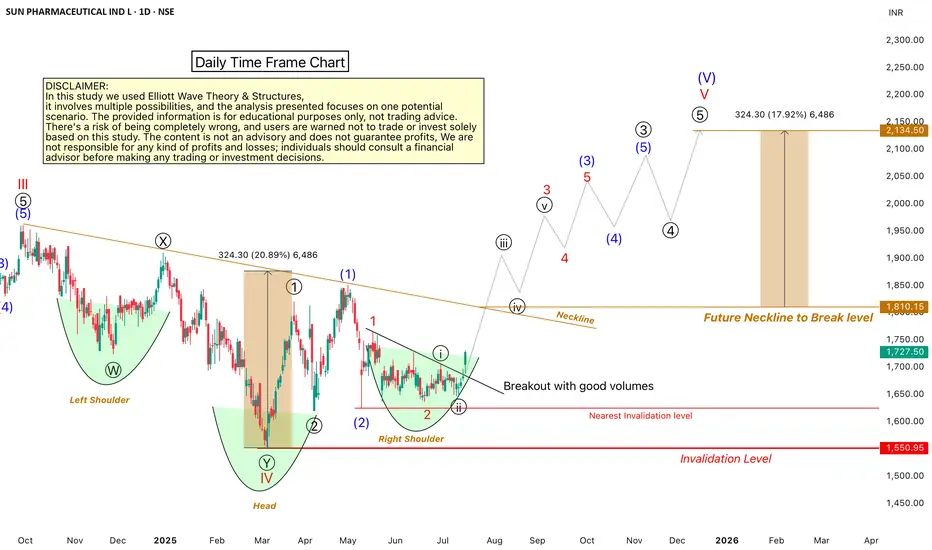
Sun Pharma: A Bullish OutlookHello Friends,
Welcome to RK_Chaarts,
Let's analyze the Sun Pharmaceuticals chart using technical analysis, specifically the Elliott Wave Theory. According to this theory, the September 2024 top marked the end of Wave III cycle degree in red, and the March 2025 bottom marked the end of Wave IV cycle degree in red Now, Wave V of cycle degree in red has begun, which will move upward.
Within Wave V, we should have five sub-divisions of Primary degree in black, with Wave ((1)) & Wave ((2)) already completed. Wave ((3)) has started, with five further sub-divisions of one lower degree intermediate degree, We've marked these in blue, with Wave (1) and Wave (2) completed, and Wave (3) started. Within Wave (3), we have minor degree waves in red, with Wave 1 and Wave 2 completed, and Wave 3 breaking out today with good intensity of volumes.
We can see that the wave counts are super bullish, and so is the RSI, which is above 60. The MACD is also positive, and the price is above the 50-day and 200-day EMAs on the daily and weekly time frames. There's no moving average hurdle, which is another super bullish sign.
We can also see a higher high and higher low formation, which is a bullish sign according to Dow Theory. Additionally, an inverted head and shoulders pattern is forming, with the right shoulder being made. When it breaks out above the neckline, it will give us a target, which aligns with the Elliott Wave Target projection.
All these indicators – technical analysis, price action, and Elliott Wave – point to a bullish trend. However, there's an invalidation level at 1550; if the price falls below this level, our wave counts will be invalidated.
We're projecting targets between 2000-2200 based on Elliott Wave theory projections. Please note that this analysis is for educational purposes only and should not be considered as investment advice.
This post is shared purely for educational purpose & it’s Not a trading advice.
I am not Sebi registered analyst.
My studies are for educational purpose only.
Please Consult your financial advisor before trading or investing.
I am not responsible for any kinds of your profits and your losses.
Most investors treat trading as a hobby because they have a full-time job doing something else.
However, If you treat trading like a business, it will pay you like a business.
If you treat like a hobby, hobbies don't pay, they cost you...!
Hope this post is helpful to community
Thanks
RK💕
Disclaimer and Risk Warning.
The analysis and discussion provided on in.tradingview.com is intended for educational purposes only and should not be relied upon for trading decisions. RK_Chaarts is not an investment adviser and the information provided here should not be taken as professional investment advice. Before buying or selling any investments, securities, or precious metals, it is recommended that you conduct your own due diligence. RK_Chaarts does not share in your profits and will not take responsibility for any losses you may incur. So Please Consult your financial advisor before trading or investing.
Nifty Mid_Select IndexHello & welcome to this analysis
From July 2022 to Sep 2024 it appears to have completed an impulse 5 waves up structure forming a Primary Wave 1
From Sep 2024 to Apr 2025 is a corrective ABC wave that has done a 38 Fibonacci retracement.
While it is too early to suggest whether that zigzag fall was a Primary Wave 2 or Wave A of B. The unfolding in the daily time frame suggest the probability of the former and start of a Primary Wave 3.
A weekly close above 13250 would increase the conviction of an impulse wave for probable levels where it could make swing highs along its path at approx 14300, 15000, 18000 & 20000.
Keep in mind where I have plotted Intermediate Wave 3 could also be an expanded Wave B. Therefore, keep an alternate count in hand till it gives more and more confirmation for bullishness.
I am going with the probability of this being a bullish structure as of now
All the best

Apollo Tyres: Navigating the WavesWelcome to RK_Chaarts.
Today, we're analysing the daily time frame chart of Apollo Tyres from Elliott waves perspective. Here, we can clearly see that the intermediate-degree Wave (3) (blue) formed a high around ₹555 in February 2024. After that, an A-B-C corrective pattern unfolded in a 3-3-5 expanded flat structure, which is Wave (4) blue intermediate-degree. We can say that Wave (4) possibly ended at the March 2025 low around ₹370.
Now, we're possibly unfolding Wave (5) in blue of the intermediate degree, which will have five sub-divisions: of minor-degree Waves 1-5 (red). Possibly, Wave 1 (red) has ended, and Wave 2 (red) is currently unfolding. After Wave 2 ends, the price may reverse upwards, forming Wave 3, followed by Wave 4's retracement and then Wave 5's high.
Where can be next possible reversal
On the weekly timeframe, the price is moving within the upper Bollinger Band zone. The weekly 20-Weekly simple moving average (or 20-week simple moving average), which is the mid-Bollinger Band, is around ₹440-₹437. It's possible that Wave 2 will find support around this level and then reverse upward.
Invalidation level
Note that Wave 2 cannot retreat more than 100% of Wave 1, according to wave theory principles. The low of ₹371, where Wave 1 began, is the invalidation level. If the price breaks below this level, it may trigger an invalidation, and we might be looking at a double correction or a double three structure instead.
Projected Targets
However, if the invalidation level holds, the upward movement will likely continue. The projected target for Wave 5 could be around ₹555-₹603, based on the ratio analysis of Waves (3) and (4).
Important Notes
- Breaking below the invalidation level would require re-evaluation of the wave count.
- Sustaining above the invalidation level increases confidence in the projected target.
Let's see how the market unfolds. This entire study is shared solely for educational purposes. Thank you so much.
I am not Sebi registered analyst.
My studies are for educational purpose only.
Please Consult your financial advisor before trading or investing.
I am not responsible for any kinds of your profits and your losses.
Most investors treat trading as a hobby because they have a full-time job doing something else.
However, If you treat trading like a business, it will pay you like a business.
If you treat like a hobby, hobbies don't pay, they cost you...!
Hope this post is helpful to community
Thanks
RK💕
Disclaimer and Risk Warning.
The analysis and discussion provided on in.tradingview.com is intended for educational purposes only and should not be relied upon for trading decisions. RK_Chaarts is not an investment adviser and the information provided here should not be taken as professional investment advice. Before buying or selling any investments, securities, or precious metals, it is recommended that you conduct your own due diligence. RK_Chaarts does not share in your profits and will not take responsibility for any losses you may incur. So Please Consult your financial advisor before trading or investing.

TTML: Unlocking Potential with Elliott WavesHello friends, Welcome to RK Chaarts.!
Let’s analyse the chart of Tata Teleservices Maharashtra Limited from an Elliott wave perspective.
We can see that in March 2023, the stock formed a bottom around 49.65 and then moved upwards in an impulse wave. We can identify wave one as complete, ending around the July 2024 high.
After that, there was a sudden fall to the April 2025 low, which we assume to be the end of wave two. We expected it to reverse around the previous low, because wave II cannot retrace more than 100% of wave I (Elliott wave principles), and Same happened, it had reversed from that low to upside.
Looking at the weekly chart, we can see that post wave II, price has broken the 0-B trend line with strong volume intensity. If our wave counts are correct, we can measure wave I and project wave III’s target using Trend based Fib extensions as per Elliott wave theory.
According to the theory, wave III target could be around 150.70, which is 1.618 times the length of wave I.
Projected Targets as per Elliott waves:
So, friends, from an Elliott wave perspective, Tata Teleservices has strong potential to move upwards to around 150 rupees, with potential targets at 88, 112, 127, and 150 rupees.
Invalidation levels:
Please note that this analysis is for educational purposes only and involves multiple possibilities. The scenario presented focuses on one potential outcome, assuming the invalidation level of 49.65 is not triggered. If it is triggered, the chart would need to be reassessed, and wave counts would need to be reevaluated.
This is not a tip or advisory, but rather a educational analysis.
I am not Sebi registered analyst.
My studies are for educational purpose only.
Please Consult your financial advisor before trading or investing.
I am not responsible for any kinds of your profits and your losses.
Most investors treat trading as a hobby because they have a full-time job doing something else.
However, If you treat trading like a business, it will pay you like a business.
If you treat like a hobby, hobbies don't pay, they cost you...!
Hope this post is helpful to community
Thanks
RK💕
Disclaimer and Risk Warning.
The analysis and discussion provided on in.tradingview.com/u/RK_Charts/ is intended for educational purposes only and should not be relied upon for trading decisions. RK_Chaarts is not an investment adviser and the information provided here should not be taken as professional investment advice. Before buying or selling any investments, securities, or precious metals, it is recommended that you conduct your own due diligence. RK_Chaarts does not share in your profits and will not take responsibility for any losses you may incur. So Please Consult your financial advisor before trading or investing.

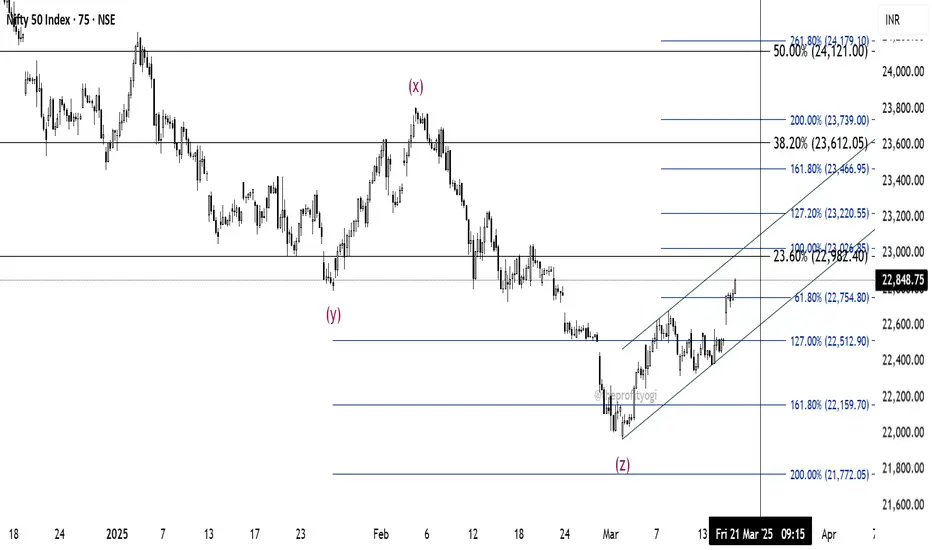
NIFTY: What's next?Nifty is moving as per our previous prediction posted on 5th March.
After making a low of 21964.60, which is the completion of wave Z, the price is moving upwards.
If this move is impulsive, the price must reach 100% level (23026.85) by 21st March.
At this level, there is a cluster of Fib retracement level of 23.6%
Further targets will be 127%, and 161.8% levels.
This analysis is based on Elliott Wave theory and Fibonacci.
This is not any buying recommendation.
For educational purposes only.
Elliott Waves Insights: Tesla’s Roadmap to SuccessHello friends, let's analyze Tesla's chart using theory. This is a 4-hour chart where we can clearly see that the higher degree, primary degree wave ((3)) in black has been completed. Currently, we're on the verge of completing wave ((4)) in black of the primary degree, which has three subdivisions marked in blue as (A), (B) & (C).
(A) and (B) are completed, and (C) is near completion. Within (C), we have five subdivisions in red, of which 1, 2, 3, & 4 are completed, and the 5th is also more than 60% complete. Once the red fifth is complete, it will mark the end of blue (C) and primary degree wave ((4)) in black.
As soon as wave ((4)) is complete, we can expect a reversal, which should be wave ((5)). Which should cross the high of wave ((3)) which is ATH, So, we're expecting wave ((5)) to start move upwards.
Now, friends, what's the invalidation level for this view? It's $139.20. This is a level that wave ((4)) should not cross, as it's the low of black wave ((2)). According to theory, wave 2 cannot retrace more than 100% of wave 1, wave 3 cannot be the shortest in impulse, and wave 4 cannot enter the territory of wave 1, which is here we’re witnessing in current scenario, which is considering we’re in any diagonal or triangle of higher degree.
If wave ((4)) crosses $139.20, it will invalidate our view. We might be missing some dots to join or create the picture perfectly. Currently, the price is around $222, and we might see a small bounce before making a lower low possibly around $200. If we witness a divergence there, it could lead to a reversal.
Please note that this study uses theory and structures, involves multiple possibilities, and focuses on one potential scenario. There's a risk of being completely wrong. This is for educational purposes only, and users should not trade or invest solely based on this study.
I am not Sebi registered analyst.
My studies are for educational purpose only.
Please Consult your financial advisor before trading or investing.
I am not responsible for any kinds of your profits and your losses.
Hope this post is helpful to community
Thanks
RK💕
Disclaimer and Risk Warning.
The analysis and discussion provided on in.tradingview.com/u/RK_Charts/ is intended for educational purposes only and should not be relied upon for trading decisions. RK_Charts is not an investment adviser and the information provided here should not be taken as professional investment advice. Before buying or selling any investments, securities, or precious metals, it is recommended that you conduct your own due diligence. RK_Charts does not share in your profits and will not take responsibility for any losses you may incur. So Please Consult your financial advisor before trading or investing.

Wave watch: Mahindra & Mahindra ltd. Technical Analysis.Mahindra and Mahindra Limited Stock Analysis using Elliott Waves
Today, we're analyzing Mahendra and Mahendra Limited's stock using Elliott Waves. In the larger time frame, we've completed waves one, two, three, and four. Currently, we're possibly in the red fifth wave.
Within the 5th wave, we have sub-divisions: black ((i)), ((ii)), ((iii)), ((iv)), and ((v)). Our analysis suggests:
- Black ((i)), ((ii)), and ((iii)) are complete
- Black ((iv))’s (a) and (b) are completed and now wave (c) is almost near to complete.
Once (c) is complete, that means black wave ((iv)) will end. Generally, wave ((iv)) doesn't cross 50% of wave ((iii))’s length. In 90% of cases, wave ((iv)) doesn't retrace beyond this level.
As black wave ((iv)) concludes, wave ((v)) will likely begin, forming a new high.
Important Notes:
- This analysis is for educational purposes only, not trading advice.
- Elliott Waves involve multiple possibilities; this analysis focuses on one potential scenario.
- Trading or investing solely based on this study involves risk.
- This content is not advisory and doesn't guarantee profits.
Remember: Elliott Wave analysis is a complex tool that requires practice and experience. It's essential to approach it with caution and always consider the potential risks involved in trading.
I am not Sebi registered analyst.
My studies are for educational purpose only.
Please Consult your financial advisor before trading or investing.
I am not responsible for any kinds of your profits and your losses.
Most investors treat trading as a hobby because they have a full-time job doing something else.
However, If you treat trading like a business, it will pay you like a business.
If you treat like a hobby, hobbies don't pay, they cost you...!
Hope this post is helpful to community
Thanks
RK
Disclaimer and Risk Warning.
The analysis and discussion provided on in.tradingview.com/u/RK_Charts/ is intended for educational purposes only and should not be relied upon for trading decisions. RK_Charts is not an investment adviser and the information provided here should not be taken as professional investment advice. Before buying or selling any investments, securities, or precious metals, it is recommended that you conduct your own due diligence. RK_Charts does not share in your profits and will not take responsibility for any losses you may incur. So Please Consult your financial advisor before trading or investing.

Is VEDL Ready to Soar? Elliott Wave Analysis Suggests YesTechnical Analysis of VEDANTA LTD. (VEDL) Based on Elliott Waves
This analysis is based on Elliott Wave theory and is for educational purposes only. It does not constitute financial advice.
Elliott Wave Analysis:
The provided chart of VEDANTA LTD. (VEDL) suggests a bullish trend based on Elliott Wave principles. The analysis identifies a potential impulse wave structure, which typically consists of five waves.
Elliott Wave Analysis Update
We're currently within Wave (3) in blue intermediate degree, with subdivisions marked as Red 1 to 5 Minor degree, Having completed Red 1 to 3, we're nearing the end of Red 4.
Key Takeaways:
1. Post-Red 4 completion, we expect an upward move to complete Red 5, targeting 1.618 Fibonacci extension (measured from Blue Wave (1).
2. Wave 5 (Red) is the final leg of Wave (3) in Blue which is of intermediate degree.
3. Overall, the outlook remains bullish.
Important Principle:
As per Elliott Wave Theory, Wave 4 cannot overlap Wave 1. This means Red 4 cannot enter the territory of Red Wave 1.
Nearest or current Invalidation Level:
If the price enters 471 (Wave 1 high), our labelled view will be negated, and we'll need to reassess the chart.
Expected Outcome:
If the invalidation level holds, our view remains intact, targeting 537 or nearby.
Actionable Insights:
- Monitor Red 4 completion
- Watch for Wave 5 unfolding
- Keep 471 as the critical invalidation level
Right Direction:
The annotation "Right Direction ↑" suggests that the overall trend is expected to be upward.
Invalidation Level:
The level of 424 is identified as an invalidation level. A break below this level would negate the bullish outlook and suggest a potential reversal.
Target:
While a specific target is not provided in the chart, a potential target for wave 3 could be around the 1.618 extension level (537.55) based on the length of wave 1. However, this is a rough estimate and subject to change based on market conditions.
Overall Outlook:
Based on the Elliott Wave analysis, VEDANTA LTD. (VEDL) appears to be in a bullish uptrend. The market is expected to continue rising, with a potential target around the 537.55 level. However, it's crucial to monitor the price action closely and be prepared to adjust the analysis if the market's behavior deviates from the expected pattern.
Remember: Elliott Wave analysis is a complex tool that requires practice and experience. It's essential to approach it with caution and always consider the potential risks involved in trading.
I am not Sebi registered analyst.
My studies are for educational purpose only.
Please Consult your financial advisor before trading or investing.
I am not responsible for any kinds of your profits and your losses.
Most investors treat trading as a hobby because they have a full-time job doing something else.
However, If you treat trading like a business, it will pay you like a business.
If you treat like a hobby, hobbies don't pay, they cost you...!
Hope this post is helpful to community
Thanks
RK
Disclaimer and Risk Warning.
The analysis and discussion provided on in.tradingview.com/u/RK_Charts/ is intended for educational purposes only and should not be relied upon for trading decisions. RK_Charts is not an investment adviser and the information provided here should not be taken as professional investment advice. Before buying or selling any investments, securities, or precious metals, it is recommended that you conduct your own due diligence. RK_Charts does not share in your profits and will not take responsibility for any losses you may incur. So Please Consult your financial advisor before trading or investing.

Technical Analysis - Elliott Waves of SBINThis analysis is based on Elliott Wave theory and is for educational purposes only. It does not constitute financial advice.
Key Observations:
Ascending Diagonal Triangle: The price action appears to be forming an ascending diagonal triangle pattern, suggesting a potential bullish breakout.
Wave Structure: The current price movement could be interpreted as an impulse wave, with a strong possibility of a fifth wave extension.
Invalidation Level: The 732.00 level acts as a critical invalidation point. A break below this level would negate the bullish outlook.
Potential Target: A breakout above the triangle's upper boundary could lead to a significant price increase, with a potential projection around the 920.00 level and more
Overall Outlook:
The technical analysis based on Elliott Waves suggests a bullish bias for SBIN. However, it's essential to monitor the price action closely and be prepared to adjust the analysis if the market's behaviour deviates from the expected pattern.
I am not Sebi registered analyst.
My studies are for educational purpose only.
Please Consult your financial advisor before trading or investing.
I am not responsible for any kinds of your profits and your losses.
Most investors treat trading as a hobby because they have a full-time job doing something else. However, If you treat trading like a business, it will pay you like a business.
If you treat like a hobby, hobbies don't pay, they cost you...!
Hope this post is helpful to community
Thanks
RK
Disclaimer and Risk Warning.
The analysis and discussion provided on in.tradingview.com/u/RK_Charts/ is intended for educational purposes only and should not be relied upon for trading decisions. RK_Charts is not an investment adviser and the information provided here should not be taken as professional investment advice. Before buying or selling any investments, securities, or precious metals, it is recommended that you conduct your own due diligence. RK_Charts does not share in your profits and will not take responsibility for any losses you may incur. So Please Consult your financial advisor before trading or investing.

JINDALSTEEL IMPULSE MOVE UPJINDALSTEEL completed abc correction near 894
and breakout from the trendline..
look for upside targets levels
61.8% at 1020 and than 1100
MACD positive crossover.
Disclaimer : this is only for learning purpose and no trading recommendations

RAILTEL - AS PER FIB RETRACEMENT, CORRECTION WAVE MIGHT BE OVERHi,
This idea is about Railtel Corporation of India Ltd
ABOUT THE COMPANY
RailTel was incorporated in 2000, with the objective of creating nationwide broadband and VPN services, telecom, and multimedia network, to modernize the train control operation and safety system of Indian Railways. It is a "Miniratna" PSE of the Government of India. At present, RailTel's network passes through around 6,000 stations across the country, covering all major commercial centers
TECHINCALS
As per the price action, the first impulse wave took the price all the way from 337 to 615. THen the correction wave commenced which pulled back the price from 615 to 440 levels. The price point as per fib retracement is at the point of 50-61% which as per Elliot Wave theory should be the correction wave
Next impulsive wave could start if the price aloses above 475 with volume support
FUNDAMENTALS
Market Cap
₹ 15,066 Cr.
Current Price
₹ 469
High / Low
₹ 618 / 163
Stock P/E
56.4
Book Value
₹ 56.9
Dividend Yield
0.61 %
ROCE
20.2 %
ROE
15.2 %
Face Value
₹ 10.0
Equity capital
₹ 321 Cr.
No. Eq. Shares
32.1
EPS
₹ 7.99
Promoter holding
72.8 %
Change in Prom Hold
0.00 %
Chg in Prom Hold 3Yr
0.00 %
Pledged percentage
0.00 %
Market Cap to Sales
5.67
Sales growth
29.8 %
PEG Ratio
3.81
EVEBITDA
27.9
Quick ratio
1.16
Trade receivables
₹ 1,268 Cr.
Sales
₹ 2,658 Cr.
Debt to equity
0.02
Price to book value
8.25
Free Cash Flow
₹ 347 Cr.
CMP / FCF
75.8
Thanks,
Stock-n-Shine

policy bazarIn this chart we clearly see that one impulse wave is over ..we can see one big bullish uptrend on upcoming month. It is great stock for swing trading with minimum stoploss ..
Disclaimer:- Invest at your own risk,, i am not register with Sebi.. This chart is according to my technical analysis which i learnt from past years

Navigating the Waves of Automotive ExcellenceLumax Auto Technologies Ltd.: Navigating the Waves of Automotive Excellence
Let's dive into the world of Lumax Auto Technologies Ltd., a stalwart in the realm of automotive components.
About Lumax Auto Technologies:
Lumax Auto Technologies Limited, a proud member of the Lumax-DK Jain Group, stands as a market leader in crafting automotive components.
With over four decades of experience, Lumax Auto Technologies has been a reliable supplier for both Original Equipment Manufacturers (OEMs) and the Aftermarket segment.
Elliott Wave Analysis:
Now, let's bring in the insights from the Elliott wave perspective:
The stock has been on a journey, going through different waves like 1, 2, 3, and 4. Now, it looks like we might be entering wave 5, which is a bigger move.
Within wave 5, we've likely finished the first part, and now we're waiting for the second part.
Think of Elliott waves like a cycle, showing how the market's mood goes up and down. Wave 5 is interesting because it often marks the last big move in a trend, causing prices to make significant changes.
Opportunity Beckons
As the waves unfold, the anticipated wave 2 might offer strategic dips, presenting an opportunity to go long.
Caution is maintained with an invalidation level set at 332.(Stop-Loss)
The journey towards the north could potentially reveal targets reaching 470 and beyond. Of course, in the dynamic world of finance, fingers are crossed for a prosperous journey.
Rising Stock Chart
Lumax Auto Technologies Ltd. stands at the intersection of experience and innovation, riding the waves of automotive excellence.
I am not Sebi registered analyst. My studies are for educational purpose only.
Please Consult your financial advisor before trading or investing. I am not responsible for any kinds of your profits and your losses.
Most investors treat trading as a hobby because they have a full-time job doing something else.
However, If you treat trading like a business, it will pay you like a business.
If you treat like a hobby, hobbies don't pay, they cost you...!
Hope this post is helpful to community
Thanks
RK💕
Disclaimer and Risk Warning.
The analysis and discussion provided on in.tradingview.com is intended for educational purposes only and should not be relied upon for trading decisions. RK_Charts is not an investment adviser and the information provided here should not be taken as professional investment advice. Before buying or selling any investments, securities, or precious metals, it is recommended that you conduct your own due diligence. RK_Charts does not share in your profits and will not take responsibility for any losses you may incur. So Please Consult your financial advisor before trading or investing.

Elliott Wave Analysis of Tega Industries ltdWelcome to our fascinating journey through the Elliott Wave theory as we analyze Tega Industries.
What Tega Industries does?
Tega is a global leader in designing and manufacturing of 'critical-to-operate' consumables for the mining, mineral processing and material handling industries. The company founded by Mr. Madan Mohan Mohanka in 1976 is a multinational corporation headquartered in Kolkata, India.
Sources - Google
Let's dive into the world of waves
From the starting and up to August 2023, we've seen waves 1, 2, and 3 paint the canvas of price movements. Then, in late October 2023, wave 4 appeared, like a brief intermission.
Now, the thrilling part is, It seems we're in the process of unfolding wave 5. Think of it as the grand finale, often pushing prices to new heights.
In this case, it could even break past previous all-time highs.
Unveiling Elliott Wave Theory
What makes this theory intriguing?
Elliott Wave theory is like reading the hidden story of markets through patterns. It's about understanding the psychology of crowd behavior in trading.
The Big Picture
Here's the bigger picture:
Waves 1, 2, and 3 brought us up, reflecting the excitement of a new trend.
Wave 4 provided a necessary pause.
Now, we're in wave 5, signaling the potential for even more upward adventure.
The Takeaway
In a nutshell, our analysis hints at potential gains. But always remember:
Markets are full of surprises, and risk management is your best companion on this journey.
As with any adventure, do your homework, and prepare for twists and turns in the market's storyline.
I am not Sebi registered analyst. My studies are for educational purpose only.
Please Consult your financial advisor before trading or investing. I am not responsible for any kinds of your profits and your losses.
Most investors treat trading as a hobby because they have a full-time job doing something else.
However, If you treat trading like a business, it will pay you like a business.
If you treat like a hobby, hobbies don't pay, they cost you...!
Hope this post is helpful to community
Thanks
RK💕
Disclaimer and Risk Warning.
The analysis and discussion provided on in.tradingview.com is intended for educational purposes only and should not be relied upon for trading decisions. RK_Charts is not an investment adviser and the information provided here should not be taken as professional investment advice. Before buying or selling any investments, securities, or precious metals, it is recommended that you conduct your own due diligence. RK_Charts does not share in your profits and will not take responsibility for any losses you may incur. So Please Consult your financial advisor before trading or investing.

Correction Continuation/over in USDCAD.Elliott Wave Analysis:-
A up wave was completed and a correction was over.
If it continues the upside move then an impulse was already in formation.
But if it is a correction was then it will be a connecting wave and the correction will become a correction continuation wave.
my view is one impulse was over in this time frame next to w) wave . if it may go up without breaking down of W) wave then it will form a 5th wave.
another view:-
If the correction wave breaks the top of 2nd wave then entire correction will be correction wave and impulse marking will get failed. wait and watch the wave formation.
i am not a SEBI registered advisor. Before taking a trade do your own analysis or consult a financial advisor. I share chart for education purpose only. I share my trade setup.

impulse wave in HINDUSTAN PETRO. Alternative wave.Elliott Wave Analysis:-
Both correction and impulse wave we are expecting a correction.
once correction get ended an impulse take place.
View 1:-
There is also expected an impulse wave i) completed and a correction wave ii) was almost over if raise start then impulse wave iii) is expected to move on.
View2:-
Correction wave was still pending and a low was expected.
once the low was completed then the impulse wave of v wave was expected .
I'm not a SEBI registered advisor.
Kindly consult your financial advisor.

whether the correction over in damrt?the correction taken has over to certain level.
the script may start a rise from the CMP (or) the script may give a deep correction and then it may strat to raise.
recent quarter has shown a good results.
there are 2 possibility in impulse and one in corrective way nature. as of now we can go for the buy at CMP and we can average if the price come down.
Disclaimer.
im not a SEBI registered advisor.
this trade setup is my idea and it is not a call or tips.
before taking your trade kindly consult your investment advisor.

pullback is expected to emmplete soon in NIOThis is an elliott wave analysis.
A reasonable pullback had occurred.
we can start accumulate from here.
we can average further if it goes around $8 - $9.
With low risk and high reward.
i'm not a semi registered advisor.
I'm sharing my personal view.
Kindly post me comments if you people have any queries.
Your doubt will be cleared accordingly.
#elliottwave #NYSE , #sharemarket , #Nasdaq , # technical analysis
