Nifty 50 - What Next?According to the study pattern, all important levels are marked on the chart.
A rising parallel channel has been formed since June 24. Also, another parallel channel is formed since April 25. At the moment, the price is at the lower level of the inner parallel channel. If the price sustains above the lower level, it may go up. The above targets may be 25700/ 26800 and 27100.
The setup fails if the price sustains below the yellow trendline (marked on the chart).
This is not buying or selling advice in any form. This is only my view, shared only for learning and sharing purposes.
Your views are welcome.
Index

Nifty Metal - Breakout Setup, Move is ON...#CNXMETAL trading above Resistance of 11523
Next Resistance is at 15060
Support is at 9968
Here are previous charts:
Chart is self explanatory. Levels of breakout, possible up-moves (where index may find resistances) and support (close below which, setup will be invalidated) are clearly defined.
Disclaimer: This is for demonstration and educational purpose only. This is not buying or selling recommendations. I am not SEBI registered. Please consult your financial advisor before taking any trade.

Update on NASDAQ BULLISH BIAS IDEA.This is how market respects the zone and levels.
I don't share signals and dreams , I share clarity and ideas for you to focus on.

Nifty Metal - Breakout Setup, Move is ON...#CNXMETAL trading above Resistance of 8747
Next Resistance is at 11523
Support is at 6740
Here is previous chart:
Chart is self explanatory. Levels of breakout, possible up-moves (where index may find resistances) and support (close below which, setup will be invalidated) are clearly defined.
Disclaimer: This is for demonstration and educational purpose only. This is not buying or selling recommendations. I am not SEBI registered. Please consult your financial advisor before taking any trade.

Nifty Breakout and RetestNifty gave a breakout of a triangle on Friday and today it has given a retest of the breakout level.
One can look for longs from here on on Nifty with 26100/26050 as SL.
Target- 26300, 26450, 26500.
Check the Chart for understanding the pattern and keep a track for more learning.
Disclaimer- This is just for educational purpose.
Jai Shree Ram.

Breakout in Nifty Auto...Chart is self explanatory. Levels of breakout, possible up-moves (where index may find resistances) and support (close below which, setup will be invalidated) are clearly defined.
Disclaimer: This is for demonstration and educational purpose only. This is not buying or selling recommendations. I am not SEBI registered. Please consult your financial advisor before taking any trade.

Nifty Hits a New Peak: Is the Next Leg Up Around the Corner?Indian equities kicked off the New Year with confidence, gaining nearly 1% and finally breaking out of a five-week consolidation phase. After a slow and mixed start, a strong rebound in the latter half of the week pushed the Nifty to a fresh all-time high of 26,329.
Volatility ticked up slightly, with India VIX rising 3.28% to 9.45, but it continues to remain at comfortable, historically low levels.
◉ Technical Outlook
As highlighted earlier, the Cup & Handle pattern has now taken a clearer shape. A decisive breakout and sustained move above the neckline could trigger the next leg of the rally.
◉ Key Levels to Watch
● Resistance: 26,500 – 26,600 (heavy call writing zone)
● Immediate Support: 26,100 – 26,200
● Strong Support: 25,900 – 26,000 (heavy put writing zone)
◉ Near-Term View
Nifty is likely to consolidate within a 300-point range, broadly between 26,200 and 26,500, as the market digests recent gains.
◉ Key Trigger to Watch
Global cues remain important. Markets will closely monitor developments after reports of US military strikes on Venezuela, which could influence sentiment in the coming sessions.
◉ Trading Strategy
Expect mild profit-taking at higher levels. Avoid aggressive fresh buying, protect existing gains, and stay selective by focusing on stocks showing relative strength.

GER40 Holds Key Fibonacci Support – Upside Continuation LikelyThe GER40 chart indicates that a larger A-B-C corrective structure has been completed at the recent low, marked as (C), after which the index began a fresh impulsive upward move. From that bottom, price has formed a clean five-wave advance, confirming the start of a new bullish cycle. The recent pullback appears to be a typical Wave 2 correction, which has respected the 0.5–0.618 Fibonacci support zone, a common area where corrections typically end. This suggests the correction is likely complete and the market is preparing for Wave 3, which is usually the strongest and fastest upward wave. As long as price holds above the Wave 2 low, the bullish Elliott Wave structure remains valid. Overall, the setup favours continued upside, with potential for higher highs in the coming sessions.
Stay tuned!
@Money_Dictators
Thank you :)

NIFTY: Calm Before the Next Big Move?After a choppy end to last week, Nifty closed marginally lower, firmly stuck in a tight range of 25,700 – 26,100. Volatility has dipped sharply (India VIX near multi-year lows), which usually means calm before the next directional move.
◉ Technical Snapshot
Nifty continues to trade within a rising wedge pattern and has bounced back from its trendline support, suggesting buyers are still active at lower levels — but conviction is missing.
◉ Key Levels
● Immediate Support: 25,700 – 25,800
Strong put writing in this zone indicates solid downside support.
● Immediate Resistance: 26,000 – 26,100
Heavy call writing here signals supply and hesitation near the top.
◉ Short-Term outlook
● Bullish bias above 26,100: Could fast-track rally to new short-term highs.
● Stuck inside range: Expect sideways, choppy action with stock-specific moves.
● Break below 25,700: Risk of sharper correction increases.
◉ Trader’s Edge
This week is all about range resolution. Until Nifty delivers a clean breakout or breakdown, the smartest approach is to trade the range, keep tight stop-losses, and book profits without getting greedy.

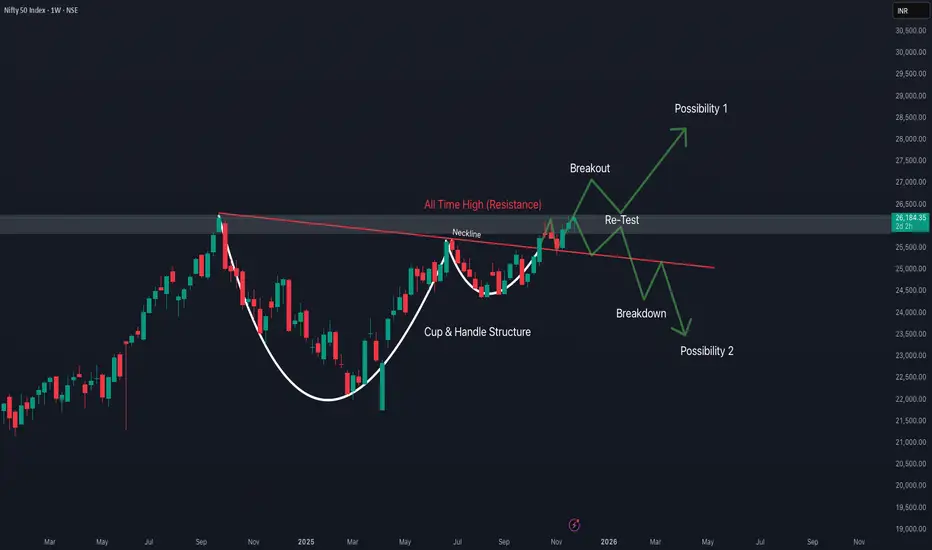
Weekly Price Action in Nifty 50The chart shows a classic Cup & Handle pattern
The cup is wide and smooth – a strong long-term accumulation pattern.
The handle is small, healthy, and formed near resistance → a sign of strength.
These patterns on the weekly chart typically lead to multi-month rallies.
The chart structure is strongly bullish unless Nifty falls below 25,500.
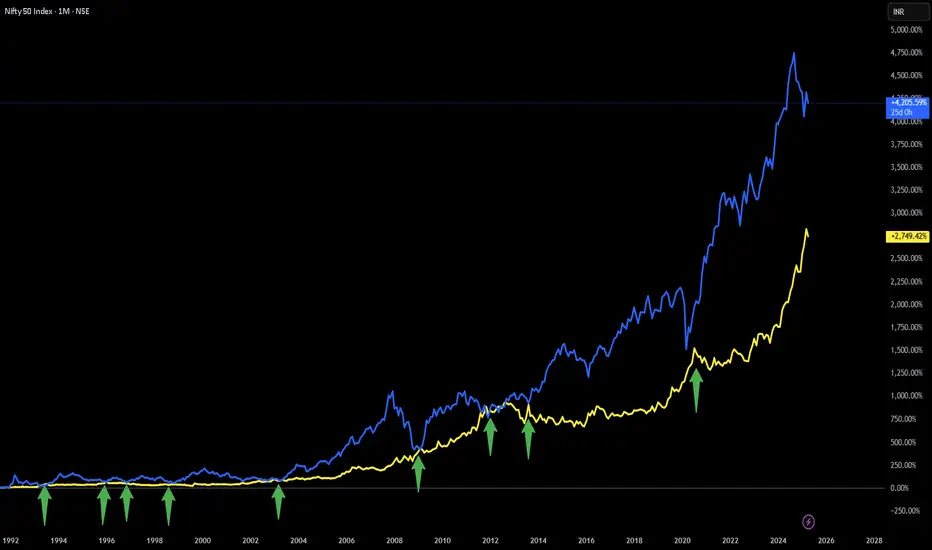
Strange Observation between NIFTY and GOLD...Since August 1, 1991: When ever NIFTY and GOLD return are same NIFTY gives handsome return in coming months.
Good examples of above statement are years 2003, 2009, 2013 and 2020.
Since August 1, 1991: NIFTY has given approx 4200% return and GOLD has given approx 2750% return. Difference in return is approx 1450%.
Going by the above observation either NIFTY has to come down or GOLD has to go up (or both) for NIFTY to give handsome return.
NOTE: This is just a strange observation/correlation.
Disclaimer: This is for demonstration and educational purpose only. This is not buying or selling recommendations. I am not SEBI registered. Please consult your financial advisor before taking any trade.
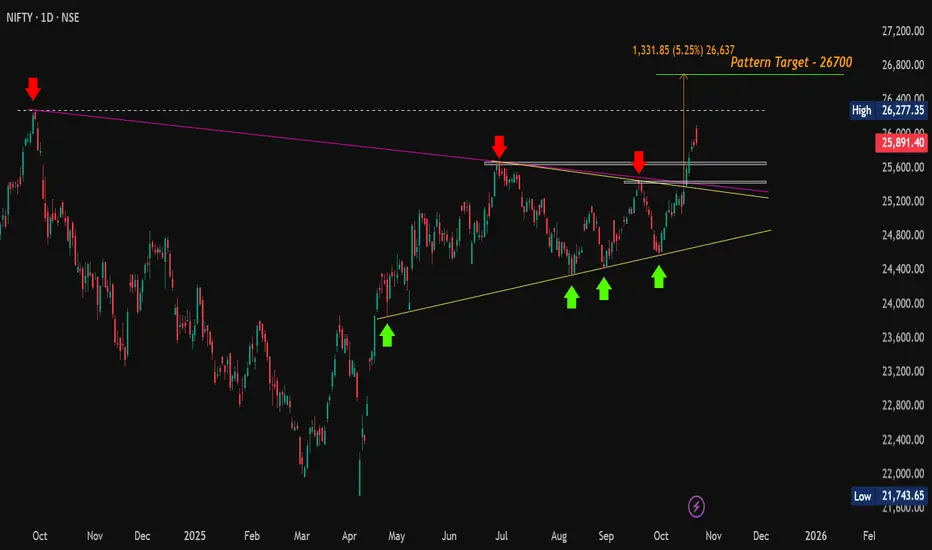
#Nifty | Breakout Confirmed, Now Eyes on Support for Next Move#Nifty Update (Daily):
CMP: 25,891.40
Following our previous update at 25,285, Nifty has decisively broken out above the Symmetrical Triangle pattern and surged to a high of 26,104 today. Price action formed a bearish candle but managed to close positively on the daily chart.
🔄 What to expect next?
A potential retest of breakout levels is likely as profit booking is expected after a strong rally of over 1,500 points from the swing low. Watch the key support zones closely for a possible bounce.
🔽 Support Zones to watch :
25,669 - 25,638
25,449 - 25,424
⚡️ If Nifty holds these levels and reverses, it could set the stage for a renewed upmove aimed at surpassing the all-time high (ATH) at 26,277.
🔼 Resistance Zones to watch :
26,104 (recent high)
26,216 - 26,277 (ATH)
📈 A sustained break above the ATH will confirm continuation toward the symmetrical triangle’s ultimate target near 26,700 .
#Nifty | #Nifty50 | #BreakOutRetest | #SymmetricalTriangle | #ChartPatterns | #SwingTrading | #PriceAction
📌 Disclaimer: This analysis is shared for educational purposes only. It is not a buy/sell recommendation. Please do your own research before making any trading decisions.
#SENSEX | Cup & Handle Breakout Loading?CMP: 82,600
A classic Cup & Handle pattern is forming on the weekly chart of SENSEX , signaling a potential continuation of the long-term uptrend. A breakout above the neckline could trigger a fresh rally.
Pattern: Cup & Handle (Bullish Continuation)
Breakout Confirmation: Weekly close above handle neckline
Pattern Target: +15% upside → ~96,500
Invalidation: Weekly close below 79,741
📌 Key Zones:
Resistances: 84,059 – 84,100 / 85,978 (All-Time High)
Supports: 82,133 / 81,307 / 80,426
⚠️ Watch for a strong weekly close above the neckline to confirm breakout.
📌 Disclaimer: This analysis is shared for educational purposes only. It is not a buy/sell recommendation. Please do your own research before making any trading decisions.
#SENSEX | #BSE | #CupAndHandle | #ChartPattern | #PriceAction

#Nifty Weekly Outlook – Cup & Handle in Focus!CMP: 25,285
Primary Trend: Uptrend (Bullish Bias)
🔽 Support Zones
• 25154 – 25084
• 24858 – 24768
• 24588 (Major swing support)
🔼 Resistance Zones
• Immediate Resistance: 25424 – 25449
• Next Hurdles: 25638 – 25669
• Key Breakout Level: 26179 – 26277.35 (ATH)
Pattern: Cup & Handle ☕️
A classic Cup & Handle pattern is forming on the weekly timeframe , following a strong uptrend, which is a bullish continuation setup.
• 🧭 Neckline breakout (sloping white trendline) is the key trigger.
• 🎯 Target Projection: ~29,500 (~16% upside potential post-breakout)
🔒 Pattern Invalidation Level
• Weekly close below 24,337 negates the pattern.
⏳ Awaiting Breakout Confirmation
• A weekly close above the neckline with solid volume will confirm the breakout .
• Until then, price remains in a healthy consolidation.
✅ Dips into support zones can be used for positioning, with proper risk management.
#Nifty | #Nifty50 | #CupAndHandle | #ChartPatterns | #SwingTrading | #PriceAction
📌 Disclaimer: This analysis is shared for educational purposes only. It is not a buy/sell recommendation. Please do your own research before making any trading decisions.

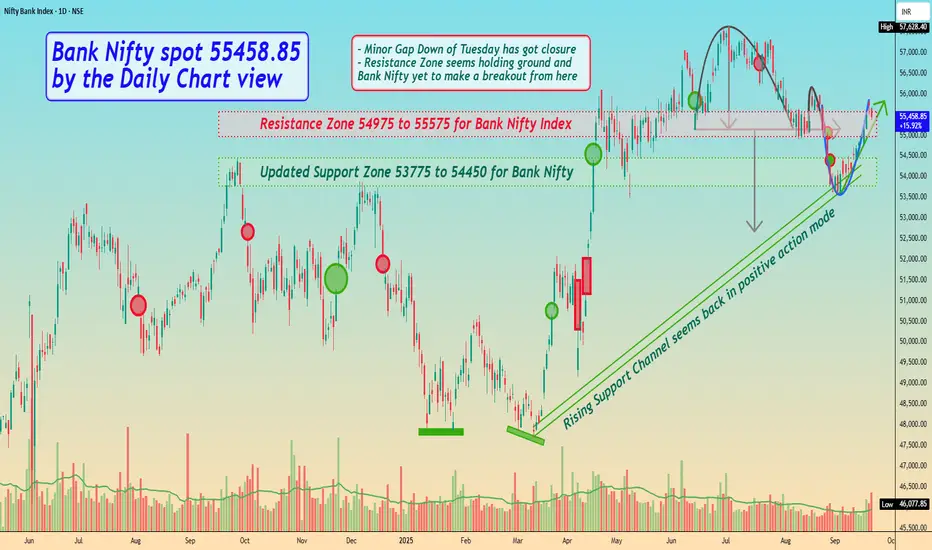
Bank Nifty spot 55458.85 by Daily Chart view - Weekly updateBank Nifty spot 55458.85 by Daily Chart view - Weekly update
- Minor Gap Down of Tuesday 26th Aug got closure
- Resistance Zone 54975 to 55575 for Bank Nifty Index
- Updated Support Zone 53775 to 54450 for Bank Nifty
- Rising Support Channel seems back in positive action mode
- Resistance Zone seems holding ground and Bank Nifty yet to make a breakout from here
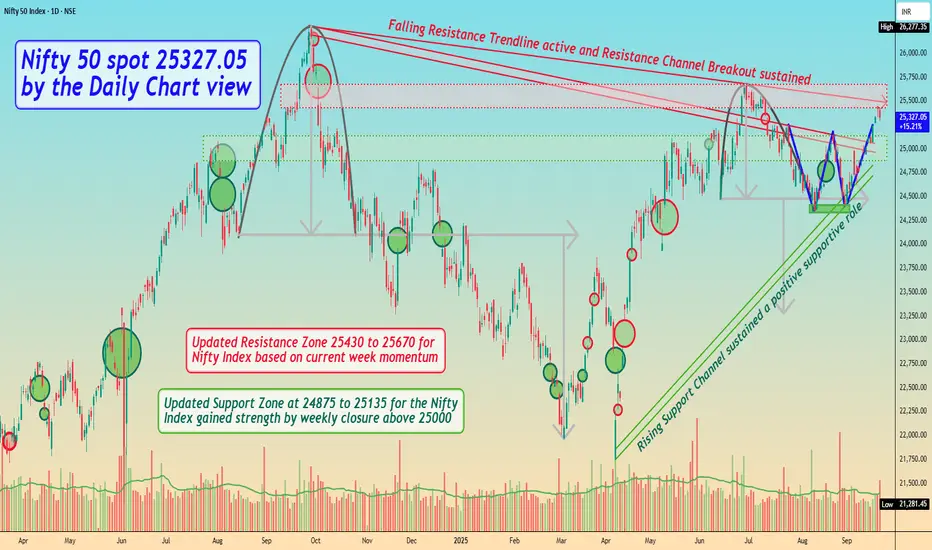
Nifty 50 spot 25327.05 by Daily Chart view - Weekly updateNifty 50 spot 25327.05 by Daily Chart view - Weekly update
- Rising Support Channel sustained a positive supportive role
- Bullish "W" Double Bottom uptrend momentum yet on strong ground
- Falling Resistance Trendline active and Resistance Channel Breakout sustained
- Updated Resistance Zone 25430 to 25670 for Nifty Index based on current week momentum
- Updated Support Zone at 24875 to 25135 for the Nifty Index gained strength by weekly closure above 25000
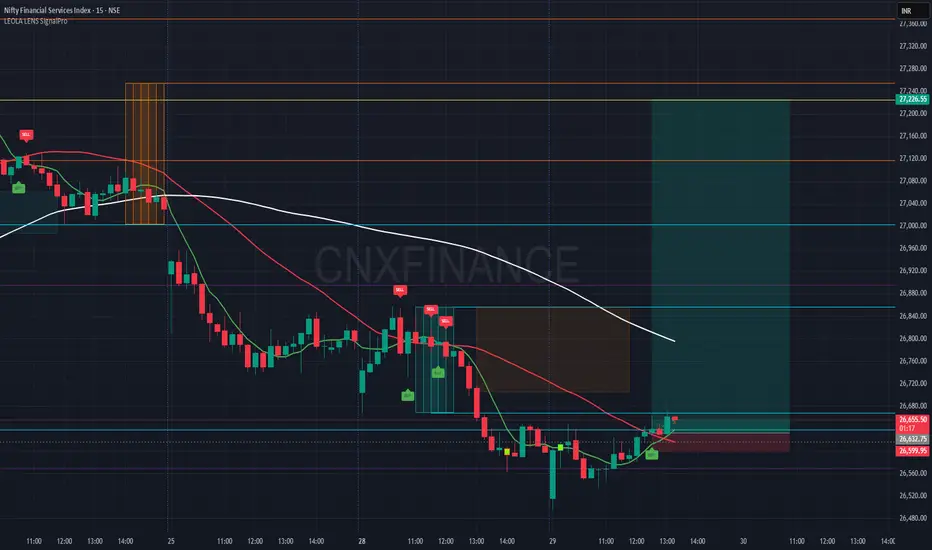
Nifty Financial Services Index-Reversal Set-Long Eyes ONLeolaLens SignalPro has triggered a fresh Buy indication on the 15-minute chart after a prolonged downtrend. This signal has emerged near a possible reversal zone, with defined risk and potential reward setup.
Entry: Around 26,660
Stop Loss: 26,599
🎯 Target 1: 26,880
🎯 Target 2: 27,040
🎯 Target 3 (Extended): 27,240
Key Observations:
Price attempting short-term EMA crossover
Favorable risk-reward ratio setup
Chart structure suggests potential for short-term reversal
🛑 Disclaimer:
This chart is shared strictly for educational purposes. This is not financial advice or a buy/sell recommendation. Please do your own research and consult a registered financial advisor before making any trading decisions.
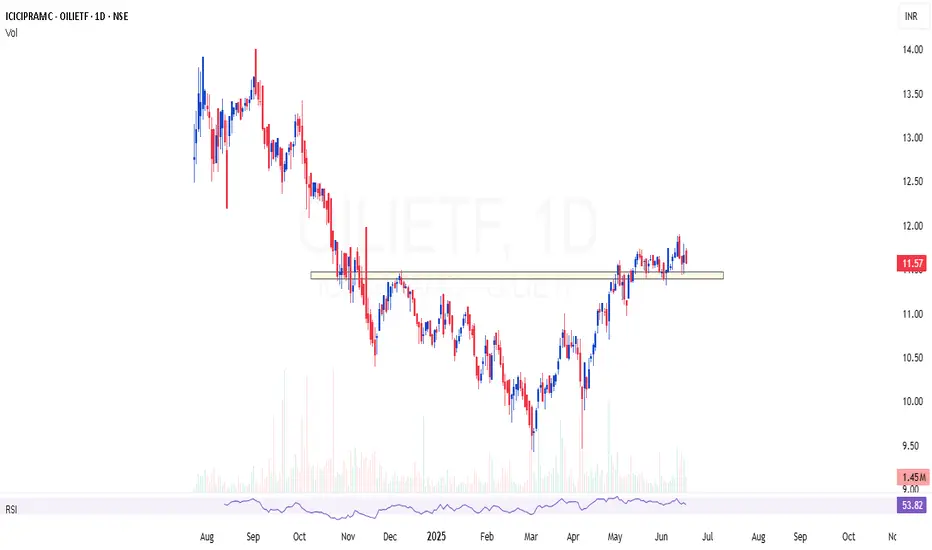
OILIETF | Good theme for current global sentimentOILIETF | Good theme for current global sentiment
The ETF has good volume to trade,
Portfolio consist of stable stocks that are fallen already
Trying to capture a 30% move in this ETF
Has good risk reward and momentum aswell
Relatively a stable bet
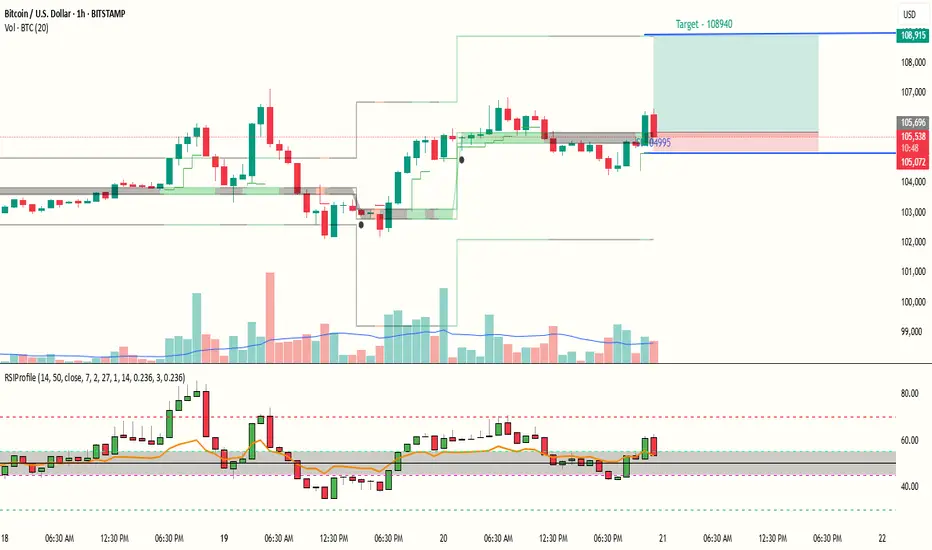
BTC ready for continuation of UP move with a reward ratio of 5RSI Profile shows a positive trend for BTCUSD and and risk reward ration is above 5. Also a Bullish triangle pattern seems to reach near complete on BTC Chart. Price is above RSI Point of Control, hence a small SL below POC and target is near the Value area High.
Entry near 105600
Target near 108940
Sl near 104995
RR : 5.16
PS : Above is only for Educational purpose and does not constitute any financial advice. Do your Own Research.
Nifty Breaks Past 25,000: Is a New High on the Horizon?Last week, Nifty broke above the psychological milestone of 25,000, shaking off market doubts and sparking fresh bullish momentum.
◉ Key levels to watch:
The zone between 24,750–24,850 now acts as immediate support, while 23,750–23,850 remains a major support.
This rally wasn't just a technical bounce — it was fuelled by meaningful tailwinds:
● India-Pakistan Ceasefire helped ease geopolitical concerns, calming the nerves of investors.
● Cooling inflation in both India and the U.S. sparked hopes of rate cuts, improving market liquidity.
● Strong corporate earnings from majors like Hero MotoCorp , HCL Tech , and Tata Motors lifted sentiment.
With continued FII inflows , the bullish momentum is expected to persist — potentially pushing Nifty toward its all-time high in the near term.

Nifty Outlook: Range-Bound Week Ahead?📈 Nifty wrapped up the week on a positive note, climbing about 1% and keeping the bullish sentiment alive.
🔍 However, the daily chart reveals some hesitation, as the index struggles to stay above the 24,400 mark.
📊 Looking ahead, Nifty is likely to move sideways between 24,500 and 24,000, with heavy call writing at the top and put writing at the bottom, creating a tight trading range.
⚠️ Adding to the caution, the India VIX closed above 18, hinting at increased market Volatility.
💡 Bottom line: Traders should gear up for a volatile and range-bound week ahead. Stay sharp, stay strategic!

Banking Sector Boost Nifty to New Levels: What’s Coming Next?The Nifty has shown a clear turnaround with a double bottom pattern and has broken past the 23,800 level. This strong move is mostly thanks to the banking sector, especially with great Q4 results from HDFC Bank and ICICI Bank.
The Bank Nifty, now trading just below its all-time high, might struggle near 55,000—a zone that previously triggered a pullback, leading to consolidation in the broader market.
For Nifty, the immediate resistance is seen at the 24,000 level, where significant call writing activity may pose a hurdle. On the downside, a breach below 23,500 could signal a potential reversal, dragging the index into a downtrend once again.

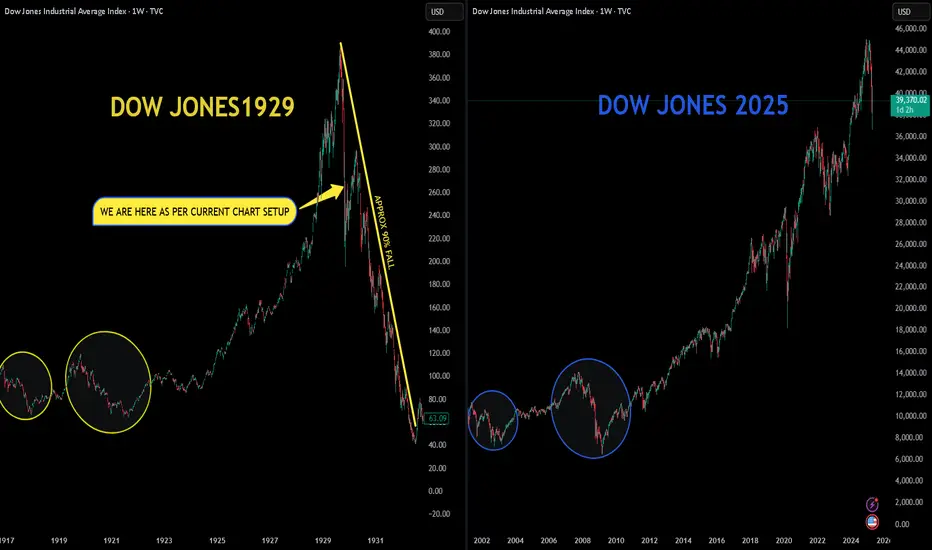
The 1929 Trade Tariff Vs The 2025 Trade Tariff (DOW JONES)Charts are self explanatory.
This is a simple comparison of the 1929 Dow Jones with the 2025 Dow Jones. As you can observe, there are many similarities.
Big Question: Can the Dow Jones again experience a 90% correction, similar to the one between 1929 and 1932 ?
NOTE: This is just an observation/correlation.
Disclaimer: This is for demonstration and educational purpose only. This is not buying or selling recommendations. Please consult your financial advisor before taking any trade.