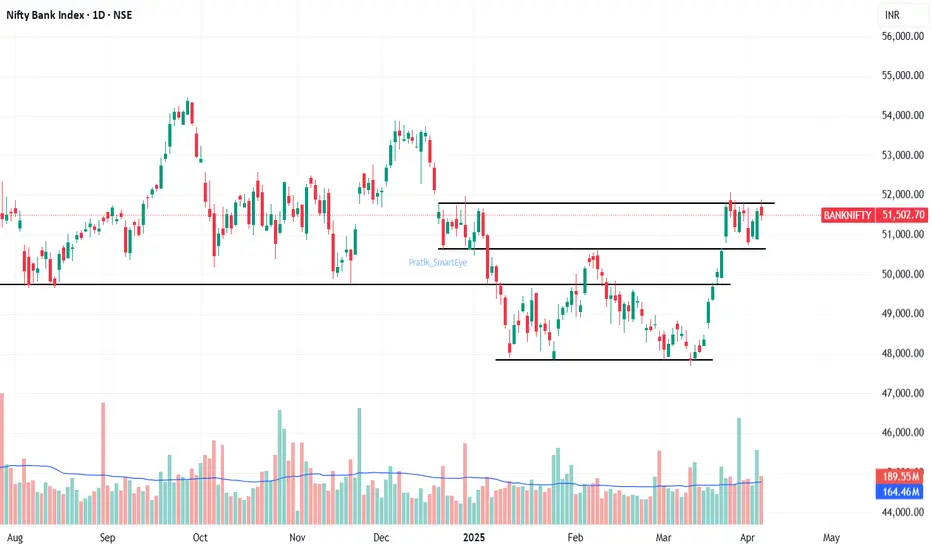
Bank Nifty: a flag formation & in previous consolidation zoneBank Nifty: a flag formation & in previous consolidation zone..
Either side break from this zone for the next direction.
Breakout above 51,790.
Breakdown below 50,640.
on closing basis.
Index
PSU Bank Index - Breakout A strong move today, and has given a breakout from an inverted H&S pattern.
Breakout at 6300
Target : 7225
Sl 6100

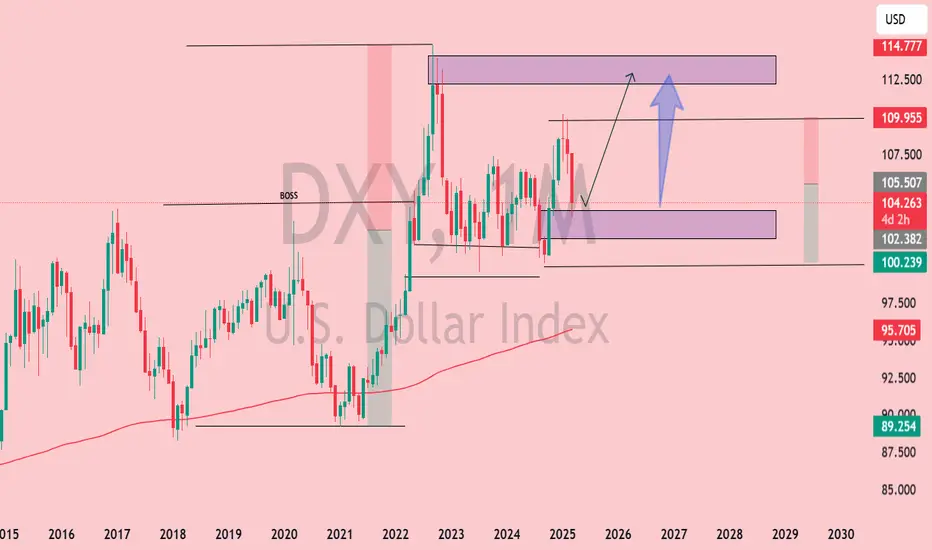
DXY Monthly Analysis: Key Support Holding, Bullish Move Ahead?📊 DXY Monthly Chart Analysis (March 27, 2025)
Key Observations:
Current Price Action:
The U.S. Dollar Index (DXY) is trading near 104.267, with notable resistance ahead.
Price is consolidating within a key demand zone (~102.5–104) after rejecting higher levels.
Technical Levels:
Support Zone: 100.2–104 (Highlighted in purple)
Resistance Zone: 112.5–114.7 (Highlighted in purple)
Major Resistance: 114.77 (Previous high, acting as a supply zone)
200-MA Support: Located below current price, offering a long-term bullish confluence.
Market Structure:
Price remains in a higher time-frame bullish trend but is experiencing a correction.
The "BOSS" level (Break of Structure) suggests a prior bullish breakout.
If the demand zone holds, a bullish continuation towards 112.5–114.7 is possible.
Projected Move:
A bounce from 102–104 could trigger a rally toward the upper resistance zone (~112.5).
A break below 100.2 could indicate a shift in trend and further downside.
Conclusion:
DXY is at a critical decision point. Holding the current support zone (~102–104) could fuel a bullish continuation toward 112–114, while a breakdown below 100.2 would weaken bullish momentum.
U.S. Dollar Index (DXY) – Key Technical Levels & Market OutlookU.S. Dollar Index (DXY) Monthly Chart Analysis 📊💵
The U.S. Dollar Index (DXY) is currently navigating a critical price structure, with key supply and demand zones influencing market direction. Here’s a professional breakdown of the chart’s technical outlook:
📍 Key Technical Insights
✅ Supply & Demand Zones
Supply Zone (Resistance): 109 - 114 📈 – A key area where selling pressure has historically emerged. A decisive breakout above this level could signal further upside potential.
Demand Zone (Support): 100 - 103 📉 – A strong accumulation zone where buyers have stepped in previously. A breakdown below could indicate a shift in market sentiment.
✅ Market Structure & Momentum
A Break of Structure (BOSS) has been identified, signaling a shift in trend dynamics.
The market is currently ranging between major resistance (~109) and support (~100).
✅ 200-Month Moving Average 📊
The long-term moving average (red line) is acting as dynamic support, reinforcing the bullish bias unless decisively breached.
📊 Potential Scenarios
🔹 Bullish Outlook: If DXY maintains support above 100-103 and breaks past 109, the index could aim for 114+ in the coming months. 🚀
🔹 Bearish Risk: A sustained drop below 100 may open the door for further downside towards 95-89, signaling a broader correction. ⚠️
📌 Conclusion
The DXY remains in a consolidation phase, with key inflection points around 103 (support) and 109 (resistance). A breakout or breakdown from this range will determine the next major trend. Traders should monitor these levels closely for potential trading opportunities.

Breakdown in NIFTY...Nifty has broken it's channel support line (Lower Channel Level) on weekly closing basis. Nifty's next two support after breakdown are marked with green lines.
Disclaimer: This is for demonstration and educational purpose only. This is not buying or selling recommendations. I am not SEBI registered. Please consult your financial advisor before taking any trade.

NIFTY - Breakdown OR Support...Nifty is third time at it's channel support line (Lower Channel Level). Weekly close below it will confirm breakdown.
Nifty's next two support after breakdown are marked with green lines.
Disclaimer: This is for demonstration and educational purpose only. This is not buying or selling recommendations. I am not SEBI registered. Please consult your financial advisor before taking any trade.

NIFTY 50 I Falling Wedge Pattern + Bulllish Divergence Nifty 50 Index is currently trading within a very important zone in simple words called area of interest Usually consisting of demand or supply zone. This level has acted as a solid base for the index.
The NIFTY 50 index presents a promising opportunity to initiate long positions at these levels (CMP23,000), Aligning well with the risk reward ratio and making it a favourable entry point for traders looking for Taking advantage of the upcoming trend.
The index has shown a pattern of forming lower highs and lower lows, which indicates a downtrend. However, the Relative Strength Index (RSI) is showing a contrasting pattern of higher highs and higher lows. This divergence between price action and RSI suggests a potential shift in momentum and a possibility of a short covering rally.
Adding to this I see a falling wedge pattern which is a bullish signal suggesting an upward price movement which typically appears in a downtrend and often seen as a bullish Reversal pattern.
The analysis holds true when price close above 23,824 - daily timeframe.
While entering on current levels also has good opportunity of risk reward ratio, I suggest looking for a pin bar candle on today's close will Confirm Market picking support from the levels .
Conversely if nifty 50 index continues to recover, We could see a push towards 24,200 and 24,800 Which represent key Resistance areas. A good breakout above these levels likely signal Continuation of bullish trends in the indian markets.

The Nifty 50 Dilemma: Which Way Will the Index Swing?◉ Technical Analysis
● Nifty has formed a Falling Wedge pattern on the daily chart, typically considered a bullish signal.
● Simultaneously, a Three Black Crows candlestick pattern has emerged over the last three sessions, indicating bearish sentiment.
● The bearish pattern is significant as it has formed near the trendline resistance, suggesting a potential pullback toward the 23,000 level.
◉ OI Data Analysis
● The 23,600 level has the highest call writer concentration, acting as immediate resistance.
● The 23,200 level shows the highest put writer accumulation, serving as strong support.
◉ Possible Next Move
● If the index opens with a slight gap-up below 23,600, selling pressure is likely to continue in the coming week.
● Even with a significant gap-up above 23,600, a bearish scenario may persist.
● For a confirmed trend reversal, the index must decisively break and hold above the 23,800 level.

DXY Bullish Breakout – USD Strengthening Towards 120+?📊 DXY (U.S. Dollar Index) Monthly Chart Analysis 🚀
📈 Breakout in Progress:
The chart shows a breakout from a horizontal resistance zone (previous highs). This signals bullish momentum.
📊 Trend & Structure:
Higher Lows & Higher Highs indicate an uptrend.
Price has been moving within an ascending channel for years.
📉 EMA 200 Support:
The 200-month EMA (95.63) is well below the current price, acting as a strong long-term support level.
🔮 Future Projection:
A potential pullback to confirm support, followed by a strong bullish move toward 120-125 levels.
Chart Projection Suggests: 🚀 Upside continuation if support holds.
🔥 Key Levels to Watch:
✅ Support: 104-108 (Breakout retest zone)
🎯 Target: 116-124 (Upper trendline)
💡 Conclusion: Bullish bias remains strong. If DXY holds above 108, the dollar could gain more strength in 2025. 🚀📊

Consumption Boom: Tax Cuts Fuel India's Consumer Stock SurgeRecent trends in the Indian stock market indicate a significant shift from industrials to consumer-oriented stocks, particularly in sectors such as consumer goods, consumer discretionary, and automobiles. This change has been catalysed by the government's recent budget announcement, which included income tax cuts aimed at boosting consumer spending.
◉ Key Insights
● Increased Consumer Spending: The reduction in income tax is expected to enhance disposable income for individuals, thereby accelerating the shift towards consumption stocks. This trend is already visible, with the Nifty India Consumption Index NSE:CNXCONSUMPTION rising over 3% following the budget announcement.
● Impact on Industrial Stocks: Conversely, industrials faced a downturn post-budget, with the BSE Capital Goods Index dropping by 3% and the Infrastructure and Industrials indices falling over 2.5%. This indicates a market sentiment that favours consumer spending over capital expenditure in the short term.
● Bullish Outlook on Specific Sectors: Analysts are optimistic about sectors such as paints, consumer durables (including electric goods), and two-wheeler manufacturers like Bajaj Auto. These stocks are seen as underperformers that stand to benefit significantly from increased consumption.
◉ Government's Strategy
The government's strategy to stimulate consumption rather than focusing solely on capital expenditure marks a notable shift in fiscal policy. The intent is clear: by putting more money in consumers' hands, the government aims to invigorate spending and support economic growth.
◉ Market Predictions
Market participants predict that consumption stocks will lead market rallies in the near to medium term. The expected increase in spending from the middle class could help alleviate slow growth numbers in sectors like automotive and FMCG.
◉ Conclusion
As investors navigate these changes on Dalal Street, it is crucial to consider the implications of government policies on market dynamics. The current environment presents opportunities for those looking to invest in consumer-focused sectors while remaining cautious about industrial stocks in the near future.

Nifty: Mahakumbh 2025 to bring "Ache din" for Stock Market ?Is this a coincidence or Divine Significance !!
Will the 144 days Time Cycle for Nifty and Mahakumbh 2025 which happens once in 144 years, bring good omen for stock market ??
Only Time will tell, but what's certain is that if we're well prepared, we can make the most of these opportunities.

US 30 - What Next ?Since November 2023, the index has been moving in a rising parallel channel. This time, again, it comes to the lower edge of the channel.
If shows a reversal from the lower edge, may go into a bullish phase. MACD shows a reversal sign too. But merely this is not enough. should wait for some more confirmations. However, this is a good time to exercise a position with a low risk.
If gives a bounceback around these levels, may go around 44500 or more..
This illustration is only for learning and sharing purposes, it is neither a prediction nor a trading advice in any way.
All the best for your trading plans.

Minda Corp Breaking Major Levels after Bouncing from 200 DEMANSE:MINDACORP today broke major Levels with good Volumes and Made a Good Base near the demand zone near 200 DEMA, and RSI showing Bullishness.
Trade Setup:
It can be a Good 1:1 RISK-REWARD Trade. With the recent base being crucial levels.
Target(Take Profit):
631.50 Levels for Positional Trader.
Stop-Loss:
Around 504.95 For Swing Trade and Recent Base for Positional Trader.
📌Thank you for exploring my idea! I hope you found it valuable.
🙏FLLOW for more
👍BOOST if useful
✍️COMMENT Below your views.
Meanwhile, check out my other stock ideas below until this trade is activated. I would love your feedback.
Disclaimer: This analysis is intended solely for informational and educational purposes and should not be interpreted as financial advice. It is advisable to consult a qualified financial advisor or conduct thorough research before making investment decisions.

$ - Sell ?For several months $ was weak but as US Equity reached new ATH $ was making accumulation at lower levels and took lot of time to rise. Right now $ index is at golden ration level and I expect possibilities are distribution and price could fall in coming days and I do not expect $ index to rise further higher. with new president having plans to make US exporter and wanted a weak dollar combined with BRICS and world nations following non-dollar trades. So I am expecting $ index to fall and its right time to sell Dollars and Buy Euro and Yen.

Metal Index: Ascending Triangle Broken, Testing Support LevelsDescription :
The CNS Metal Index recently broke below the 5th pivot of an ascending triangle pattern. This signals a potential bearish shift in momentum. The next key level to watch is the support zone around 8100. If this level is tested and broken, it could indicate further downside potential.
Traders should watch for confirmation signals, such as increasing volume on the breakdown or a sustained close below 8100, before making decisions. Conversely, if the index rebounds above the broken triangle line, it might invalidate the bearish scenario and suggest a consolidation phase.
Disclaimer :
This analysis is for informational purposes only and does not constitute financial advice. Always conduct your own research and consult with a professional financial advisor before making any trading or investment decisions. Trading involves significant risk and may result in substantial losses.

bankniftythis chart continue create harmonics patterns right now it create bat harmonic pattern which can see in this chart
Buy banknifty future above 51370
add more if get 50750
closing stoploss elow 50480
target 52600-54294
always follow stoploss and revised stoploss with partial rofit bookings

nas100 or Nasdaq can touch 27000 in next year 2025i think nas100 can touch 27000 in nxt year , this analysis is base on Fibonacci retracement.
Chart time frame is monthly. I believe that monthly analysis is best for Future predictions it can gives us 90-95 percentage. lets see what happen in next year.

Nifty (is this last hope for buyers?)nifty last hope for buyers it looks more denger if hold below 23300 then it can be gone to hell
FII already sold most of things as seen on fii data
in chart can seen from ab=cd nifty short runninf from top then h & s pattern done and breakdoen and it has been completed the 1:1 tg of h&s ,
now nifty create bat harmonic pattern @ bottom with trendline support
ACCORDING TO NIFTY SPOT can reverse from the area first 23700-680 area second 23380
it ve very strong support and last hope 23200 below closing
FOR SAFE SIDE WE CAN PLAN TO BUY ABOVE 23891 WITH CLOSING SL 23500 AND TARGETS 24300-24700-25600
trailing stoploss metod can use in this
do not work without stoploss
nifty pe ratio 21.3

Nifty Index Futures: Key Technical Insights for December 2024The Nifty Index Futures chart highlights significant market developments, signaling potential shifts in momentum. Here’s a concise analysis:
Key Highlights
Trendline Breakdown:
The long-standing upward channel has been breached, indicating bearish pressure.
Bearish Patterns:
A confirmed head-and-shoulders pattern with a neckline breakdown suggests further downside.
Emerging lower highs and lower lows confirm a bearish trend structure.
Critical Levels:
Resistance: 24,400 and 25,000.
Support: 23,625, 23,222, and 21,827.
Scenarios:
Bullish: A recovery above 24,400 could target 25,000.
Bearish: Sustained trading below 23,625 may lead to 23,222 or lower.
Trade Plan:
Short Trade: Consider shorting below 23,625 with a stop-loss at 24,000 and targets at 23,222 and 21,827.

Nifty 50 Gap fill doneNifty 50 Gap fill done. 23900 is important support.
Index under pressure due to IT Sector.
DXY has cooled off.

Nifty 50 - A Healthy Market Correction, Not a Crash!The recent dip in the Nifty index should be seen as a healthy market correction rather than a crash. Corrections are a natural part of any market cycle, helping to recalibrate overvalued stocks and present opportunities for long-term investors. While short-term volatility may cause concern, it’s essential to focus on the broader trend. Key support levels are marked, and as the dust settles, the market could find new momentum to move upward. Staying patient and strategic during such phases often proves rewarding.
Expect a follow-up to this in the coming months.

FINNIFTY MATHEMATICAL LEVELSThese Levels are based on purely mathematical calculations.
Validity of levels are upto expiry of current week.
How to use these levels :-
* Mark these levels on your chart.
* Safe players Can use 15 min Time Frame
* Risky Traders Can use 5 min. Time Frame
* When Candle give Breakout / Breakdown to any level we have to enter with High/Low of that breaking candle.
* Targets will be another level marked on chart
* Stop Loss will be Low/High of that Breaking Candle.
* Trail your SL with every candle.
* Avoid Big Candles as SL will be high then.
* This is one of the Best Risk Reward Setup.
For Educational purpose only

Nifty 50 - What Next?The chart is self-explanatory. On daily time frame, the index has formed a head & shoulder pattern. If gives a breakdown, it may come around 24000. If gives a bounce back, we will expect to retest the gap area upside around 25670.
What is your opinion, please share if you wish.
This is only for learning and sharing purposes, not a trading advice in any form.
All the best for your trading journey.
