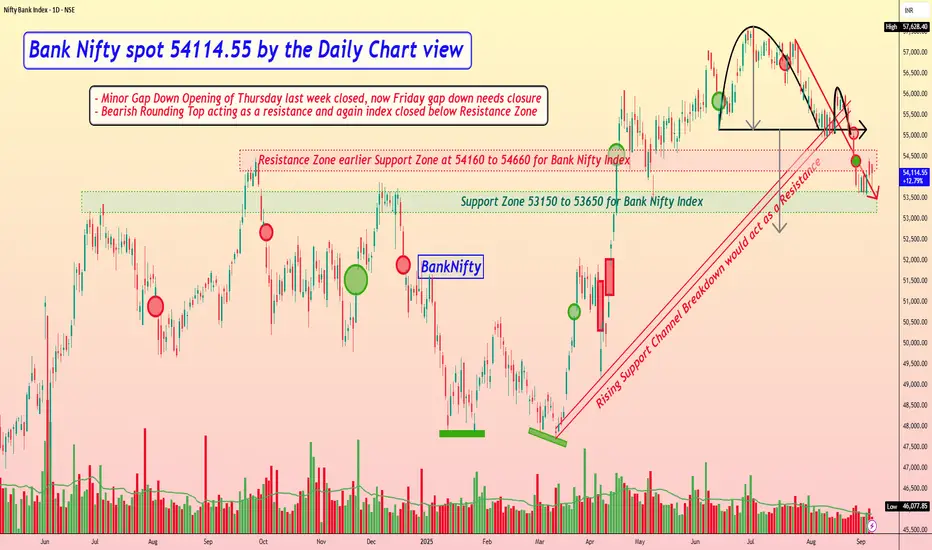
Bank Nifty spot 54114.55 by the Daily Chart view - Weekly updateBank Nifty spot 54114.55 by the Daily Chart view - Weekly update
- Support Zone 53150 to 53650 for Bank Nifty Index
- Rising Support Channel Breakdown would act as a Resistance
- Resistance Zone earlier Support Zone at 54160 to 54660 for Bank Nifty Index
- Bank Nifty Index trending within the Support and Resistance Zone since last week
- Bearish Rounding Top acting as a resistance and again index closed below Resistance Zone
- Minor Gap Down Opening of Thursday last week closed, now Friday gap down needs a closure
Indexanalysis
Long Term View on Bank NiftyRising Wedge Pattern (Bearish Setup)
The red trendlines form a rising wedge, which is typically a bearish pattern.
After years of an uptrend, the index has near its support from the wedge.
Current Position (53,655)
Bank Nifty has corrected sharply in the last few days/weeks and is now trading around 53,600 levels.
The immediate support marked on the chart is around 53000. If this breaks, further downside could open.
Key Support Levels
50,600 – first crucial support.
48,000–47,500 zone – next major support if selling extends.
32,448 – long-term support marked, aligns with pre-COVID breakout levels.
Possible Scenarios (Green & Red Arrows on Chart)
Bullish case (green path): If Bank Nifty stabilizes near 53,000-52,500 and reclaims 55,000+, it can attempt a bounce.
Bearish case (red path): Sustained breakdown below 53,000-52,500 could accelerate fall towards 48,000 -47,500, and in extreme bearishness, even 32,500 over the medium term.
⚖️ Interpretation
The structure suggests weakness after a long rally; if the wedge breakdown happens, then a trend reversal could happen.
The next 1–2 weeks will be crucial: holding 53,000-52,500 may trigger a bounce, but a breakdown could confirm a deeper correction.

Bank Nifty spot 55,149.40 by Daily Chart view - Weekly updateBank Nifty spot 55,149.40 by the Daily Chart view - Weekly update
- Rising Support Channel broken down from supportive role
- Next fairly decent Support Zone 54160 to 54660 for Bank Nifty Index
- Upwards going Resistance Zone 59550 to 56385 for Bank Nifty Index
- Next Strong Resistance Zone 56850 to 57250 and then ATH Level 57628.40
- Acting Support Zone 55050 to 55450 for Bank Nifty Index, will it be a Resistance Zone again
- Bank Nifty Index formed Bearish Rounding Top, somehow seen sustaining closure above the Support Zone for past 3 weeks, indicates consolidation, hope for an upward trajectory

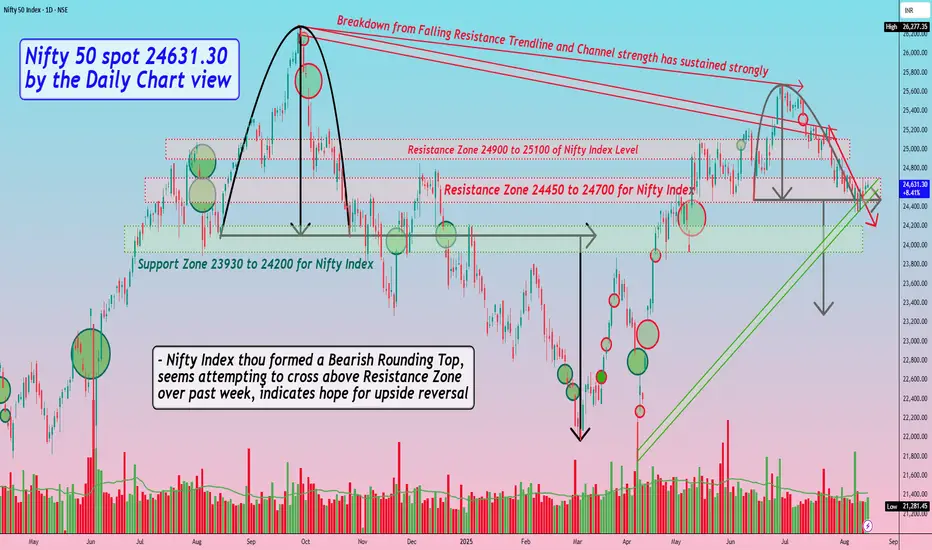
Nifty 50 spot 24631.30 by Daily Chart view - Weekly updateNifty 50 spot 24631.30 by Daily Chart view - Weekly update
- Support Zone 23930 to 24200 for Nifty Index
- Resistance Zone 24450 to 24700 for Nifty Index
- Breakout from above one of the Tiny Falling Resistance Trendline seems well sustained
- Rising Support Channel seems back in supportive role and maintained by current status of Nifty Chart setup
- Nifty Index thou formed a Bearish Rounding Top, seems attempting to cross above Resistance Zone over past week, indicates hope for upside reversal
Rising Wedge Breakdown — 54,252 in Sight?#BankNifty View:
CMP: 56,528
BankNifty has broken down from a Rising Wedge pattern — a bearish signal. After a brief retest of the breakdown level, price has resumed its downward move. Daily close below 56,205 will gather fresh momentum.
🔑 A daily close below 56,205 could trigger fresh downside momentum.
🔻 Support Zones:
• 56,283 – 56,080
• 55,580 – 55,530
• 🔑 Key Supports: 54,470 – 54,375 & 53,600 – 53,580
🔺 Resistance Zone:
• 57,312 – 57,365
🎯 Pattern Target: 54,252
This aligns with the key support zone at 54,470 – 54,375 , strengthening its significance.
📌 Disclaimer: This analysis is shared for educational purposes only. It is not a buy/sell recommendation. Please do your own research before making any trading decisions.
#TechnicalAnalysis | #PriceAction | #RisingWedge | #ChartPatterns

Nifty Starts July Quietly; Sideways Action May ContinueNifty began the month on a subdued note, registering a net weekly loss of 176.80 points (-0.69%). Market volatility also eased, with the India VIX declining by 0.59% to 12.31, indicating reduced trader anxiety.
From a technical standpoint, an immediate resistance zone has developed between 25,500 and 25,650, while a key support range lies between 25,200 and 25,300.
Open Interest (OI) data adds weight to these levels, with a significant build-up of call writing at 25,500 suggesting strong resistance, and put writing at 25,200 indicating solid support.
Looking ahead, Nifty is expected to remain range-bound between these two zones unless a decisive breakout or breakdown occurs.

Nifty Continued to Rise, Bank Nifty Stands Tall at New Highs◉ Nifty Analysis NSE:NIFTY
Indian equity markets broke out of a five-week consolidation last week, powered by easing geopolitical tensions, which helped boost investor sentiment.
A Pole & Flag breakout on the charts signals a continuation of the uptrend, with strong bullish momentum building up.
Open Interest (OI) Snapshot
● 25,000 – Strong Base: Heavy put writing indicates strong support; bulls defending this level aggressively.
● 25,500 – Immediate Support: A secondary cushion with notable put buildup—short-term buyers watching this zone.
● 26,000 – Immediate Resistance Zone: Call writers active here; a breakout above this level could trigger a fresh leg up.
Outlook: The index looks set to maintain a bullish tone, with a possible move toward 26,000 in the coming sessions.
◉ Bank Nifty Analysis NSE:BANKNIFTY
The banking sector continues to lead the market’s strength, acting as a major driver behind the recent rally.
Fundamentally, optimism is being driven by lower funding costs, supported by banks cutting fixed deposit rates and the RBI’s recent cut in the Cash Reserve Ratio (CRR)—both of which have boosted liquidity and improved the outlook for lenders.
The index has confirmed a breakout from a Pole & Flag formation, aligning with Nifty’s bullish setup and further validating strength in the banking space.
Open Interest (OI) Snapshot
● 56,000 – Strong Support Zone: Significant put writing shows strong bullish conviction around this level.
● 57,000 – Immediate Support: Fresh positions being built; dip-buyers may step in here.
● 58,000 – Key Resistance Ahead: Call writers are holding the line—watch for breakout signals.
Outlook: As long as Bank Nifty holds above 57,000, the bullish momentum is expected to continue, with possible testing of 58,000 in the near term.

Nifty Eyes Upside as Bulls Take Charge Ahead of Expiry WeekThe Nifty closed around 25,112 on Friday, marking a 1.29% gain for the week and signalling strong bullish momentum. The rally was driven by broad-based buying, particularly in financial heavyweights like HDFC Bank, ICICI Bank, and Reliance Industries.
Despite lingering global uncertainties, market sentiment remained stable, with the India VIX closing at 13.67—reflecting subdued volatility and cautious optimism among participants.
In the derivatives space, the highest concentration of put writing at the 25,000 strike highlights strong immediate support, while the 25,500 level is emerging as a key resistance zone due to significant call writing activity.
Heading into the upcoming expiry week, the bullish trend is likely to continue, provided no major geopolitical shocks disrupt market sentiment.
MAXHEALTH - 7 months consolidation VCP Breakout - ATHMAXHEALTH
1) 7 months consolidation - volatility contraction pattern breakout and Closed at it's All Time High. A potential up move is possible.
2) Pharma and Healthcare index looks solid to support Pharma stocks.

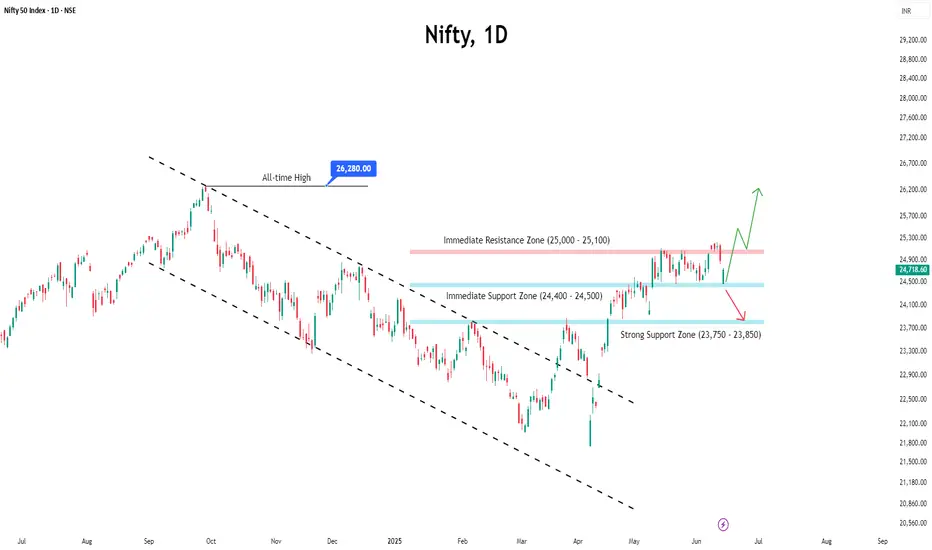
Nifty Weekly Outlook: Volatility Ahead Amid Global Tensions● Despite briefly breaking above the 25,100 resistance last week, Nifty failed to sustain the momentum and witnessed a corrective pullback towards the 24,500 level.
● Market volatility ticked up, with India VIX rising by 3.08% to 15.08 on a weekly basis, reflecting growing investor nervousness.
● Geopolitical tensions—particularly the escalating conflict between Israel and Iran—are weighing on global sentiment, and Indian equities are not immune to this uncertainty. However, relative strength in the Indian markets suggests that they may continue to outperform global peers in the near term.
● For the upcoming week, Nifty is expected to remain highly volatile, with wide-range oscillations likely. A directional trend may only emerge if Nifty decisively breaches 25,100 on the upside or breaks below the key support at 24,500.
● Options data indicates that the 25,000 level will act as a strong resistance, while 24,500 remains a crucial support zone.
● Importantly, if the index opens below 24,400 at the start of the week, it could invite further selling pressure, tipping the balance in favor of the bears.
● Given the global headwinds and sensitive technical setup, traders are advised to stay cautious as heightened volatility could dominate the week ahead.
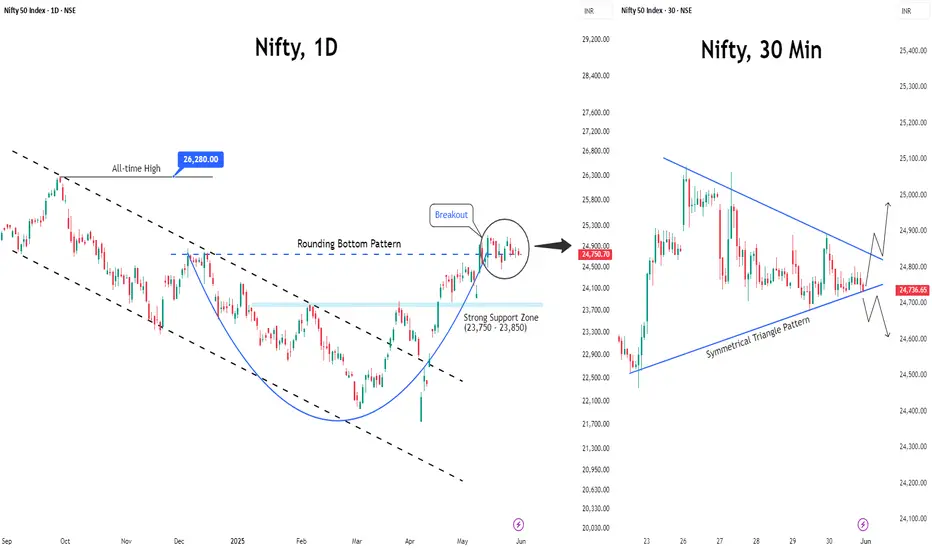
Nifty Outlook: Sideways Action Likely as June OpensAs anticipated last week, Nifty traded sideways, showing limited movement.
The current technical setup indicates the index may continue to remain range-bound in the upcoming week.
On the 30-minute chart, a symmetrical triangle pattern has formed, suggesting that a breakout in either direction could lead to a swift, short-term move.
Key Levels to Watch
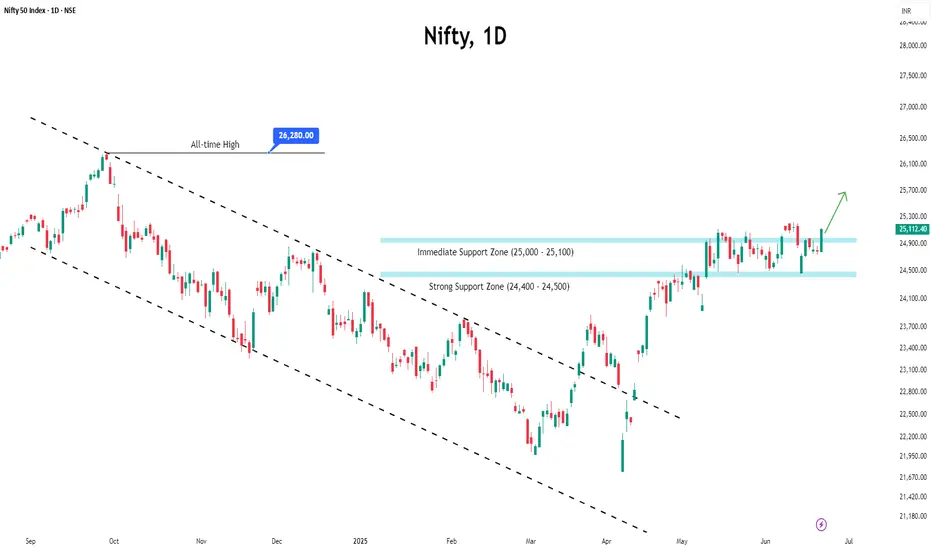
Support: 24,500
Resistance: 25,100 – 25,150
A decisive breakout above 25,100, confirmed by two consecutive closes, could pave the way for a rally toward the 25,500 mark.
Meanwhile, Foreign Institutional Investors (FIIs) have cut their long positions to nearly half of April–May levels, reflecting a more cautious stance. Still, their net buying in the previous months, along with upcoming catalysts like the RBI policy announcement on June 6 and the progress of the monsoon, could potentially reignite market momentum.
Nifty to Stay in Pause Mode Ahead of Expiry WeekAfter a strong run, the Nifty rally seems to be losing steam and has now slipped into consolidation mode. With the monthly derivatives expiry coming up next week, the market is likely to remain range-bound.
Options data suggests that Nifty has carved out a trading range between 24,500 and 25,100. Until we see a decisive move beyond either end of this 600-point band, don’t expect a strong directional trend.
A clear breakout above 25,100 could reignite bullish momentum, while a breach below 24,500 might invite fresh selling pressure. Until then, it’s all about sideways action and expiry-driven volatility.

Nifty Breaks Past 25,000: Is a New High on the Horizon?Last week, Nifty broke above the psychological milestone of 25,000, shaking off market doubts and sparking fresh bullish momentum.
◉ Key levels to watch:
The zone between 24,750–24,850 now acts as immediate support, while 23,750–23,850 remains a major support.
This rally wasn't just a technical bounce — it was fuelled by meaningful tailwinds:
● India-Pakistan Ceasefire helped ease geopolitical concerns, calming the nerves of investors.
● Cooling inflation in both India and the U.S. sparked hopes of rate cuts, improving market liquidity.
● Strong corporate earnings from majors like Hero MotoCorp , HCL Tech , and Tata Motors lifted sentiment.
With continued FII inflows , the bullish momentum is expected to persist — potentially pushing Nifty toward its all-time high in the near term.

Nifty Holds 24k: FII Confidence Hints at Bullish Trend Ahead● Despite rising war tensions, Nifty held firm above the 24,000 mark last week, showing the strength and resilience of Indian market—bolstered further by strong Q4 earnings.
● While many are expecting a sharp fall, foreign investors (FIIs) have mostly continued buying, except for last session, which suggests confidence is still intact and a major crash seems unlikely.
● Meanwhile, India VIX spiked above 21, signalling that volatility is heating up.
● Option data shows heavy put writing at the 24,000 level, marking it as a strong immediate support zone.
● On the charts, 23,800 stands out as solid technical support, and as long as Nifty stays above it, the overall mood is likely to stay bullish.
● Given this setup, the market is likely to trade in a sideways to bullish range in the coming week, unless major negative news breaks.

Nifty Outlook: Range-Bound Week Ahead?📈 Nifty wrapped up the week on a positive note, climbing about 1% and keeping the bullish sentiment alive.
🔍 However, the daily chart reveals some hesitation, as the index struggles to stay above the 24,400 mark.
📊 Looking ahead, Nifty is likely to move sideways between 24,500 and 24,000, with heavy call writing at the top and put writing at the bottom, creating a tight trading range.
⚠️ Adding to the caution, the India VIX closed above 18, hinting at increased market Volatility.
💡 Bottom line: Traders should gear up for a volatile and range-bound week ahead. Stay sharp, stay strategic!

Nifty’s Rally Faces a Hurdle at 24,400 — Volatility on the Rise● After successfully breaking out from the Double Bottom pattern, Nifty faced rejection near the 24,400 level, establishing it as the immediate resistance.
● While the index managed to close above 24,000, this level appears fragile and may not offer strong support. As long as Nifty holds above 23,800, the broader market sentiment is expected to remain positive.
● For the next bullish move to materialize, the index must decisively surpass and sustain above 24,400.
● It is also notable that India VIX rose sharply this week, climbing over 10%, indicating heightened anxiety among market participants.
● With ongoing geopolitical tensions, market volatility could remain elevated in the near term.
● Investors and traders are advised to exercise proper risk management when taking new positions to protect against potential large losses.

Banking Sector Boost Nifty to New Levels: What’s Coming Next?The Nifty has shown a clear turnaround with a double bottom pattern and has broken past the 23,800 level. This strong move is mostly thanks to the banking sector, especially with great Q4 results from HDFC Bank and ICICI Bank.
The Bank Nifty, now trading just below its all-time high, might struggle near 55,000—a zone that previously triggered a pullback, leading to consolidation in the broader market.
For Nifty, the immediate resistance is seen at the 24,000 level, where significant call writing activity may pose a hurdle. On the downside, a breach below 23,500 could signal a potential reversal, dragging the index into a downtrend once again.

Nifty Faces Resistance: Bullish Momentum Expected Above 24kNifty has breached its trendline resistance but encountered selling pressure near the 23,870 level, suggesting a possible pullback toward the 23,000 support zone.
A potential Inverted Head & Shoulder pattern is forming, which could signal a trend reversal. However, confirmation would require a decisive breakout and sustained hold above the 24,000 resistance level. Also the open interest data indicates strong call writing at 24,000, reinforcing its significance as a key resistance.
In the near term, the index is expected to trade sideways, with market participants awaiting Q4 earnings results for further directional cues. The upcoming earnings season will likely dictate the next major move in the market.

Dead Cat Bounce or Trend Reversal: What's Next for the Nifty?● After a significant decline from its all-time high, Nifty found strong support near the 22,000 level.
● Since then, the index has rebounded and recently breached its trendline resistance, signaling a potential shift in market sentiment. 🚀
📊 Open Interest (OI) Data Analysis:
● The OI data indicates a substantial increase in put open interest at the 23,000 strike price, establishing this level as a key immediate support.
● Conversely, the 23,500 strike price has emerged as a strong resistance zone, with the highest concentration of call OI.
❓ Key Question:
Has the Nifty truly bottomed out, or is there still room for further correction? 🤔
💬 Share your insights and perspectives in the comments below! 👇

Breakdown in NIFTY...Nifty has broken it's channel support line (Lower Channel Level) on weekly closing basis. Nifty's next two support after breakdown are marked with green lines.
Disclaimer: This is for demonstration and educational purpose only. This is not buying or selling recommendations. I am not SEBI registered. Please consult your financial advisor before taking any trade.

Nifty Down 16% from Highs: Eyes on Next Support at 21,800● Nifty 50 has declined by approximately 16% from its all-time high, signalling a significant correction in the market.
● The next crucial support level is anticipated around the 21,800 mark, a level where the index has historically found support on five previous occasions.
◉ OI Data Analysis
● The 22,500 strike price has the highest concentration of call writers, establishing it as a strong immediate resistance level.
● Conversely, the 22,000 strike price shows the highest accumulation of put writers, indicating robust support at this level.
◉ Valuation Analysis
● From a valuation standpoint, the Nifty appears attractive, currently trading at a Price-to-Earnings (PE) ratio of 19.7.
● This is notably below its 5-year average PE of 24.8, suggesting the index may be undervalued relative to its historical standards.

NIFTY - Breakdown OR Support...Nifty is third time at it's channel support line (Lower Channel Level). Weekly close below it will confirm breakdown.
Nifty's next two support after breakdown are marked with green lines.
Disclaimer: This is for demonstration and educational purpose only. This is not buying or selling recommendations. I am not SEBI registered. Please consult your financial advisor before taking any trade.

Nifty Under Stress: Will 22,800 Support Level Hold?● The Nifty is currently trading near its immediate support zone around the 22,800 level.
● The open interest data reveals a notable surge in call OI at the 22,800 strike price, with call OI increased by 38 lakh shares in the last trading session.
● On the other hand, put OI also rose by 20 lakh.
● This activity suggests strong support at the 22,800 level, indicating it is unlikely to be breached easily in the near term.
● However, a break below this support level could lead to a downward move toward the 22,500 level.
● In the current scenario, the market is expected to remain range-bound and choppy in the upcoming week.
