Bank Nifty spot 59610.45 by Daily Chart view - Weekly UpdateBank Nifty spot 59610.45 by Daily Chart view - Weekly Update
- Support Zone 58850 to 59350 for Bank Nifty
- Resistance Zone 59900 to ATH 60437.35 for Bank Nifty
- Bank Nifty seems more matured then Nifty to contain the unwarranted Geo-Political scenario and trending up for New ATH
Indexes

Nifty spot 25320.65 by Daily Chart view - Weekly UpdateNifty spot 25320.65 by Daily Chart view - Weekly Update
- Support Zone 24775 to 25075 for Nifty Index
- Resistance Zone 25325 to 25625 for Nifty Index
- Nothing major Domestically except for the unwarranted Geo-Political scenario affecting our Stock Markets

Bank Nifty spot 58473.10 by Daily Chart view - Weekly UpdateBank Nifty spot 58473.10 by Daily Chart view - Weekly Update
- Support Zone 57665 to 58250 for Bank Nifty
- Resistance Zone 58850 to 59350 for Bank Nifty
- Since a while the indicative Support and Resistance Zone are just an eyewash as they hardly sustain by the unprecedented Geo-Political happenings

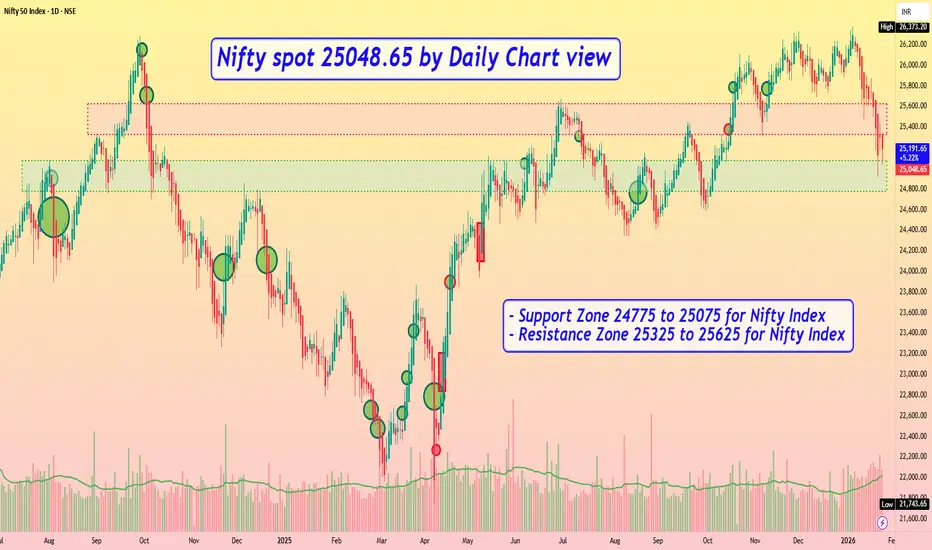
Nifty spot 25048.65 by Daily Chart view - Weekly UpdateNifty spot 25048.65 by Daily Chart view - Weekly Update
- Support Zone 24775 to 25075 for Nifty Index
- Resistance Zone 25325 to 25625 for Nifty Index
- Since a while the indicative Support and Resistance Zone are just an eyewash, as they hardly sustain by the unprecedented Geo-Political happenings
Nifty spot 25694.35 by Daily Chart view - Weekly UpdateNifty spot 25694.35 by Daily Chart view - Weekly Update
- Support Zone 25425 to 25725 for Nifty Index seems grounded
- Resistance Zone 26000 to 26200 >>> ATH 26373.20 for Nifty Index
- Nifty is facing the fear factor syndrome shadowed by clouds of caution
- Positive ripples trying to enable Nifty regain up-move with hopes for continuity

Bank Nifty spot 60095.15 by Daily Chart viewBank Nifty spot 60095.15 by Daily Chart view
- Support Zone 59125 to 59525 for Bank Nifty
- Resistance Zone 60110 to ATH 60437.35 for Bank Nifty
- Positive ripples enabling Bank Nifty regain up-move and hope for continuity

Bank Nifty spot 59251.55 by Daily Chart view - Weekly UpdateBank Nifty spot 59251.55 by Daily Chart view - Weekly Update
- Support Zone 58575 to 58900 for Bank Nifty
- Resistance Zone 59550 to 59850 for Bank Nifty
- Deep rooted Fear plus Geo-Political events dampening Domestic Markets

Nifty spot 25683.30 by Daily Chart view - Weekly UpdateNifty spot 25683.30 by Daily Chart view - Weekly Update
- Support Zone 25425 to 25725 for Nifty Index
- Resistance Zone 26000 to 26200 >>> ATH 26373.20 for Nifty Index
- Deep rooted Fear plus Geo-Political events dampening Domestic Markets

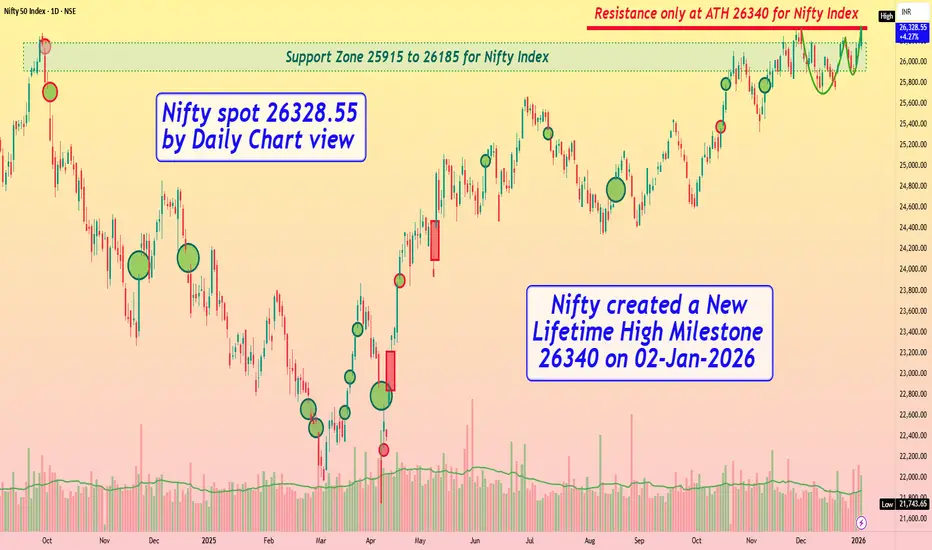
Nifty spot 26328.55 by Daily Chart view - Weekly UpdateNifty spot 26328.55 by Daily Chart view - Weekly Update
_*Nifty created a New Lifetime High Milestone 26340 on 02-Jan-2026*_
- Support Zone 25915 to 26185 for Nifty
- Resistance only at ATH 26340 for Nifty and each New ATH
- Volumes trending above avg traded quantity but with selling pressure
- Bullish Rising W formed by the neckline at previous ATH and New ATH level
- Hope to see further higher levels for the Nifty Index through the New Year 2026
Bank Nifty spot 60150.95 by Daily Chart view - Weekly UpdateBank Nifty spot 60150.95 by Daily Chart view - Weekly Update
_*Bank Nifty created a New Lifetime High Milestone 60203.75 on 02-Jan-2026*_
- Support Zone 59450 to 59750 for Bank Nifty
- Resistance only at ATH 60230.75 and each New ATH
- Volumes trending well above the average traded quantity
- Strong Bullish Bottom formed around 58650 to 58750 level
- Bullish Rounding Bottom formed by previous ATH and New ATH
- Hope to see further higher levels for Bank Nifty thru New Year 2026

Bank Nifty spot 59011.35 by Daily Chart view - Weekly UpdateBank Nifty spot 59011.35 by Daily Chart view - Weekly Update
- Bank Nifty has yet again closed within Support Zone range
- Support Zone been sustained at 58850 to 59375 for Bank Nifty
- Resistance Zone stands ground at 59825 to ATH 60114.30 for Bank Nifty
- Volumes have fallen well below the average traded quantity thru this week
- Falling Resistance Trendline still hovering on as Bank Nifty closed below trendline

Nifty 50 spot 25966.40 by Daily Chart view - Weekly UpdateNifty 50 spot 25966.40 by Daily Chart view - Weekly Update
- Nifty has closed within Support Zone range upper end
- Support Zone remains steady at 25710 to 26010 for Nifty Index
- Resistance Zone stands firmly at 26200 to ATH 26325.80 for Nifty Index
- Volumes synced closely with avg traded quantity over the entire past weeks
- Falling Resistance Trendline Breakout in a steady making process by weekly closure

Bank Nifty spot 59069.20 by the Daily Chart view - Weekly UpdateBank Nifty spot 59069.20 by the Daily Chart view - Weekly Update
- Bank Nifty has closed within the Support Zone range
- Support Zone sustained at 58850 to 59375 for Bank Nifty
- Resistance Zone stands firmly at 59825 to ATH 60114.30 for Bank Nifty
- Volumes in close sync with avg traded quantity over with intermittent spikes
- Falling Resistance Trendline weighing hard for Bank Nifty has closed below trendline

Nifty 50 spot 26046.95 by the Daily Chart viewNifty 50 spot 26046.95 by the Daily Chart view
- Support Zone is intact at 25710 to 26010 for Nifty Index
- Resistance Zone stands stable at 26200 to ATH 26325.80 for Nifty Index
- Volumes keeping stable under average traded quantity over past few days
- Falling Resistance Trendline Breakout attempts seem in the making process

Bank Nifty spot 59389.95 by the Daily Chart viewBank Nifty spot 59389.95 by the Daily Chart view
- Support Zone intact at 58850 to 59375 for Bank Nifty
- Resistance Zone stands tall at 59825 to ATH 60114.30 for Bank Nifty
- Volumes keeping stable under avg traded quantity over past few days
- Falling Resistance Trendline Breakout attempts seem in the making process

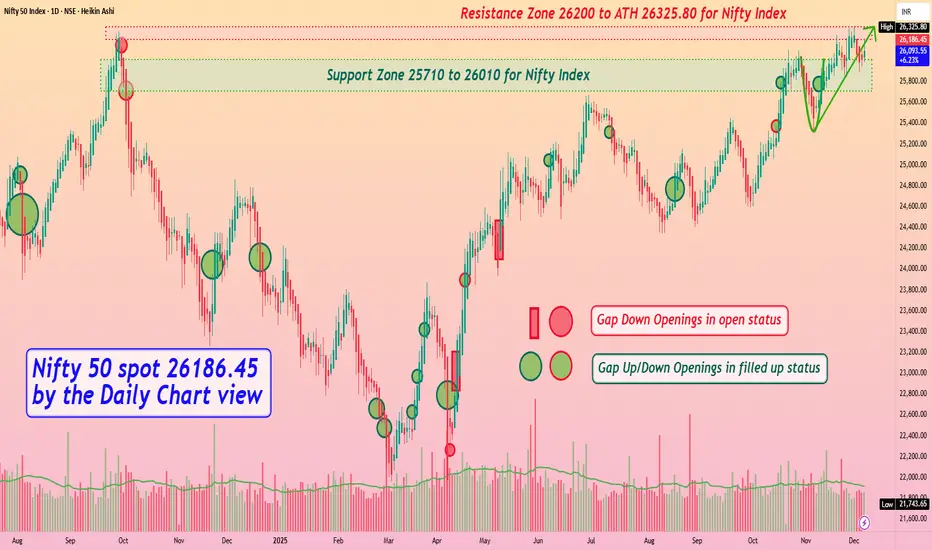
Nifty 50 spot 26186.45 by Daily Chart view - Weekly updateNifty 50 spot 26186.45 by Daily Chart view - Weekly update
- Support Zone 25710 to 26010 for Nifty Index
- Resistance Zone 26235 to ATH 26310.45 for Nifty Index
- Anticipate the subdued Bullish momentum to continue for Nifty 50
- Moreso Geo-Political tariff tricklers with certain Domestic factors creating weakness
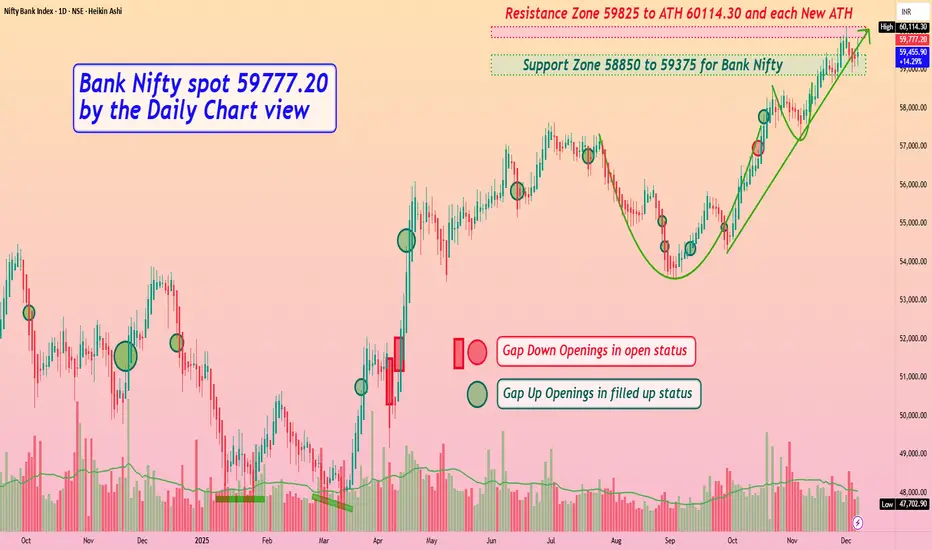
Bank Nifty spot 59777.20 by the Daily Chart view - Weekly updateBank Nifty spot 59777.20 by the Daily Chart view - Weekly update
- Support Zone 58850 to 59375 for Bank Nifty
- Resistance Zone 59780 to ATH 59897.50 and each New ATH
- Bullish momentum seems intact but Rising Support Trendline is Broken down
- Moreso Geo-Political tariff tricklers with certain Domestic factors creating weakness
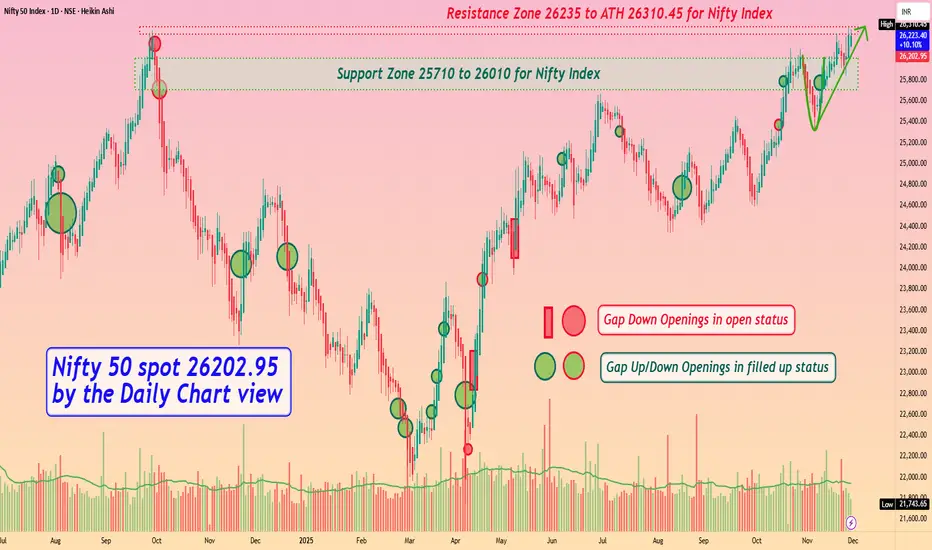
Nifty 50 spot 26202.95 by Daily Chart view - Weekly updateNifty 50 spot 26202.95 by Daily Chart view - Weekly update
- Support Zone 25710 to 26010 for Nifty Index
- Resistance Zone 26235 to ATH 26310.45 for Nifty Index
- Finally after 14 months Nifty 50 hit New Lifetime High Milestone 26310.45
- Hope to see Bullish momentum continue for Nifty 50 with positive expectation
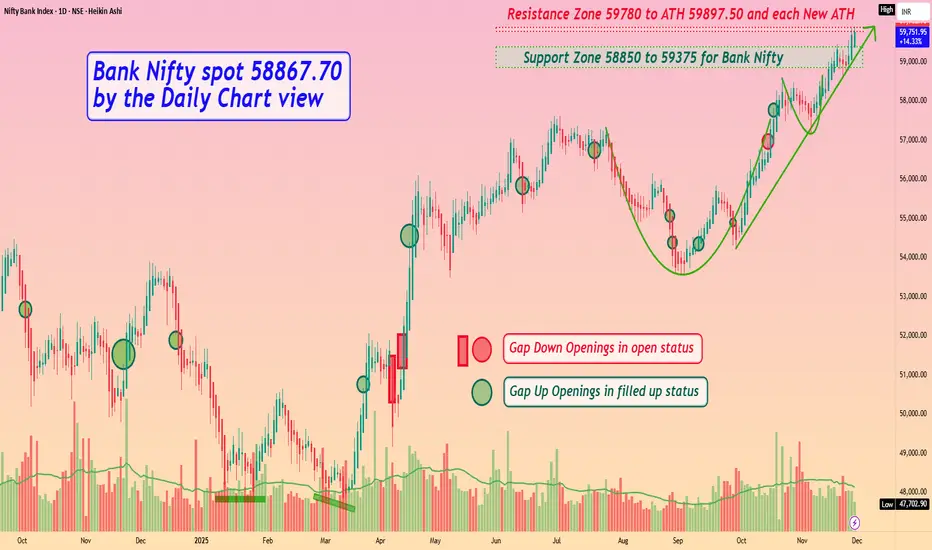
Bank Nifty spot 58867.70 by Daily Chart view - Weekly updateBank Nifty spot 58867.70 by Daily Chart view - Weekly update
- Support Zone 58850 to 59375 for Bank Nifty
- Resistance Zone 59780 to ATH 59897.50 and each New ATH
- Bank Nifty seems gotten in a habit to create ATH every other day
- Bullish momentum well trending on Bank Nifty and expect more to come
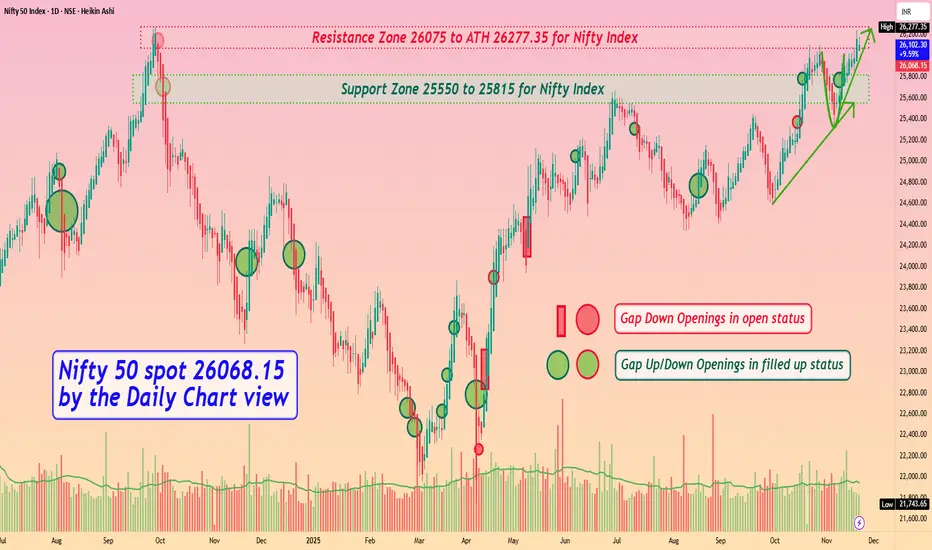
Nifty 50 spot 26068.15 by the Daily Chart view - Weekly updateNifty 50 spot 26068.15 by the Daily Chart view - Weekly update
- Support Zone 25550 to 25815 for Nifty Index
- Resistance Zone 26075 to ATH 26277.35 for Nifty Index
- Nifty keeping off to create ATH by Domestic and Geo Political events
- Bullish momentum intact but general Global paleness keeps New ATH distant
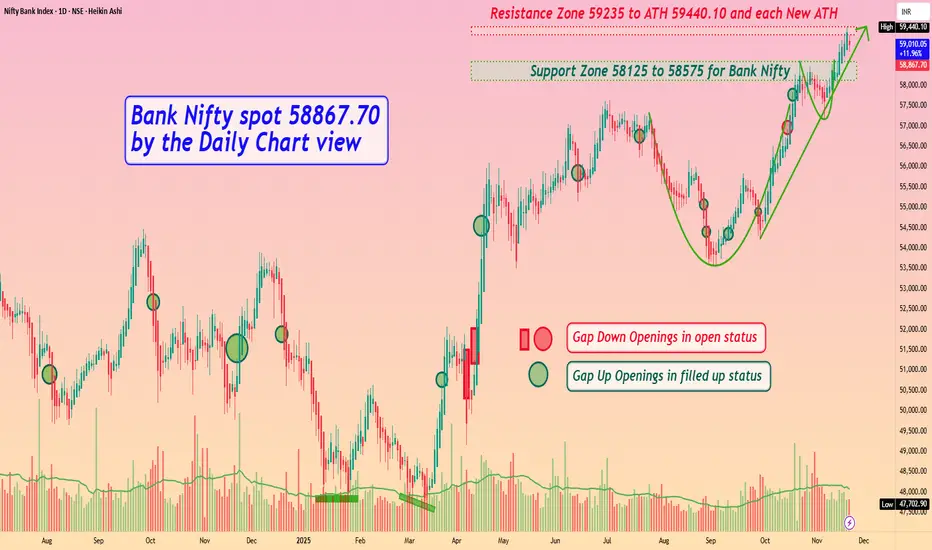
Bank Nifty spot 58867.70 by Daily Chart view - Weekly updateBank Nifty spot 58867.70 by Daily Chart view - Weekly update
- Support Zone 58125 to 58575 for Bank Nifty
- Resistance Zone 59235 to ATH 59440.10 and each New ATH
- Bullish momentum intact, aiding New ATH pretty much on daily basis
- Domestic and Geo Political events kept Bank Nifty off from creating New ATH
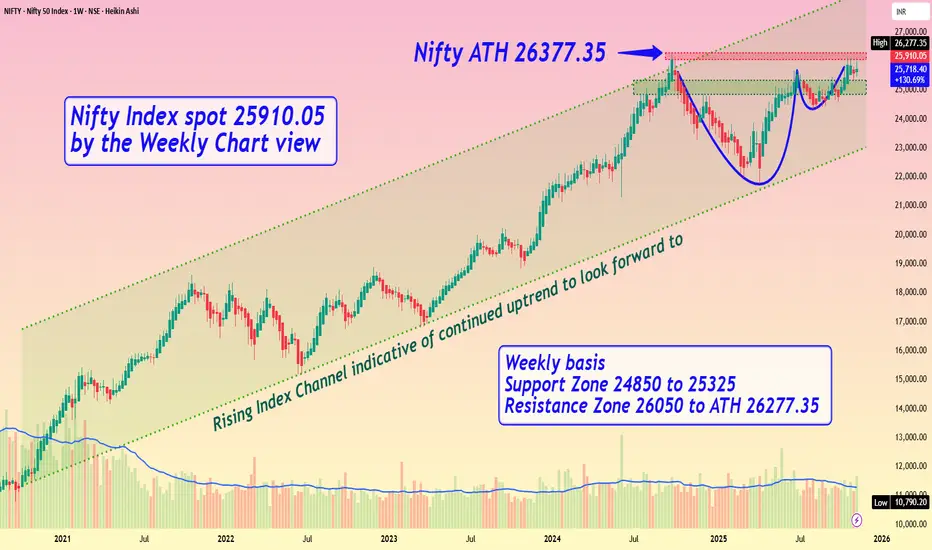
Nifty Index spot 25910.05 by the Weekly Chart viewNifty Index spot 25910.05 by the Weekly Chart view
- Weekly basis - Support Zone 24850 to 25325
- Weekly basis - Resistance Zone 26050 to ATH 26277.35
- Rising Index Channel indicative of continued uptrend to look forward to .....
- Bullish Cup and Handle pattern shows breakout expectation from Resistance Zone
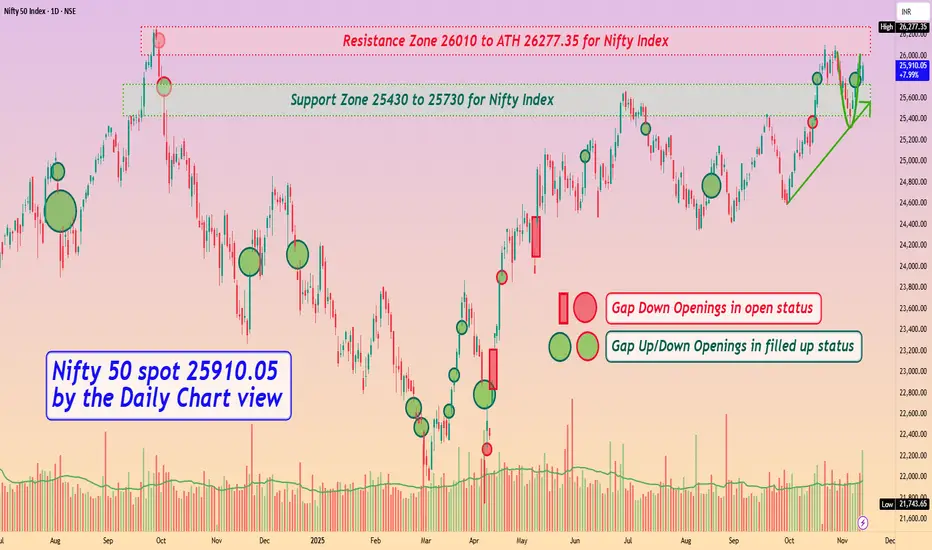
Nifty 50 spot 25910.05 by Daily Chart view - Weekly UpdateNifty 50 spot 25910.05 by Daily Chart view - Weekly Update
- Support Zone 25430 to 25730 for Nifty Index
- Resistance Zone 26010 to ATH 26277.35 for Nifty Index
- Rising Support Trendline seems respected by weekly positive closure
- Rounding Bottom Bullish momentum by Resistance Zone neckline seems sustained
- Nifty timidly shy from creating a New Lifetime High by crossing ATH final hurdle remains effectively elusive