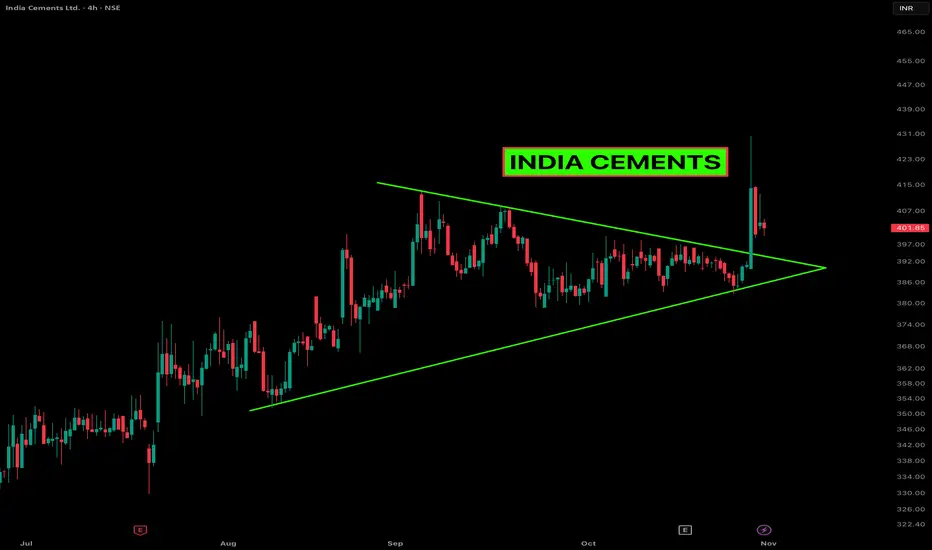
INDIA CEMENTS – Powerful Breakout from a Symmetrical TriangleAfter months of coiling price action, India Cements finally broke out of a clean symmetrical triangle on the 4-hour chart. The breakout came with a solid volume expansion, showing that bulls have been waiting for this move. Price surged quickly past the resistance line, followed by a short pullback — a healthy sign that buyers are trying to confirm the breakout zone as new support.
On the fundamentals side, the company recently approved a ₹4.4 billion capex plan for capacity expansion and modernization — a strong statement of growth intent that’s clearly adding fuel to the technical breakout.
Technically, the structure suggests momentum could continue if the stock manages to stay above the triangle’s upper boundary. The recent price compression and expansion rhythm often lead to strong directional moves, especially when backed by improving volume.
Watching how it behaves around the ₹400 zone will be key — hold above it, and the setup stays valid.
Let’s see if bulls can defend this fresh breakout.
Check out my profile and follow for more live trading setups and chart breakdowns like this.
Indiacement
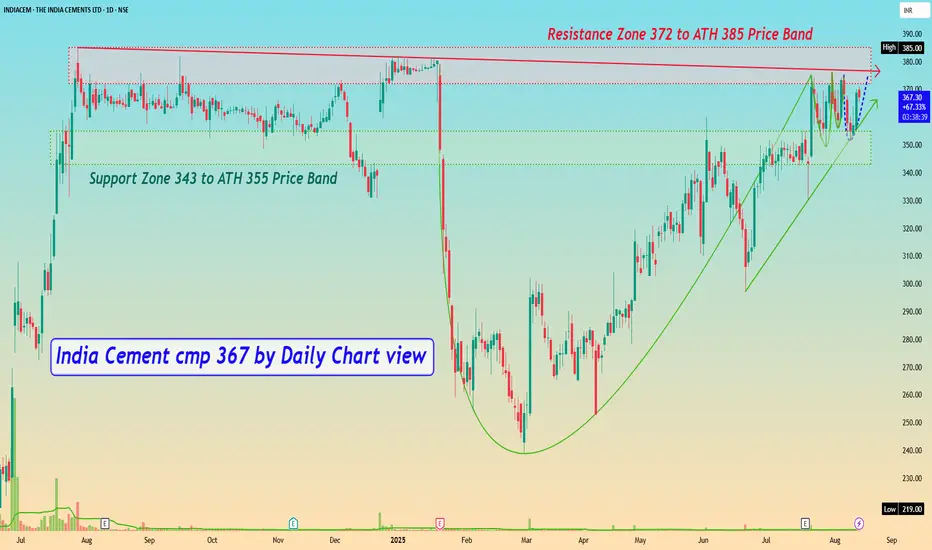
India Cement cmp 367 by Daily Chart viewIndia Cement cmp 367 by Daily Chart view
- Support Zone 343 to ATH 355 Price Band
- Resistance Zone 372 to ATH 385 Price Band
- Falling Resistance Trendline hurdle with Resistance Zone
- Bullish Cup and Handle pattern by the Resistance Zone neckline
- Rising Support Trendline seems well sustained by price momentum
- *Volumes steadily close to avg traded qty, need to increase for fresh breakout*
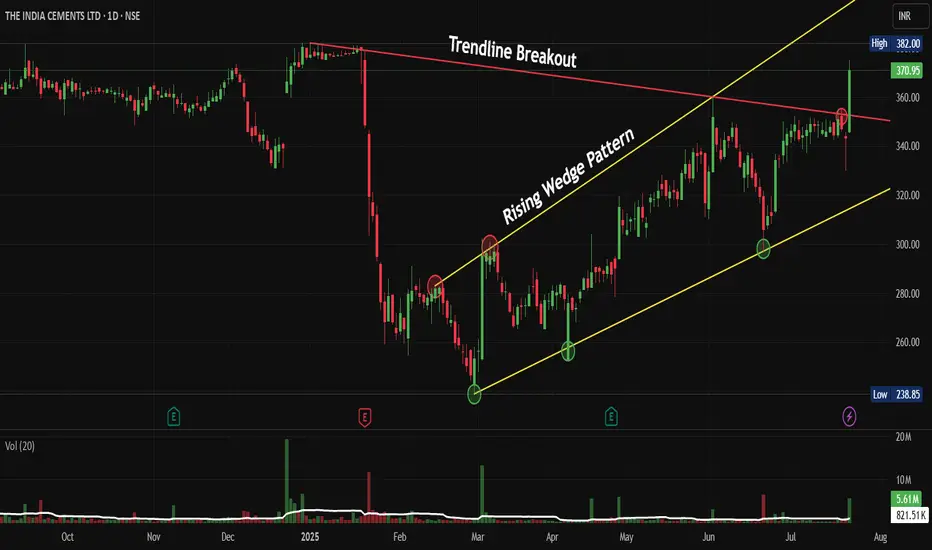
INDIACEM: Trendline Breakout Inside a Rising Wedge PatternNSE:INDIACEM Breaks Key Resistance: Is This the Start of a New Bull Run, after Ultratech Cement's Bullish Commentary Post Results?
Price Action:
• The stock has demonstrated a classic rising wedge pattern formation throughout 2025, indicating controlled accumulation
• Current price of ₹370.95 represents a significant breakout above the Trendline resistance
• The breakout is accompanied by substantial volume expansion (5.61M vs average), confirming institutional participation
• Price has recovered strongly from the March 2025 low of approximately ₹240, representing a 54% rally
Volume Spread Analysis:
• Volume spike visible during the recent breakout phase, indicating genuine buying interest
• Historical volume patterns show increased participation during key support bounces
• Current volume of 821.51K is significantly above average, supporting the breakout thesis
• Volume profile suggests institutional accumulation during the consolidation phases
Technical Patterns and Levels:
Base Formation:
• Primary base established between ₹240-280 levels during February-March 2025
• Secondary base formed around the ₹300-320 range during the wedge consolidation
• Multiple successful tests of these base levels confirm strong demand zones
Support Levels:
• Immediate support: ₹350 (previous resistance now turned support)
• Secondary support: ₹320-330 (wedge midpoint)
• Strong support: ₹300 (multiple bounce level)
• Ultimate support: ₹240-250 (March 2025 low)
Resistance Levels:
• Immediate resistance: ₹380-382 (current high area)
• Next target: ₹400-420 (measured move from wedge)
• Long-term resistance: ₹450-470 (based on pattern projection)
Technical Patterns:
• Rising Wedge Pattern: Successfully above wedge Support with volume
• Trendline Break: Clean break above descending trendline resistance
• Multiple Bottom Formation: Strong base building around ₹240-280 levels
• Volume Expansion: Confirming the validity of the current breakout
Trade Setup:
Entry Strategy:
• Primary Entry: ₹365-370 (current levels on any minor pullback)
• Aggressive Entry: ₹371-375 (momentum continuation)
• Conservative Entry: ₹350-355 (retest of breakout level)
Target Levels:
• Target 1: ₹400 (immediate resistance, 8% upside)
• Target 2: ₹430 (wedge measured move, 16% upside)
• Target 3: ₹470 (extended target, 27% upside)
Stop-Loss Levels:
• Tight Stop: ₹345 (below breakout level, 7% risk)
• Comfortable Stop: ₹320 (below wedge support, 14% risk)
• Long-term Stop: ₹300 (major support breach, 19% risk)
Risk Management:
Position Sizing:
• Conservative Approach: 2-3% of portfolio (given sector volatility)
• Moderate Risk: 4-5% of portfolio for experienced traders
• Maximum allocation: Not more than 7-8% considering stock-specific risks
Risk-Reward Analysis:
• Risk-Reward Ratio: 1:2 to 1:3 depending on entry and stop levels
• Probability of success: High (70-75%) given technical setup
• Time horizon: 3-6 months for target achievement
Portfolio Considerations:
• Diversification across cement stocks recommended
• Monitor sector rotation and infrastructure spending announcements
• Consider hedging through index options if holding large positions
Sectoral and Fundamental Backdrop:
Cement Industry Outlook 2025:
• Industry expects 7-8% growth in cement demand for FY25, driven by infrastructure development
• Government allocated ₹2.87 lakh crore for road infrastructure, supporting cement demand
• Capacity utilization expected to improve to 72% from current levels
• Addition of 35-40 million tonnes of new capacity, primarily in eastern and southern India
India Cements Fundamentals:
• Market capitalization: ₹11,511 crores as of current levels
• Manufacturing capacity: 14.75 MTPA after recent expansions
• Product mix: 35% Ordinary Portland Cement, 65% Portland Pozzolana Cement
• Notable sponsorship: IPL franchise Chennai Super Kings (brand visibility)
• Revenue: ₹1,025 crores in Q1 FY26 (-0.20% YoY decline but improving margins)
Growth Catalysts:
• Infrastructure spending boost from Union Budget 2025-26
• India cement market projected to grow at 7.6% CAGR through 2033
• Rising construction activities in the southern and eastern regions
• Potential for market consolidation benefiting established players
• Promoter holding increased to 81.49% (from 28.42% in June 2024), indicating strong confidence
Risk Factors:
• Raw material cost inflation impacting margins
• Seasonal demand variations affecting quarterly performance
• Competition from larger players like Ambuja Cements
• Environmental regulations potentially increasing compliance costs
• Regional demand concentration in southern markets
My Take:
NSE:INDIACEM presents a compelling technical setup with the successful breakout from a Trendline into a rising wedge pattern. The combination of strong volume support, improving sectoral fundamentals, and a favourable government policy backdrop creates an attractive risk-reward proposition. However, traders should maintain proper position sizing and risk management given the inherent volatility in cement stocks.
Keep in the Watchlist and DOYR.
NO RECO. For Buy/Sell.
📌Thank you for exploring my idea! I hope you found it valuable.
🙏FOLLOW for more
👍BOOST if you found it useful.
✍️COMMENT below with your views.
Meanwhile, check out my other stock ideas on the right side until this trade is activated. I would love your feedback.
Disclaimer: "I am not a SEBI REGISTERED RESEARCH ANALYST AND INVESTMENT ADVISER."
This analysis is intended solely for informational and educational purposes and should not be interpreted as financial advice. It is advisable to consult a qualified financial advisor or conduct thorough research before making investment decisions.
BULL FLAG PATTERN IN INDIA CEMENTS - POSITIONAL LONG TRADESymbol - INDIACEM
CMP - 353
India Cements is forming a Bullish Flag pattern after a good run. It is consolidating at higher levels & buyers are looking strong & not giving up. Breakout of this Flag pattern can lead the stock price towards 650 which is approx. 90% upside from current price. I have made a long position at CMP and will add more position around 390, which is breakout zone. Stoploss I am following is 330.
Disclaimer - Do not consider this as a buy/sell recommendation. I'm sharing my analysis & my trading position. You can track it for educational purposes. Thanks!

Accumulate India Cement range 350-370 before Flag pattern breaksIndia Cement Flag And Poll
Forming Flag and Pole pattern, stock has been sideways since last 5 Months.
Nifty correced more than 7 % from its all time high butno correction in stock price.
The pole as formed with huge volumn but in side ways move volume.
Buy accumulate between 350-370
Once breaks out stock could touch price of 560
SL would be 340 on weekly candle closing basis.
Buy Range 350-370
SL 340 weekly candle closing below 340
Target 560+

India Cements: 16-Year Breakout and Strong Technical MomentumHere is the multiyear breakout for NSE:INDIACEM
Technical:
Massive 16-year breakout
Strong rally
High volume / above-average volume spike
NSE:INDIACEM
Fundamentals:
Impressive gross profit margins
Prominent player in the construction industry
Liquid assets exceed any obligations
Conclusion:
India Cements is a strong buy due to its significant long-term breakout, solid technical momentum, and robust fundamentals. The stock's impressive gross profit margins and financial stability

INDIA CEMENTS BREAKOUT BUY"Buy the stock now. Set a stop loss at a price below 250 and a target price above 400. so this is my risk level. Please adjust your own stop loss and target prices according to your individual risk tolerance."

Aditya Birla group's latest addition.NSE:ULTRACEMCO purchased all of Radhakishan Damani's stake in the co and may move for larger stake in the entity. NSE:INDIACEM is one of the largest cement players in Southern India and had been in interest of many due to low promoter holding. This might be another attempt for hostile takeover of the company but one thing is for sure Srinivasan family will not bow down to money. But anyway, new partners will surely help the business grow and stock is ready to move beyond its 15 year old highs.

India Cements Smashes Resistance, Begins Epic Breakout Rally!Get ready for a wild ride, traders! India Cements Ltd. is taking us on a rollercoaster that would make even the bravest thrill-seeker dizzy. Buckle up and let's dive into the price action analysis of this cement stock that's been anything but solid.
I. Current Price Action:
Price: ₹233.15
Change: +14.55 (+2.12%)
Volume: 18,388M (Higher than the number of potholes on Mumbai roads)
II. Key Observations:
Resistance Breakthrough: After a prolonged tease, INDIACEM has finally broken through the ₹230.15 resistance level, showcasing more power than a construction site jackhammer.
200-Day Moving Average Crossover: The stock has crossed above the 200-day moving average, a bullish signal that could potentially attract more buyers like bees to honey
Consolidation Phase: The stock has been stuck in a range, trading between support and resistance, indecisive as a Bollywood villain's motives.
Volume Spike: The volume during the breakout is higher than the number of uncles offering unsolicited advice at a family gathering. This suggests conviction in the move, whether you like it or not.
Support Zone: The stock is currently flirting with the ₹204.98 - ₹210.19 support zone. If it holds, this could be a juicy buying opportunity for the daring traders out there. If not, well, you might need a stiff drink to cope.
Trading Idea:
For the risk-takers, buying the breakout could be a tempting proposition. But remember, chasing a stock after a sharp move is about as safe as trying to outrun a raging bull. Set those stop-losses tighter than your budget after a night of revelry.
Potential Targets:
🎯 Short-term: ₹250 (As ambitious as your New Year's resolutions)
🎯 Mid-term: ₹275 (Reaching for the stars, or at least the top shelf of the liquor cabinet)
Risks:
If this breakout fails to hold, the stock could tumble faster than a poorly constructed building. Keep an eye on the overall market sentiment and be prepared to run for the exit faster than a rat spotting the neighborhood cat.
Final Thoughts:
India Cements Ltd. has finally broken out of its consolidation range, potentially setting the stage for a new uptrend. Will it continue to build upon its gains, or crumble under the pressure? Only time will tell, but one thing's for sure – this stock is keeping traders on their toes more than a Bollywood dance number.
Disclaimer: This analysis is about as reliable as that one friend who always claims to have an "inside scoop." Always do your own research and consult a financial advisor before making investment decisions. Happy trading, and may your profits be as plentiful as the stars in the Mumbai night sky! 🚀💰

INDIACEM - Madras Trader x utubeINDIACEM - Madras Trader x utube
1) VCP on monthly Timeframe
2) Sharp Monthly rejection
3) Lets see

Amazing swing trading idea for 21 June Markets I daily make educational content videos for swing / positional trading

India Cem Swing Long Setup - IMO it's better to book partial gains in India Cem
- India Cem has printed 23% in two weeks post my call-out
- I think we can soon see a huge retracement in Nifty
- Stay Cautious folks, kindly do not leak your hard-earned gains.

India Cements- Cup and Handle breakout doneCup and Handle breakout done for the target of 334 with the intermediate resistances mentioned in the chart.
Note: This is for educational purpose only.


India Cements Bullish Bias Set upLow risk set up
with a Stop loss of 230
Target 1: 280s
Target 2: 295-300s
Huge volume build up

IndiacementENTRY TARGET SL Mention in the chart.
ALWAYS TAKE TRADE WITH CONFIRMATION
Note : Trading in any financial market is very risky. I post ideas for educational purpose only. It is not financial advice. Do not hold us responsible for any potential loss you may incur. Please consult your financial adviser before trading.

INDIACEMINDIACEM:- Cup and handle pattern has been formed, breakout has also been given, if the price sustains the upside, we may see upside movement
Hello traders,
As always, simple and neat charts so everyone can understand and not make it too complicated.
rest details mentioned in the chart.
will be posting more such ideas like this. Until that, like share and follow :)
check my other ideas to get to know about all the successful trades based on price action.
Thanks,
Ajay.
keep learning and keep earning.

INDIA CEMENT STOCK NSE:INDIACEM
INDIA CEMENT Stock is trading nearby resistance zone. entry point is close above the price 218.50 rupees.
Target is 230 to 235 rupees.
Stop loss set by below the support line.

1D INDIACEM (INDIA CEMENTS) - Go Short1. Bearish Engulfing Bar occured at S/R zone.
2. Fibonacci Retracement is at 61.8%
3. MACD divergence occured.

INDIACEMENT daily looking bullishINDIACEMENT Daily has trendline breakout. Inverted head and shoulder breakout. Good to buy at 208 for targets of 241 and 282 with sl below 193

INDIA CEMENTSPossible bottom formation in the stock INDIA CEMENTS , with chart making a higher low cleary showing new buyers coming inthe stock looks good to be bought above the resistance levels of 190-195 for targets of 215/230 in coming days . PS : Price has to breakout above and sustain above the resistance , view changes if breakout fails

India Cements - Trend line BreakoutThe stock has given a trend line breakout today in daily chart.
Can go long @ CMP
looks good for the targets of 196 & 204.50.

India Cements Swing TradeDownward sloping trendline breakout may happen in India cements.
Enter at any daily candle with downward rejection OR Start adding between 180-185 price range if you spot a hammer candle in 1H time frame.
Book 75% on TG1, trail the rest.
