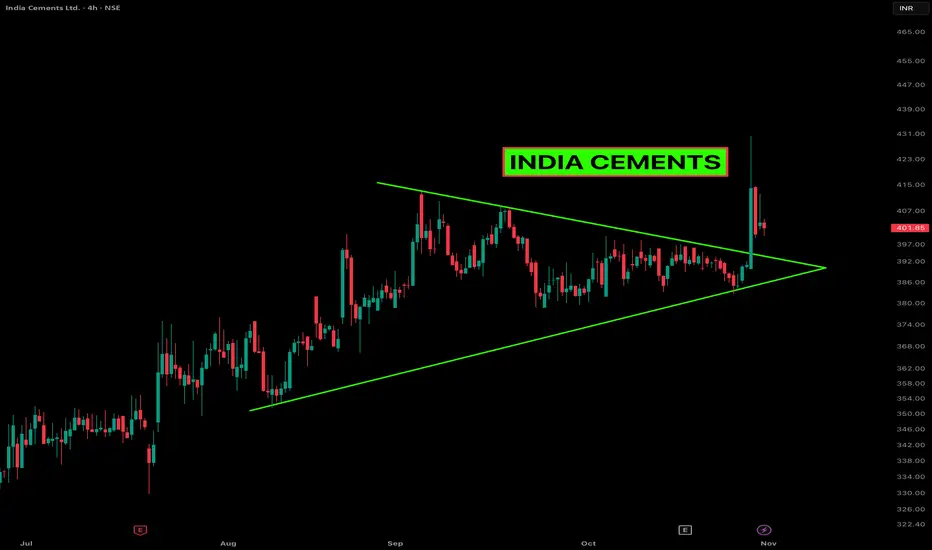
INDIA CEMENTS – Powerful Breakout from a Symmetrical TriangleAfter months of coiling price action, India Cements finally broke out of a clean symmetrical triangle on the 4-hour chart. The breakout came with a solid volume expansion, showing that bulls have been waiting for this move. Price surged quickly past the resistance line, followed by a short pullback — a healthy sign that buyers are trying to confirm the breakout zone as new support.
On the fundamentals side, the company recently approved a ₹4.4 billion capex plan for capacity expansion and modernization — a strong statement of growth intent that’s clearly adding fuel to the technical breakout.
Technically, the structure suggests momentum could continue if the stock manages to stay above the triangle’s upper boundary. The recent price compression and expansion rhythm often lead to strong directional moves, especially when backed by improving volume.
Watching how it behaves around the ₹400 zone will be key — hold above it, and the setup stays valid.
Let’s see if bulls can defend this fresh breakout.
Check out my profile and follow for more live trading setups and chart breakdowns like this.
Indiacements
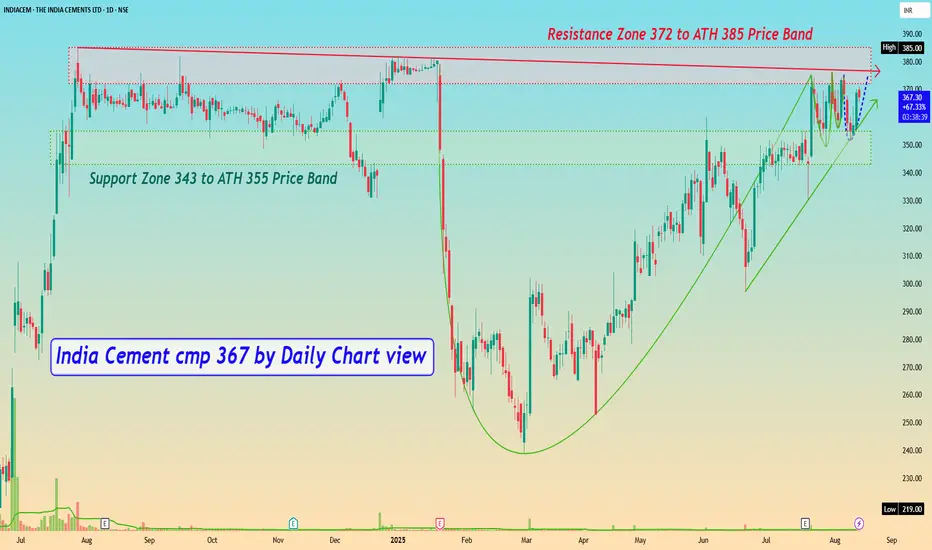
India Cement cmp 367 by Daily Chart viewIndia Cement cmp 367 by Daily Chart view
- Support Zone 343 to ATH 355 Price Band
- Resistance Zone 372 to ATH 385 Price Band
- Falling Resistance Trendline hurdle with Resistance Zone
- Bullish Cup and Handle pattern by the Resistance Zone neckline
- Rising Support Trendline seems well sustained by price momentum
- *Volumes steadily close to avg traded qty, need to increase for fresh breakout*
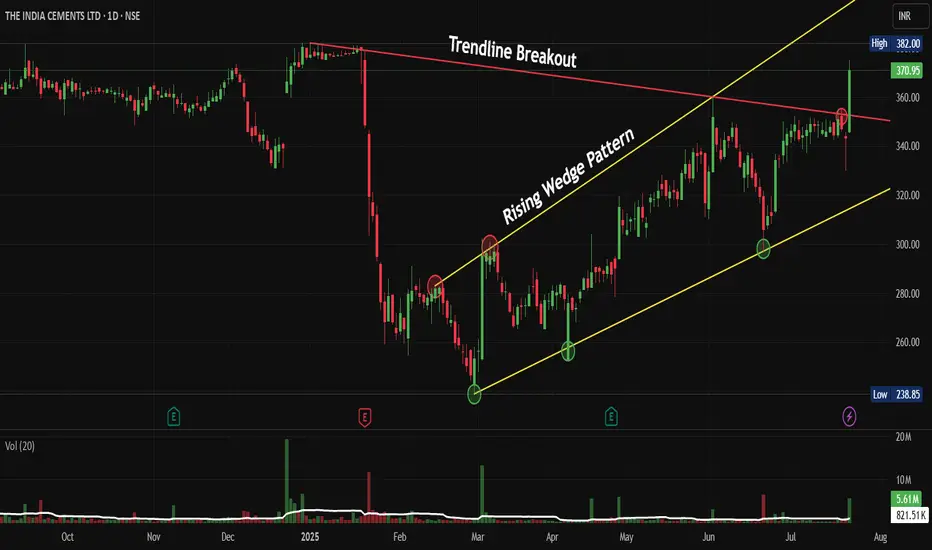
INDIACEM: Trendline Breakout Inside a Rising Wedge PatternNSE:INDIACEM Breaks Key Resistance: Is This the Start of a New Bull Run, after Ultratech Cement's Bullish Commentary Post Results?
Price Action:
• The stock has demonstrated a classic rising wedge pattern formation throughout 2025, indicating controlled accumulation
• Current price of ₹370.95 represents a significant breakout above the Trendline resistance
• The breakout is accompanied by substantial volume expansion (5.61M vs average), confirming institutional participation
• Price has recovered strongly from the March 2025 low of approximately ₹240, representing a 54% rally
Volume Spread Analysis:
• Volume spike visible during the recent breakout phase, indicating genuine buying interest
• Historical volume patterns show increased participation during key support bounces
• Current volume of 821.51K is significantly above average, supporting the breakout thesis
• Volume profile suggests institutional accumulation during the consolidation phases
Technical Patterns and Levels:
Base Formation:
• Primary base established between ₹240-280 levels during February-March 2025
• Secondary base formed around the ₹300-320 range during the wedge consolidation
• Multiple successful tests of these base levels confirm strong demand zones
Support Levels:
• Immediate support: ₹350 (previous resistance now turned support)
• Secondary support: ₹320-330 (wedge midpoint)
• Strong support: ₹300 (multiple bounce level)
• Ultimate support: ₹240-250 (March 2025 low)
Resistance Levels:
• Immediate resistance: ₹380-382 (current high area)
• Next target: ₹400-420 (measured move from wedge)
• Long-term resistance: ₹450-470 (based on pattern projection)
Technical Patterns:
• Rising Wedge Pattern: Successfully above wedge Support with volume
• Trendline Break: Clean break above descending trendline resistance
• Multiple Bottom Formation: Strong base building around ₹240-280 levels
• Volume Expansion: Confirming the validity of the current breakout
Trade Setup:
Entry Strategy:
• Primary Entry: ₹365-370 (current levels on any minor pullback)
• Aggressive Entry: ₹371-375 (momentum continuation)
• Conservative Entry: ₹350-355 (retest of breakout level)
Target Levels:
• Target 1: ₹400 (immediate resistance, 8% upside)
• Target 2: ₹430 (wedge measured move, 16% upside)
• Target 3: ₹470 (extended target, 27% upside)
Stop-Loss Levels:
• Tight Stop: ₹345 (below breakout level, 7% risk)
• Comfortable Stop: ₹320 (below wedge support, 14% risk)
• Long-term Stop: ₹300 (major support breach, 19% risk)
Risk Management:
Position Sizing:
• Conservative Approach: 2-3% of portfolio (given sector volatility)
• Moderate Risk: 4-5% of portfolio for experienced traders
• Maximum allocation: Not more than 7-8% considering stock-specific risks
Risk-Reward Analysis:
• Risk-Reward Ratio: 1:2 to 1:3 depending on entry and stop levels
• Probability of success: High (70-75%) given technical setup
• Time horizon: 3-6 months for target achievement
Portfolio Considerations:
• Diversification across cement stocks recommended
• Monitor sector rotation and infrastructure spending announcements
• Consider hedging through index options if holding large positions
Sectoral and Fundamental Backdrop:
Cement Industry Outlook 2025:
• Industry expects 7-8% growth in cement demand for FY25, driven by infrastructure development
• Government allocated ₹2.87 lakh crore for road infrastructure, supporting cement demand
• Capacity utilization expected to improve to 72% from current levels
• Addition of 35-40 million tonnes of new capacity, primarily in eastern and southern India
India Cements Fundamentals:
• Market capitalization: ₹11,511 crores as of current levels
• Manufacturing capacity: 14.75 MTPA after recent expansions
• Product mix: 35% Ordinary Portland Cement, 65% Portland Pozzolana Cement
• Notable sponsorship: IPL franchise Chennai Super Kings (brand visibility)
• Revenue: ₹1,025 crores in Q1 FY26 (-0.20% YoY decline but improving margins)
Growth Catalysts:
• Infrastructure spending boost from Union Budget 2025-26
• India cement market projected to grow at 7.6% CAGR through 2033
• Rising construction activities in the southern and eastern regions
• Potential for market consolidation benefiting established players
• Promoter holding increased to 81.49% (from 28.42% in June 2024), indicating strong confidence
Risk Factors:
• Raw material cost inflation impacting margins
• Seasonal demand variations affecting quarterly performance
• Competition from larger players like Ambuja Cements
• Environmental regulations potentially increasing compliance costs
• Regional demand concentration in southern markets
My Take:
NSE:INDIACEM presents a compelling technical setup with the successful breakout from a Trendline into a rising wedge pattern. The combination of strong volume support, improving sectoral fundamentals, and a favourable government policy backdrop creates an attractive risk-reward proposition. However, traders should maintain proper position sizing and risk management given the inherent volatility in cement stocks.
Keep in the Watchlist and DOYR.
NO RECO. For Buy/Sell.
📌Thank you for exploring my idea! I hope you found it valuable.
🙏FOLLOW for more
👍BOOST if you found it useful.
✍️COMMENT below with your views.
Meanwhile, check out my other stock ideas on the right side until this trade is activated. I would love your feedback.
Disclaimer: "I am not a SEBI REGISTERED RESEARCH ANALYST AND INVESTMENT ADVISER."
This analysis is intended solely for informational and educational purposes and should not be interpreted as financial advice. It is advisable to consult a qualified financial advisor or conduct thorough research before making investment decisions.
India Cements Reversal TradeNSE:INDIACEM is looking good for a reversal trade as it bounced back from key levels which were the previous breakout zone where good buying was seen with Huge Volumes post the news of NSE:ULTRACEMCO acquisition.
About:
NSE:INDIACEM is a leading cement manufacturing company headquartered in Chennai. It was incorporated in the year 1946 by Shri S N N Sankaralinga Iyer and Sri T S Narayanaswami. While retaining cement over the years as its mainstay, India Cements has ventured into related fields like shipping, captive power and coal mining that have purposeful synergy with the core business. The co is also a sponsor of the IPL franchise “Chennai Super Kings”.
Trade Setup:
Could be a good Positional Trade with Buy on Dips Approach that May Retest the Breakout Zones again and then go upwards thereafter as MACD starts Trending Upwards.
Target(Take Profit):
Around 335 Levels or Falling 100 DSMA.
Stop Loss:
Entry Candle Low or The Key Levels Marked.
📌Thank you for exploring my idea! I hope you found it valuable.
🙏FLLOW for more
👍BOOST if useful
✍️COMMENT Below your views.
Meanwhile, check out my other stock ideas on the right side until this trade is activated. I would love your feedback.
Disclaimer: "I am not SEBI REGISTERED RESEARCH ANALYST AND INVESTMENT ADVISER."
This analysis is intended solely for informational and educational purposes only and should not be interpreted as financial advice. It is advisable to consult a qualified financial advisor or conduct thorough research before making investment decisions.

BULL FLAG PATTERN IN INDIA CEMENTS - POSITIONAL LONG TRADESymbol - INDIACEM
CMP - 353
India Cements is forming a Bullish Flag pattern after a good run. It is consolidating at higher levels & buyers are looking strong & not giving up. Breakout of this Flag pattern can lead the stock price towards 650 which is approx. 90% upside from current price. I have made a long position at CMP and will add more position around 390, which is breakout zone. Stoploss I am following is 330.
Disclaimer - Do not consider this as a buy/sell recommendation. I'm sharing my analysis & my trading position. You can track it for educational purposes. Thanks!

Getting Accumulated Making A Flag and PoleNSE:INDIACEM is getting Accumulated and Making Flag and Pole Patterns a Breakout on the Upside we see a Swift Swing Trade. Keep in Radar.
Check out my other stock ideas below until this trade gets activated, I would love your feedback.
Disclaimer: This analysis is intended solely for informational and educational purposes and should not be interpreted as financial advice. It is advisable to consult a qualified financial advisor or conduct thorough research before making investment decisions.

INDIA CEMENTS - Swing Trade Analysis - 20th June #stocksINDIA CEMENTS (1D TF) - Swing Trade Analysis given on 20th June, 2024
Pattern: FALLING WEDGE BREAKOUT
- Weekly Resistance Breakout - Done ✓
- Volume Buildup at Resistance - Done ✓
- Demand Zone Retest & Consolidation - Done ✓
* Disclaimer

Amazing swing trading idea for 21 June Markets I daily make educational content videos for swing / positional trading

INDIA CEMENTS BREAKING OUT!CSK will qualify or not!? We don't know but India Cements is ready for an hourly tf breakout. Also has a weekly tf double bottom breakout awaited.

India Cem Swing Long Setup - IMO it's better to book partial gains in India Cem
- India Cem has printed 23% in two weeks post my call-out
- I think we can soon see a huge retracement in Nifty
- Stay Cautious folks, kindly do not leak your hard-earned gains.

India Cements Huge Breakout On Monthly ChartsBuy India Cements Only If Comes In Buying Range
Buying Range - 225-240
SL - 197 ( Weekly Closing Basis )
Target - 400

Bullish on IndiaCement The upcoming weeks you will see the breakout on IndiaCement.
340 level will achieved in this month only
nicely maintained moving average.
rsi above 60

INDIA CEMENTS BREAKOUTIndia cements seems bullish on weekly chart giving a good close by breaking down trendline resistance the volumes are looking also so good in comparison of so many last weeks so we can see a good upside in this stock although we have to take a must view on Indian indices for next week before going a long in it.

india cements can give multi year breakoutfor exit or stop loss hekinashi would be preferable as better we follow trend ,we can see how price acted in previous years and now price is over 200 dma where the bull run takes place if all time high is broken stock can move further higher
and intresting fact is damani owns around 22 - 24% and can open offer anytime and this is under valued company compared to other cement companies
& india cements current owner actually take over the company in the psat from another promoter , so this time may be damani take overs this

GREAT OPPORTUNITY IN INDIA CEMENTS Can go long in INDIA CEMENTS because of the following reasons:
Range breakout with 2x avg volume.
Trend Line breakout.
Flag Formation Breakout.
Target - 230
Entry - 203
Stoploss - 187

INDIACEM - Ichimoku Bullish Breakout Stock Name - The India Cements Limited
Ichimoku Cloud Setup :
1). Today's close is above the Conversion Line
2). Future Kumo is Turning Bullish
3). Chikou span is slanting upwards
All these parameters are showing bullishness at Current Market Price
and more bullishness AFTER crossing 206
#This is not Buy and Sell recommendation to any one. This is for education purpose and a helping hand to learn trading in Market.
# Cloud Trading
# Ichimoku Cloud
# Ichimoku Followers
I hope you all like my analysis.
Please do share your thoughts into comment section.
Please give a like, it motivates me to do analysis.

#indiacement support levels NSE:INDIACEM
📌 To Trade on This Chart, You Should Have Reversal Trading Knowledge. As Harmonic is One Of The Best Reversal Trading Strategy, But Always Remember That Harmonic Patterns Also Can Fail (there is no holly grail In Stock Market). That's Why One Should Must Have Knowledge Of Reversal Trading To Trade On Harmonic Patterns.
📌 That Dash Line Is Called PRZ, From That Dash Line To that Horizontal Simple Line Area Is Whole PRZ(Price Reversal Zone).
******whatever charts or levels sharing here or on any other platforms are just for educational purpose only, Not A Recommendation To Buy Or Sell. Please do your own analysis before taking any trade on them. We are not SEBI registered.

India Cement Chart Analysis !!📈 India Cement 📉
This Stock Broke out from a Resistance zone of 210-215 after testing two times this range on upside with a strong green candle. If you look closely this resistance also use to be a support in Jan Fab. So It makes this a Strong breakout.
Bias - Long
Target - 231, 254
SL - 205
RR- 1 : 2
All Important Supports and Resistances are drawn in chart. All levels are on closing basis.
Please have a look and revert back if you need some more study on it.
Disclaimer : Consult Your Financial Advisor Before Taking Any Decision On This Analysis.

INDIACEM | CAN BE A GOOD TRADE | INTRADAY & SWINGThe stock is rejecting the trendline for a long time, look for both opportunities in this.
We can go long once the Trendline is broken and retested.

28Feb India Cement near Channel bottom28Feb India Cement near Channel bottom
add now 195 or near 180
SL closing below 169
T 220, 240, 265

#IndiaCement Support Level NSE:INDIACEM
📌 To Trade on This Chart, You Should Have Reversal Trading Knowledge. As Harmonic is One Of The Best Reversal Trading Strategy, But Always Remember That Harmonic Patterns Also Can Fail (there is no holly grail In Stock Market). That's Why One Should Must Have Knowledge Of Reversal Trading To Trade On Harmonic Patterns.
📌 That Dash Line Is Called PRZ, From That Dash Line To that Horizontal Simple Line Area Is Whole PRZ(Price Reversal Zone).
******whatever charts or levels sharing here or on any other platforms are just for educational purpose only, Not A Recommendation To Buy Or Sell. Please do your own analysis before taking any trade on them. We are not SEBI registered.

CUP PATTERN IN INDIA CEMENTSSelf explanatory chart and for educational purpose only
Consult your financial advisor before investing
Regards,
Team know your stocks

India Cement broke its weekly highIndia Cement broke its weekly high 226.35 of 2k17 and made a day high of 243.35 with volume spurt on daily chart. It has to test the support marked in chart, one can go long if sustains above.
