NIFTY Sell on Rise | Options Trade with Defined RiskNIFTY continues to respect the upper trendline resistance, indicating a bearish bias in the near term. Price action suggests a sell-on-rise opportunity as long as the index trades below this resistance zone.
📉 Index View (Spot):
Resistance Zone: 25,750
Downside Targets: 25,650 – 25,600
Rejection from this zone could trigger another leg lower toward the mentioned targets.
📌 Trade Setup (Options Strategy)
Instrument: NIFTY 25,800 CE (20th Jan Expiry)
Buy Zone: ₹125 – ₹115
Target: ₹190
Invalidation / Risk: ₹95 (closing basis)
💡 Trade Logic:
As long as ₹125 holds, momentum remains favorable for an upside move in the option premium. A pullback into the buy zone may offer a low-risk, high-reward setup, aligned with volatility expansion near resistance.
⚠️ Risk Management is Key
Use strict stop-loss discipline
Adjust position size according to your risk appetite
Avoid overtrading in volatile conditions
📌 Disclaimer
This analysis is strictly for educational purposes and not financial advice. Please consult your financial advisor and follow your own trading plan before taking any trades.
If you find this idea useful, hit the like button and share your views—your feedback helps us create better trading insights for the community.
🚀 Trade smart. Trade disciplined.
Happy Trading,
– The InvestPro Team
Indianmarkets

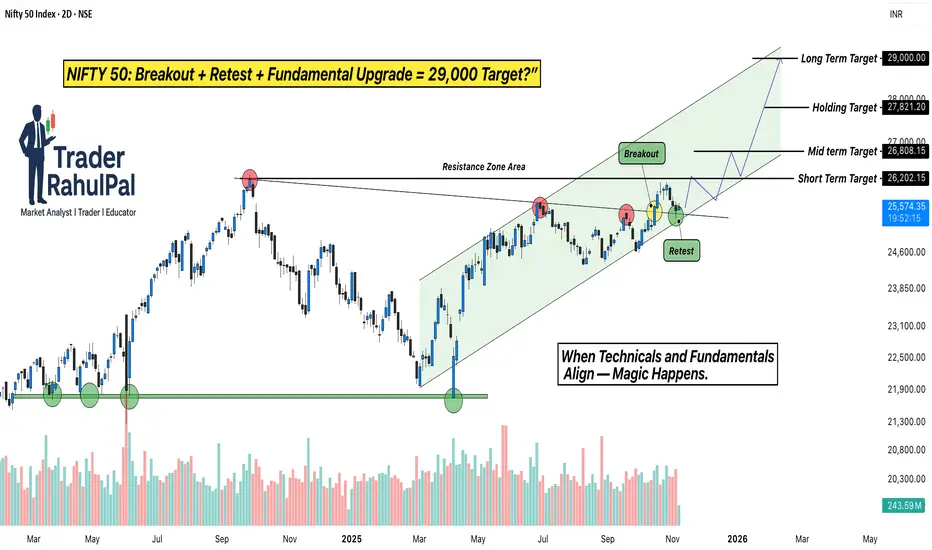
NIFTY Breakout + Goldman Sachs Upgrade = 29,000 Target?Hello Traders!
Today’s analysis is on NIFTY 50 Index, which has recently given a strong Breakout and Retest setup after months of consolidation. The index broke out from its Resistance Zone , retested the breakout area perfectly, and is now holding firmly inside a rising Trend Channel .
This move is not just technical, it’s being backed by major institutional optimism. According to a recent Goldman Sachs report , India’s stock market has been upgraded to “Overweight”, with NIFTY 50 projected to reach 29,000 by 2026 .
Why this setup is special?
Perfect breakout and retest structure with strong volume confirmation.
Channel trend remains intact, showing controlled accumulation at higher levels.
Institutional support from Goldman Sachs aligns with the technical breakout, adding conviction to the rally.
Levels to Track:
NIFTY is holding above the breakout zone near 25,000 , with immediate support seen at 24,600 . As long as the index sustains above this level, the short-term upside remains open toward 26,800 , followed by the next leg around 29,000 , matching Goldman Sachs’ longterm projection.
Rahul’s Tip:
When technicals and fundamentals align, the results are often explosive. A clean retest like this, supported by global institutional confidence, can lead to a powerful trend extension. Traders who position early usually ride the strongest part of the move.
(Analysis By @TraderRahulPal | More analysis & educational content on my profile. If this helped you, don’t forget to like and follow for regular updates.)
Disclaimer:
This analysis is for educational purposes only and should not be taken as financial advice. Please do your own research or consult your financial advisor before investing.
IPO Mania – The Emotional Trap That Costs Crores!Hello Traders!
Whenever a big IPO hits the market, excitement spreads across India like wildfire.
You’ll hear people in offices, metros, and even chai stalls saying:
“Bhai, isme allotment mil gaya toh life ban jayegi!”
But behind the hype, most people forget one simple truth, IPOs are more psychological than financial.
This is why IPO mania traps thousands of investors every year.
1. The Illusion of Guaranteed Profit
Most new investors believe every IPO will list at a premium.
They confuse “subscription numbers” with “profit certainty.”
In reality, even heavily subscribed IPOs can list at a loss.
Hype does not equal returns.
But emotions make it feel like a sure-shot win.
2. Fear of Missing Out, India’s Biggest IPO Problem
When a big brand launches an IPO, everyone wants a piece of it.
People don’t analyse profits, cash flow, or debt, they buy because the crowd is buying.
This FOMO is what leads to overpriced valuations and poor listing performance.
If you enter because “everyone else is excited,” you’re already late.
3. The Oversubscription Trap
Retail sees 20x–50x subscription and thinks it guarantees listing gains.
But heavy oversubscription means demand is emotional, not rational.
Often, the listing day profit goes to institutional players, while retail gets stuck in pullbacks.
Oversubscription tells you one thing: the crowd is emotional, not smart.
4. When You Pay for the Brand, Not the Business
IPOs of famous companies attract blind buyers who trust the “brand name” more than the balance sheet.
But the price you pay on IPO day is usually the highest price the company has ever been valued at.
You’re paying for the story, not the actual numbers.
Brand popularity doesn't guarantee long-term returns.
5. How IPO Mania Costs Crores Every Year
Retail traders enter at peak excitement and exit at peak fear.
Most IPO investors sell at the first sight of red, turning temporary corrections into permanent losses.
Millions of rupees vanish each year because people trade IPOs emotionally, not strategically
The market punishes emotional decisions, especially in IPO season.
Rahul’s Tip:
Treat IPOs like any other investment, check fundamentals, valuation, debt, promoter quality, and long-term stability.
If you buy just because it’s “new,” you’re not investing, you’re gambling.
Conclusion:
IPOs are not guaranteed money machines.
They’re emotional traps disguised as opportunities.
If you learn to stay calm when the crowd gets excited, you’ll avoid the biggest IPO mistakes and protect your capital.
If this post opened your eyes to the reality behind IPO hype, like it, comment your thoughts, and follow for more honest trading psychology insights!

Nifty Breaks Key Support at 25920 — Bears Take the Wheel!Nifty has decisively broken below the crucial support zone at 25920, and price is currently holding under this level—an early sign that bearish momentum may continue. As long as 25975 remains unbroken on the upside, the short-term bias stays negative.
A potential short opportunity may emerge on retests or continued rejection below 25920, with price targets at:
TP1: 25850
TP2: 25800
This setup remains valid unless Nifty reclaims and sustains above 25975.
📌 Disclaimer:
This analysis is for educational purposes only and is not financial advice. Always manage risk and follow your trading plan.
Your feedback drives our content and keeps everyone trading smarter. Let’s make those pips together! 🚀
Happy Trading,
– The InvestPro Team

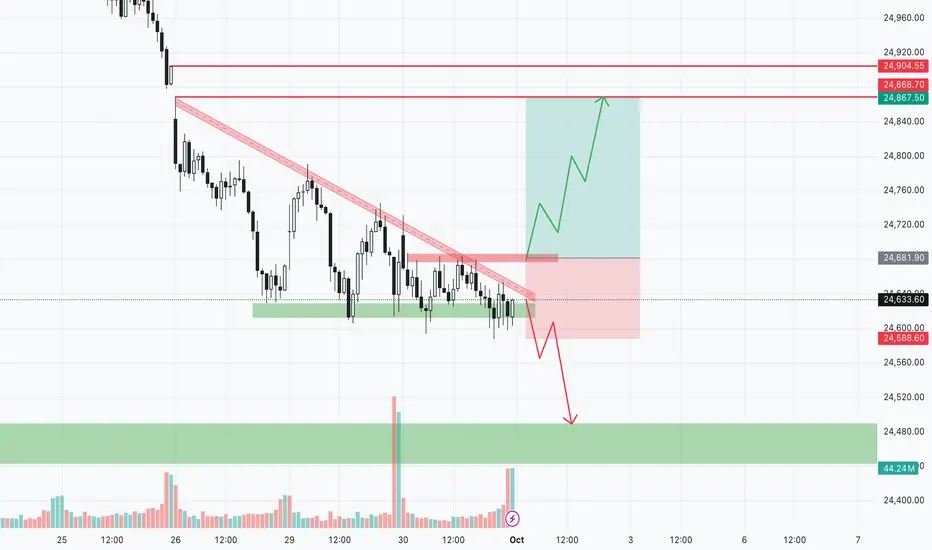
Nifty view for this weekAny positive opening tomorrow must sustain above 24600/24650 levels then can initiate long above 24680 for targets of 24850/24880/24950 with SL 1hour sustain below 24600. If break and close below 24600 then further fall can be seen.
U.S. Inhaler Play and Strong Earnings Fuel Long-Term UpsideTicker: NSE: CIPLA
Sector: Pharmaceuticals
Market Cap: ₹1.26 lakh crore+
Current Price: ₹1,572 (as of July 28, 2025)
Technical Rating: ⭐⭐⭐⭐⭐ (Strong Buy across platforms)
________________________________________________________________________________
🔍 Strong Fundamentals Back the Bullish Momentum
CIPLA has delivered an encouraging performance in Q1 FY26, reinforcing its long-term bullish narrative. The company posted a 10% year-on-year growth in profit after tax (PAT), reaching ₹1,298 crore, while revenues climbed 4% to ₹6,957 crore. These gains were driven largely by robust performance across its domestic Indian market and continued traction in Africa. The earnings beat estimates and demonstrate management's ability to maintain profitability despite sector-wide margin pressures.
Brokerages have taken note. Antique Broking has issued a bullish price target of ₹1,875, citing confidence in CIPLA’s U.S. respiratory pipeline. Meanwhile, Nuvama has pegged a more conservative target of ₹1,651, emphasizing margin resilience. Both reflect a broader positive sentiment from the street, bolstered by the company’s continued strategic execution.
Perhaps most importantly, CIPLA's U.S. growth roadmap is gaining clarity. With a stated goal of achieving $1 billion in U.S. revenue by FY27, the company is betting big on its inhalation portfolio. The upcoming launches of generic Advair and Symbicort are expected to cushion the impact from the anticipated decline in Revlimid revenues. This pipeline visibility is a key factor that differentiates CIPLA from its peers in the pharma space.
________________________________________________________________________________
📊 Technical Structure Signals Bullish Breakout
From a technical standpoint, CIPLA has just confirmed a breakout from an ascending triangle pattern, typically viewed as a continuation setup in an uptrend. On July 28th, the stock surged above the key breakout zone of ₹1,575–₹1,580, backed by a substantial increase in volume (3.84M vs 1.68M avg), signaling institutional participation. The daily close at ₹1,572 marks a technical inflection point, with the price now firmly above its 20, 50, 100, and 200 EMAs, indicating strong trend alignment.
The momentum indicators are also supportive, though cautionary. The Relative Strength Index (RSI) hovers around 71, suggesting overbought conditions, while the MACD has given a fresh bullish crossover. Additionally, the ADX (above 25) confirms trend strength. However, traders should be prepared for short-term volatility or pullbacks, as these indicators often cool off before further upside continues.
Key support levels to watch include ₹1,536, followed by ₹1,500 and ₹1,479.5. On the upside, immediate resistances lie at ₹1,592.5, then ₹1,613 and ₹1,649. A sustained close above ₹1,580–1,592 may unlock the next bullish leg toward ₹1,650+ levels.
________________________________________________________________________________
⚠️ Risks Remain – Pricing Pressure and Valuation a Concern
Despite the bullish setup, there are risks that could temper upside momentum. CIPLA’s U.S. Revlimid portfolio is facing pricing pressure, a trend impacting the broader generics market. Any further compression could drag margins in upcoming quarters. Additionally, while the company has posted solid profits, its EBITDA margin has seen a slight dip to 25.6%, suggesting limited operating leverage.
On the valuation front, CIPLA now trades at nearly 27× P/E, pricing in much of the future growth optimism. This elevates the bar for quarterly execution. From a technical lens, the RSI and stochastic indicators remain in overbought territory, raising the possibility of near-term consolidation or minor pullbacks before the next move higher.
________________________________________________________________________________
⏳ Tactical & Strategic View – Trade the Momentum, Invest in the Vision
In the short term, momentum traders should monitor how the stock behaves around the ₹1,575–₹1,580 breakout level. If the price sustains above this zone with continued volume, it signals strength and potential for a rapid move toward ₹1,600–₹1,650. However, any retracement to the ₹1,540–₹1,550 support range could present an ideal buying opportunity, especially for swing traders looking for a defined risk-reward setup.
For long-term investors, the bullish thesis rests on execution of the U.S. strategy and maintaining growth in high-margin geographies. With brokerages projecting upside toward ₹1,650–₹1,875, and a strategic focus on inhalation therapies, CIPLA is well-positioned for structural growth. That said, investors must remain patient and allow the multi-year thesis to unfold.
________________________________________________________________________________
🧠 Market Sentiment – Cautious Optimism
Overall market sentiment remains decisively positive, supported by strong earnings, a visible product pipeline, and favorable technical alignment. Yet, caution stems from the overbought technicals and valuation concerns. A prudent approach would be to accumulate on dips near ₹1,540–₹1,550, while watching for a decisive breakout and close above ₹1,580 to confirm trend continuation.
________________________________________________________________________________
📍 Investment Thesis: Accumulate with Conviction
CIPLA’s combination of strong fundamentals, a defined U.S. strategy, technical momentum, and institutional interest makes it a compelling long-term investment. Traders and investors alike can look to accumulate on dips, while treating a breakout above ₹1,580 as a confirmation trigger for further upside. Execution risk remains, but the broader setup favors a bullish bias heading into the next quarter.
For traders looking to capitalize on Cipla’s potential breakout, two entry strategies stand out. An aggressive entry can be considered in the ₹1,572–₹1,577 range, with a stop loss placed at ₹1,558. This suits momentum traders aiming to ride an early breakout, targeting ₹1,590 as an initial objective and ₹1,610+ for extended gains, offering a risk-reward ratio of 1:1 to 1:2+. Alternatively, a low-cost entry is ideal near ₹1,564 for those seeking a better cushion against volatility, with a tighter stop loss at ₹1,542. This setup also offers attractive upside toward ₹1,580–₹1,605+, maintaining similar or better risk-reward dynamics. In both cases, a decisive breakout above ₹1,580 on strong volume would confirm the bullish structure. Traders are advised to follow strict stop-loss discipline and avoid chasing if the price stretches sharply.
________________________________________________________________________________
⚠ Disclaimer (Please Read):
• These Trades are shared for educational purposes only and is not investment advice.
• I am not a SEBI-registered advisor.
• The information provided here is based on personal market observation.
• No buy/sell recommendations are being made.
• Please do your own research or consult a registered financial advisor before making any trading decisions.
• Trading involves risk. Always use proper risk management.
• I am not responsible for trading decisions based on this post.
________________________________________________________________________________
💬 Found this helpful?
Drop your thoughts or questions in the comments below ⬇️
🔁 Share this post with your trading community – let them benefit from clean charts, structured setups, and zone-based learning.
✅ Follow simpletradewithpatience for charts, clean setups, and educational content based on price action, zones, and risk-managed trades.
🚀 Trade with patience, trust your charts, and stay clear-headed!
Be Self-Reliant | Trade with Patience | Learn with Charts & Zones 📊________________________________________________________________________________

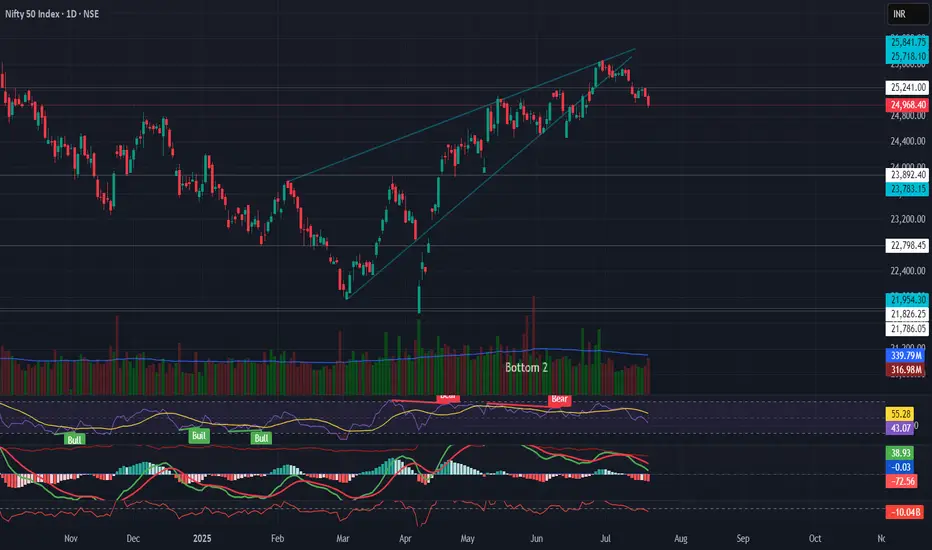
NIFTY Technical Breakdown – Rising Wedge Pattern🔻 NIFTY Technical Breakdown – Rising Wedge Pattern
The Nifty 50 has broken down from a rising wedge pattern on the daily timeframe, a bearish reversal formation that often signals distribution at the top.
📉 Key Observations:
Rising wedge breakdown after extended rally
RSI bearish divergence confirming weakness
MACD crossover turning negative
Volume gradually decreasing during the rise, indicating exhaustion
ADX flattening, showing weakening trend strength
📌 Support Levels to Watch:
23,783 – Key swing support
22,798 – Previous breakout zone
📌 Sectoral Rotation:
Defensive sectors like Pharma & FMCG are gaining strength
FII selling pressure, rising DXY, and global uncertainty continue to weigh on sentiment
⚠️ Outlook:
Caution warranted in the short term. Watch for sustained close below 24,900 for further downside confirmation. Macro and global cues to play a key role ahead.
💬 What’s your view on Nifty's near-term direction?
#Nifty50 #TechnicalAnalysis #RisingWedge #MarketOutlook #TradingView #ChartStudy #IndiaMarkets #BearishSetup #NiftyBreakdown #Puneet0130
NIFTY ON THE EDGE - BEARISH PRESSURE MOUNTING NEAR 24250Symbol - NIFTY50
CMP - 24245
The Nifty50 index has encountered significant sell-off near the 26300 level, its all-time high from September 2024. Following this peak, the index experienced a notable correction, currently trading approximately 10% below its previous high. This decline has been attributed to factors such as disappointing corporate earnings, elevated valuations, and geopolitical uncertainties. Despite these challenges, the index has shown resilience, supported by strong performances in domestic sectors like financials, consumer staples, and healthcare.
If bearish pressures persist and buyers fails to maintain above 24300-24400 levels, a further decline towards the 23000-22900 levels could occur. Conversely, sustained move above 24550 could pave the way for a potential rally, contingent on improved earnings and favorable macroeconomic conditions.
Key Resistance Levels: 24320, 24400
Key Support Levels: 24000, 23780, 23350
In summary, the Nifty50's near-term trajectory hinges on its ability to navigate key support and resistance levels, with broader market sentiment and sectoral performances playing pivotal roles in shaping its path forward. In my personal view, I am expecting a down move, and the index is likely to remain under bearish pressure in the coming sessions, especially if it fails to hold above 24300-24400 levels.

POWER GRID - INVERSE HEAD & SHOULDERS BREAKOUTSymbol - POWERGRID
Power Grid Corporation of India Ltd. is a Maha-ratna Public Sector Enterprise and a key player in the Indian power transmission sector. It operates as a central transmission utility and is involved in the planning, implementation, and maintenance of transmission systems across the country.
Recently, the stock has exhibited a notable bullish breakout after forming an Inverse Head and Shoulders pattern. A classic reversal formation signaling a shift from a downtrend to an uptrend. Following the breakout, the stock may witness a retest of the neckline zone, which now acts as a support area - around 300 to 303 range. This zone offers a favorable risk-reward entry for positional investors anticipating further upside.
The projected target from this breakout lies near the 350-355 zone, offering a potential 17-20% upside from current levels, based on the height of the pattern added to the breakout point.
For prudent risk management, a stop loss below 280 is advisable, just below the right shoulder, to protect against unexpected downside.
Overall, the breakout of a well-formed Inverse Head and Shoulders on a higher time frame charts presents a bullish outlook for Power Grid, making it a strong candidate for medium-term investment consideration.
Disclaimer: The information provided here should not be construed as a buy or sell recommendation. It reflects my personal analysis and my trading position. Please consider this trading idea for educational purposes only. Thank you!

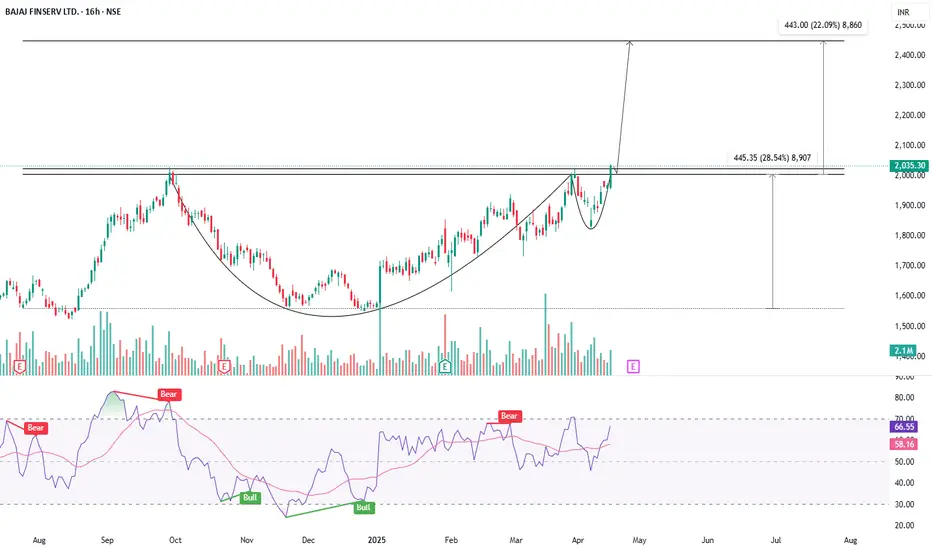
CUP & HANDLE ON THE CHART - IS BAJAJ FINSERV READY FOR LIFTOFF?Symbol - BAJAJFINSV
Bajaj Finserv Ltd. is a leading Indian financial services company engaged in insurance, lending, asset management, and wealth advisory. It operates through its subsidiaries like Bajaj Finance and Bajaj Allianz, making it a major player in the sector. The company is classified as a Systemically Important Non-Deposit taking NBFC.
Bajaj Finserv has recently shown a strong bullish breakout after forming a cup and handle pattern on the larger TF charts - A widely recognized bullish continuation setup. The breakout has occurred with notable volume, lending credibility to the move and signaling the potential for a sustained uptrend.
The stock is currently trading just above its breakout point, and a retest of the breakout zone 1980-2000 is possible. This area now acts as a strong support and provides an attractive entry opportunity for long positions.
Based on the technical pattern, the medium-term target for the move is projected at around 2450, implying an upside of nearly 22% from current levels. The pattern’s depth and the strength of the breakout support this target.
For risk management, a stop loss around 1800 is suggested, just below the handle's base, providing a good risk-to-reward setup.
The formation and breakout from the cup and handle pattern on a higher time frame adds strong bullish conviction to Bajaj Finserv’s chart. For investors looking to ride a medium-term trend with favorable risk-reward dynamics, this may be an opportune moment to enter or accumulate.
Disclaimer: The information provided here should not be construed as a buy or sell recommendation. It reflects my personal analysis and my trading position. Please consider this trading idea for educational purposes only. Thank you!
NIFTY50 - AN INGISHT FOR INVESTORSSymbol - NIFTY50
CMP 25305
If you are a long term investor, one thing that will help you to decide when to invest - Nifty monthly RSI.
As and when RSI moved above 80, markets uniformly correctly (around 20% usually) & as and when RSI came below 40 level, markets uniformly rallied.
Now RSI is at 82
Fundamentals are also showing that overall market is modestly overvalued.
What you want to do or should you be worried ?
tell me in comments below.
P.S. : I'm out of all longs & have entered shorts.

NIFTY50 - DON'T MISTAKE THIS RALLY FOR A TREND REVERSALSymbol - NIFTY50
CMP - 23350.40
The Nifty50 is still trading within a bearish technical structure. As of now, the index is currently trading at 23350 after a strong up move. Given the ongoing downtrend and resistance levels, there is a strong possibility that Nifty may experience a pullback from these levels.
I had shared a trading idea on Nifty50 when it was trading around the 21900-22100 levels, stating that a retracement on the long side was due and that it could easily touch the 22800-23000 levels. Nifty gave a strong up move from those levels, and both targets have been reached.
Upon closer inspection of the Nifty chart, it is evident that the index is still in a downtrend, making lower lows since the beginning of its fall. We witnessed a sharp rally from the 21800-22000 zone, which is common in a bear market. Such sharp rallies are often misinterpreted as trend reversals, but in reality, the faster these rallies come, the quicker they tend to get sold.
The bearish structure remains intact and has not been broken. For now, Nifty still appears to be a sell on rise. For those following the trend, the 23300-23600 zone is the ideal range to go short, as this area aligns with a strong resistance zone and the formation of another swing high.
At this point, it seems likely that the market may consolidate between the 23300-23600 zone before showing a sharp down move. If the market does reverse its trend, we can only consider that possibility after a breakout above the 24000 zone, which would be a key signal for a trend shift.

Gold Breaks Out! Is This the Start of a Massive Rally?🚀 Gold Breaks Out! Is This the Start of a Massive Rally? 🔥
🌟 Gold Rises 1% as USD Weakens Amid Recession Fears
💰 Market Overview
Gold remains well-supported as market uncertainties continue to fuel demand for safe-haven assets. However, any positive developments in negotiations between Russia and Ukraine could reduce risk premiums.
🌍 Trade policies imposed by former U.S. President Donald Trump on key trading partners had previously caused significant volatility in global markets, raising concerns about economic growth.
📊 Key Economic Events
All eyes are now on the upcoming U.S. inflation reports, with the CPI (Consumer Price Index) and PPI (Producer Price Index) scheduled for release on March 12 and 13, respectively. According to a Reuters poll, the U.S. CPI for February is expected to increase by 0.3%.
⚠️ With these economic data releases ahead, investors need to stay alert, as this week’s fundamental news could significantly impact gold’s movement. From a technical perspective, gold seems well-supported at key levels, indicating potential strength in the market.
📈 Technical Outlook & Trade Setup
✅ Gold has broken out of a parallel downward channel with a strong breakout around $2898 - $2900, forming a continuation pattern (CP) and surging 15 - 20 prices afterward.
📌 Yesterday’s break of the bearish structure and the subsequent rally suggest that gold still has strong buying momentum, backed by fundamentals favoring USD and gold.
📊 Key Levels to Watch:
📍 Major Resistance Levels: $2927 - $2944 - $2954
📍 Major Support Levels: $2899 - $2884 - $2873
📌 Trading Zones
🟢 BUY ZONE: $2884 - $2882
🔹 Stop Loss (SL): $2878
🎯 Take Profit (TP): $2888 - $2892 - $2896 - $2900 - $2906 - $2910
🔴 SELL ZONE: $2943 - $2945
🔹 Stop Loss (SL): $2949
🎯 Take Profit (TP): $2940 - $2936 - $2932 - $2928 - $2922
📢 Final Thoughts
🕵️♂️ Tonight, we have a crucial CPI release that could shape gold’s trend for the week. Currently, gold is moving unpredictably in lower timeframes, sweeping both highs and lows as the market transitions from Spring-Winter to Summer-Fall phases.
📌 Traders should be cautious and wait for a clearer trend before making aggressive moves. Stick to your TP/SL levels to protect your capital.
GOOD LUCK & TRADE SAFE! 🚀

TATA COMMUNICATIONS - TRADING AT MAJOR SUPPORT ZONESymbol - TATACOMM
CMP - 1388
Tata Communications Ltd. has shown weakness over the past few months, with the overall technical structure indicating a bearish outlook. However, the stock has recently reached a major demand zone, which lies between the 1380-1350 range, a level that has held significant support in previous price actions since 2021. This zone could act as a strong demand area, potentially offering a good trading opportunity at current prices.
The stock has been under selling pressure in the short term, but as it approaches this demand zone, the probability of a reversal or at least a short-term bounce increases. The technical indicators suggest that the stock is at a crucial level where the demand could pick up, leading to a possible upward movement from current levels. Although the broader trend has been bearish, the price action near this support level creates an attractive risk-reward setup.
Given the recent price action, I am taking long positions in TATACOMM Futures at 1388. I will look to add more positions if the price reaches 1360-1350 range. My SL is set at 1325 to manage risk, ensuring protection in case the price fails to hold the demand zone and continues lower.
The target I am expecting is 1520, which represents more than a 10% upside from current levels. This target aligns with previous resistance areas and the potential for a bullish move once the stock stabilizes at the demand zone.
Disclaimer: The information provided here should not be construed as a buy or sell recommendation. It reflects my personal analysis and my trading position. Please consider this trading idea for educational purposes only. Thank you!

IRCTC - BULLISH & BEARISH BIASSymbol - IRCTC
CMP - 900
IRCTC is currently trading at an interesting zone. After a good rally in the last year, This stock is following a trendline resistance making lower - lows price action & showing no strength of price growth.
I am tracking this stock from quite some time. I will be interested in long positions on breakout of 940-950 resistance zone. I will be even more interested in shorting this stock if this stock breaks 850 on downside & sustain below it as it stock is making a Head & shoulders pattern in larger time frame.
Such patterns tends be more accurate on larger time frame & don't fail if gets activated. This pattern will get activated if price break neckline on the downside then I will be shorting futures for more downside targets.
What will happen? Only the time will tell. My job is to keep it on radar & enter in longs above 950 & enter in short below 850.

Nifty 50: Key Levels to Watch for Tomorrow’s Trading SessionNifty 50 Index Analysis
Timeframe: 15-Minute Chart
Current Price: ₹23,990.15
Key Levels to Watch:
Resistance Zone:
Immediate resistance at ₹24,046. Targets are ₹24,148 (1st Target), ₹24,208 (2nd Target), and ₹24,309 (3rd Target).
Support Zone:
Immediate support at ₹23,927. A break below this level could lead to ₹23,788.
Bullish Scenario:
Buy above ₹24,046 with potential targets of ₹24,148, ₹24,208, and ₹24,309. The trendline and support zone near ₹23,927 provide a solid base for bullish momentum.
Bearish Scenario:
Sell below ₹23,927, targeting ₹23,788. A breakdown below the support zone and trendline could trigger bearish momentum.
Indicators:
RSI is showing weakness near 38, indicating a need for caution in the short term. MACD has a bearish crossover, signaling possible downside unless momentum strengthens.
Conclusion:
Watch for a breakout above ₹24,046 for bullish opportunities. Stay cautious below ₹23,927 as it may lead to further downside. Always plan trades with proper stop-losses to manage risk effectively.
Disclaimer: - Please always do your own analysis or consult with your financial advisor before taking any kind of trades.
If you found this analysis insightful, don’t forget to hit like and follow for more such content!
For related trading ideas and educational posts, check out our profile @TraderRahulPal Let’s learn and grow together!

OIL INDIA - SWING TRADE ON LONG SIDESymbol - OIL
OIL is currently trading at 420
I'm seeing a trading opportunity on buy side.
Buying OIL Futures at 420
I will add more long position at 410, if comes.
Holding with SL of 397
Targets I'm expecting are 445 - 460 & above.
Disclaimer - Do not consider this as a buy/sell recommendation. I'm sharing my analysis & my trading position. You can track it for educational purposes. Thanks!

NBCC ready for a breakoutWith NBCC receiving an order of 71BN and also stock is at 200 SMA , breaking 103 will give us a good breakout.
Safe traders can take trade after it crosses 105.
Happy Trading

BUY HINDCOPPERBuy hindcopper as it is oversold stock, making inverted head and shoulder also ema crossover giving a strong buy signal.

NIFTY50 DEC OPTION SWING TRADE IDEA FOR HUGE PROFITNIFTY50 is currently trading at 26075 & trading at new life time high.
There are a lot of fundamental, technical & valuation reasons why I am taking this trade.
I'm seeing a trading opportunity with very good RR.
I am taking long positions in NIFTY DEC MONTHLY 25000 PE at CMP 240
I will add more quantity around 100-120, if comes & Hold with stoploss of 40
Risk in this trade is 140 points & reward is huge.
If any external event takes place which is not factored in by local & global markets, Then we can see 10-20% correction easily given current overvaluations. Hence I am taking this trade. I am not taking this trade to hedge my portfolio. I am already sitting at 75% cash & only 25% capital is invested as of now. I have bearish view on market at current valuation & I have 3 months time too which makes this trade a perfect trade with great RR.
ENTRY, SL & TARGETS are mentioned in the trading idea. If any panic happens, In that case we may see all targets getting hit.
Disclaimer - Do not consider this as a buy/sell recommendation. I'm sharing my analysis & my trading position. You can track it for educational purposes. Thanks!

BAJAJ FINANCE - SWING TRADE ON SHORT SIDESymbol - BAJFINANCE
BAJFINANCE is currently trading at 7800
I'm seeing a trading opportunity on sell side.
Shorting BAJFINANCE Futures at CMP 7800
I will be adding more position if 8000 comes & will hold with SL 8220
Targets I'm expecting are 7450 - 7225 & 7050
Disclaimer - Do not consider this as a buy/sell recommendation. I'm sharing my analysis & my trading position. You can track it for educational purposes. Thanks!

ASIAN PAINTS - POSITIONAL SWING TRADE IDEA IN CASHSYMBOL - ASIANPAINT
Asian Paints is the largest home decor company in India. The 80+ year old company has major brands like Asian Paints, Berger, Apco etc. under its umbrella. The co. is into wall paints, wall coverings, waterproofing, texture painting, wall stickers, mechanized tools, adhesives, modular kitchens, sanitaryware, lightings, soft furnishings, and uPVC windows.
Asian Paints is currently trading between two major supply and demand zones since a long time. CMP of Asian paints is 2700 & It is approaching demand zone on weekly basis.
I'm seeing a positional trade opportunity on buy side. I usually trade in futures but this time I'm taking this trade in cash as general elections are due in June which is a major event for market makers.
Current PE of Asian paints is 46 which makes it a value buy at CMP. I'm investing 50% allocation today at CMP 2700. I'll invest 50% more at 2580-2600 levels & will hold this position with 2500 as SL. Targets I'm expecting on long side will be 2950 - 3220 - 3410 & new ATH. I'm ready to hold this trade for 3 - 6 months.
Disclaimer - Do not consider this as a buy/sell recommendation. I'm sharing my analysis & my trading position. You can track it for educational purposes. Thanks!

BIRLA SOFT - SWING TRADE ON LONG SIDESymbol - BSOFT
BSOFT is currently trading at 565
I'm seeing a trading opportunity on buy side.
Buying BSOFT Futures at 565
Holding with SL of 545
Targets I'm expecting are 590 - 618 - 650
Disclaimer - Do not consider this as a buy/sell recommendation. I'm sharing my analysis & my trading position. You can track it for educational purposes. Thanks!
