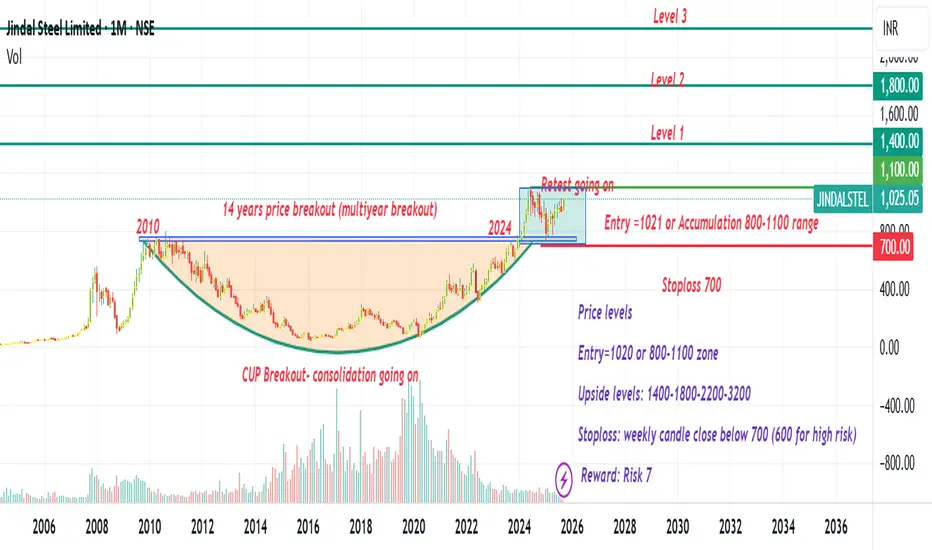
Jindal Steel multiyear price breakout #Nifty #JINDALSTELPrice is breaking out after 14 years, showing a multi-year price breakout.
Maybe a a Good chance for a Multi-bagger return
Entry: Current price or 800-1100 range
Stoploss: monthly or weekly close below 700
Upside levels: 1100-1400-1800-2200-3200
Analysis just for a learning point of view
Not a recommendation
Indianstocksanalysis
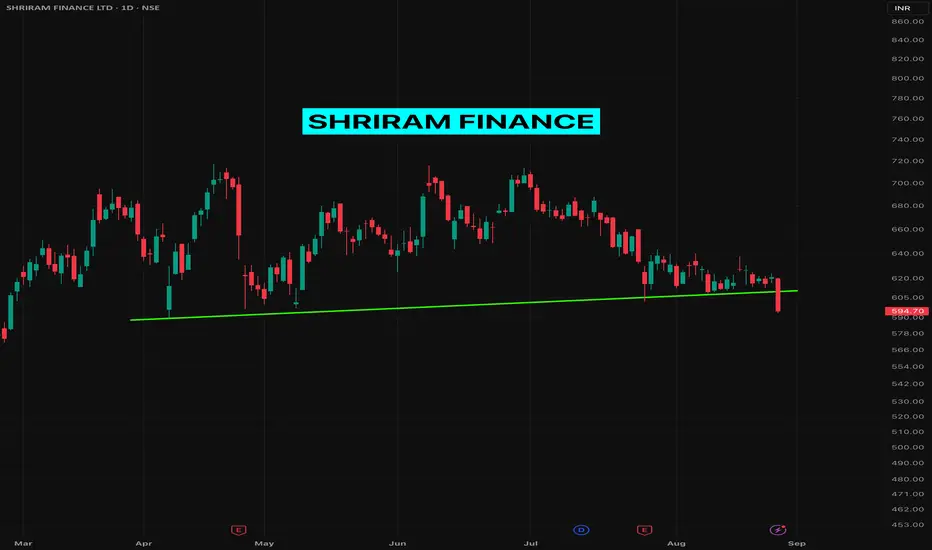
Shriram Finance BREAKING DOWN a #TrendlineSupport Shriram Finance BREAKING DOWN a TrendlineSupport with quite decent volume.
I am looking at the daily time frame here and filled some SHORT position today before the closing bell.
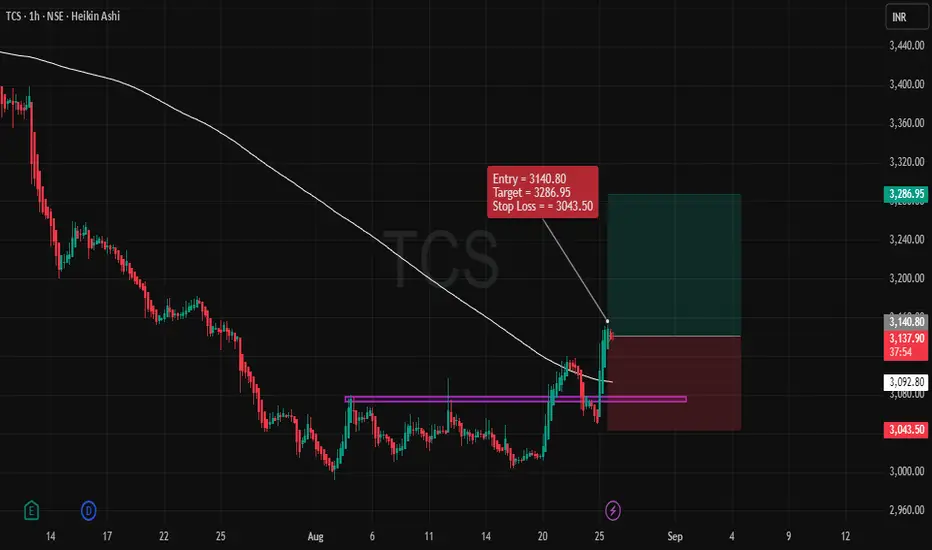
TCS – Bullish SetupSummary:
This trade setup is based on a bullish momentum seen in the recent price action of TCS. We are entering the position with the expectation that the price will continue to rise, following a significant upward breakout. The entry, stop loss (SL), and target price (TP) levels are set, and the risk-to-reward ratio (RRR) is favorable.
Key Points of the Trade:
Entry Point:
The entry for this position is at 3140.80, which is above the recent support level, indicating the continuation of the upward trend. The entry is triggered as the price has recently started to break through a key resistance zone, suggesting that the bullish momentum is likely to continue.
Stop Loss (SL):
The stop loss is set at 3043.50, just below the recent support zone. This ensures that we have a protective exit if the market reverses. Placing the stop loss here helps mitigate risk in case the trade goes against us.
Target Price (TP):
The target for this trade is 3286.95, a price level that corresponds to a recent resistance point. This target has been chosen based on the potential upside movement following the breakout, providing a good area for price to reach based on historical price action.
Risk-Reward Ratio (RRR):
With the entry at 3140.80, the stop loss at 3043.50, and the target at 3286.95, the RRR stands at 1:1.5. This is a healthy ratio, ensuring that the potential reward outweighs the risk, which is crucial for effective swing trading.
Market Context:
The price has recently bounced off a support level, and we are observing strong bullish momentum as the price moves above the resistance area. This suggests the market may continue its upward movement, making the trade setup valid.
Confirmation:
The recent price action and the movement above key levels provide confirmation of the trade. Additionally, the overall market sentiment for TCS is positive, which further validates the bullish trade idea.
Conclusion:
This trade setup is a bullish scenario for TCS, with a clear entry, stop loss, and target price. The risk-to-reward ratio is favorable, making this a logical and worthwhile trade to consider for swing trading on the 1-hour timeframe. Keep an eye on any changes in momentum or price action that may suggest a reversal, but as of now, the trend looks strong.
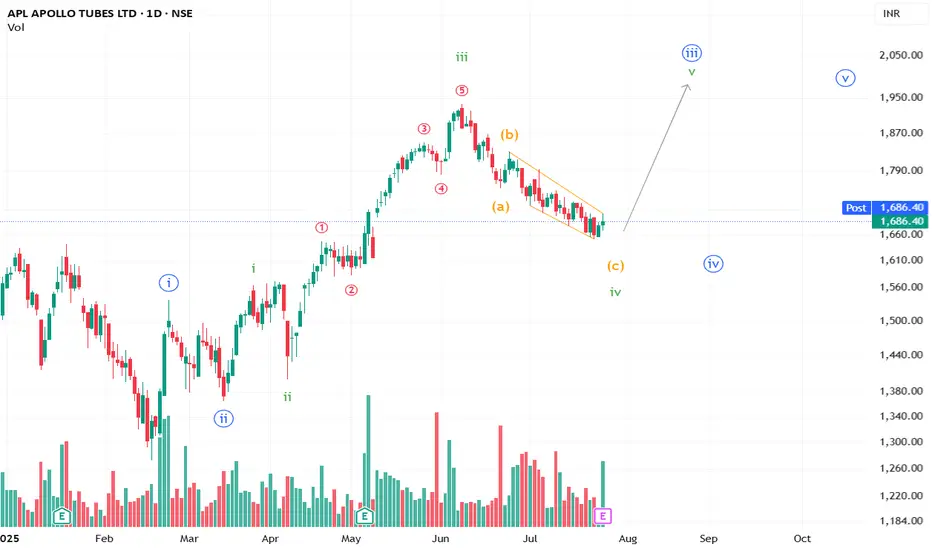
APL Apollo Tubes Limited Set to Surge?A well-formed ABC correction to the downside appears to be losing steam, and an upward move may take shape.
**This is an educational market outlook, not investment advice. Please consult a SEBI-registered advisor before taking any investment decisions.**
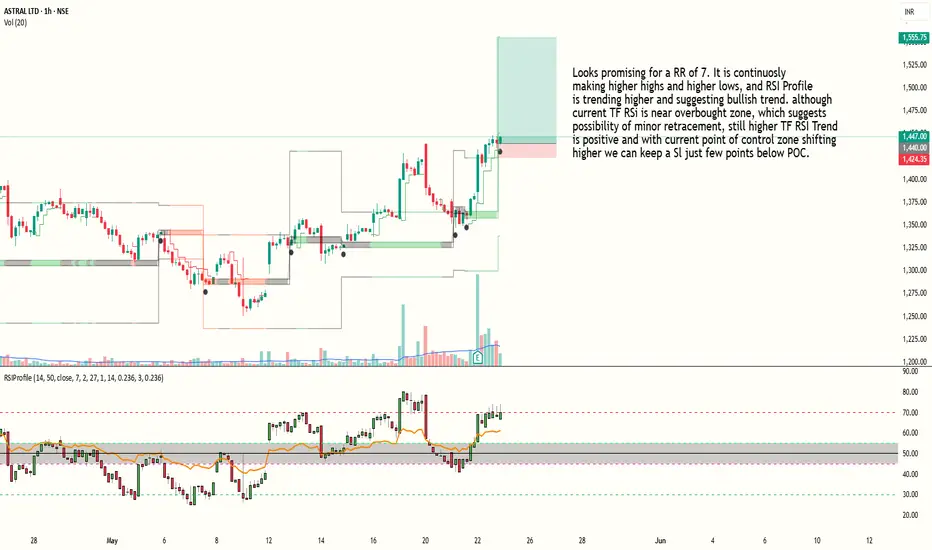
Bullish trade building up in Astral with RR of 7Looks promising for a RR of 7. It is continuosly making higher highs and higher lows, and RSI Profile is trending higher and suggesting bullish trend. although current TF RSI is near overbought zone, which suggests possibility of minor retracement, still higher TF RSI Trend
is positive and with current point of control zone shifting higher we can keep a Sl just few points below POC.
Entry at 1440
SL around 1423
Target around 1555
Risk to reward ratio is around 7.
Indicator used : RSI Hybrid Profile (Link available in my profile)
PS : This is an Educational post and doesn't constitute any trading or financial advice, just do your own research.
Nifty 50 Daily Timeframe: Will the Downtrend Finally Break?The latest daily timeframe chart of Nifty 50 still shows the index trading within a well-defined descending channel, but it is now at a crucial resistance zone near the upper boundary of the trendline. This zone will determine whether the market is ready for a bullish breakout or if another round of selling pressure will push prices lower.
Key Observations:
1. Downward Channel Still Intact:- The index continues to respect the red trendlines, which have been guiding the downtrend for months.
Nifty 50 is currently testing the upper boundary of the channel, and this is a decisive moment for the market.
2. Resistance Zone Approaching:- 23,100 - 23,200 is acting as an immediate resistance level.
A break and close above this zone with strong volume could confirm a breakout and trigger bullish momentum.
Failure to break out could lead to another rejection, keeping the downtrend intact.
3. Bullish Momentum Strengthening:- The last few daily candles show strong bullish momentum with higher highs and higher lows.
If RSI moves beyond 65-70, it will signal strong buying interest.
Possible Scenarios:
Bullish Breakout Scenario:- If Nifty closes above 23,200 with strong volume, it could rally towards 23,500 - 24,000 in the coming sessions.
A confirmed breakout would invalidate the bearish trend and attract fresh buying interest.
Bearish Rejection Scenario:- If Nifty fails to break out and faces selling pressure, it may once again decline toward 22,750 - 22,500 support levels.
Traders should watch for a bearish rejection candle near the resistance zone, as it could signal another leg downward.
Conclusion:- Nifty 50 is at a make-or-break level, and the next few sessions will decide the trend direction. Traders should wait for confirmation before taking aggressive positions. If a bullish breakout occurs, we could see a trend reversal, but if the resistance holds, the downtrend may continue.
Watch the 23,200 level carefully! A decisive move above or below will dictate the next big move for Nifty 50.

WILL THE BULLISH MOMENTUM CONTINUE TODAY?GOLD REVERSING FROM A STRONG DROP – WILL THE BULLISH MOMENTUM CONTINUE TODAY?
Gold experienced a highly volatile session, retracing to fill the GAP and provide liquidity for the lost price data area before rebounding in line with its primary trend. After a sharp drop, BUY momentum gradually returned, closing the daily candle with strong bullish pressure.
Although the ISM Manufacturing PMI data came out positive, it had little impact on the price as market sentiment is currently focused on the new US tariff policies, which could add further pressure on safe-haven assets.
So, will Gold continue its upward momentum today, or is this just a technical correction before further downside? 📉📈 Let's track the key price levels for a well-planned strategy! 🚀
⚡️ KEY PRICE LEVELS TODAY
📌 Resistance: 2892 - 2906 - 2916 - 2930
📌 Support: 2880 - 2872 - 2858 - 2845 - 2835
💎 TRADE SETUP
🔹 BUY ZONE: 2846 - 2844
🎯 TP: 2850 - 2854 - 2858 - 2864 - 2870
⛔️ SL: 2840
🔹 SELL ZONE: 2915 - 2917
🎯 TP: 2910 - 2905 - 2900 - 2896 - 2892
⛔️ SL: 2921
⏳ With no major news releases today, the expected price range is 30 - 35 prices. Stick to TP/SL to protect your account! 🚀💰

"Bearish or Bullish? NIFTY 50's Next Big Move Explained!📊 Chart Analysis: NIFTY 50
🔥 Key Levels of Interest
👉 Support Zone (23,200–23,500): Strong demand area with historical buying interest.
👉 Resistance Levels:
Immediate: 24,200–24,400 (significant selling pressure).
Major: 25,550 (bullish breakout potential).
📉 Trendline & Moving Averages
👉 Trendline: Downward-sloping, indicating bearish sentiment unless breached.
👉 50-Day SMA: Price below this short-term indicator, signaling weakness.
👉 200-Day SMA: Price below this long-term indicator, confirming bearish momentum.
📊 Candlestick & Volume Analysis
👉 Candlesticks: Long lower wicks suggest buyer interest near support but weak follow-through.
👉 Volume: Low volume indicates consolidation; a breakout or breakdown could increase participation.
📈 Indicators
👉 RSI: Likely near oversold levels, hinting at a potential bounce.
👉 SuperTrend: Currently bearish, reinforcing selling pressure.
📰 Current News Impacting the Market
🌍 US Federal Reserve's Rate Hike Decision:
Recent commentary suggests maintaining elevated interest rates in 2025, causing foreign outflows from emerging markets like India.
🛢 Crude Oil Prices Drop:
Positive for India, reducing inflationary pressures and improving fiscal dynamics.
💹 Strong Q3 Earnings:
Major Indian IT and banking firms reported better-than-expected Q3 earnings, boosting investor confidence in specific sectors.
⚔️ Geopolitical Developments:
Ongoing Middle East conflict has led to increased volatility in global markets, with investors adopting a cautious approach.
📅 Union Budget Expectations:
Speculation around pro-growth measures, including incentives for manufacturing and infrastructure, has sparked optimism.
💰 FII/FDI Inflows:
Renewed interest from foreign institutional investors in technology and energy sectors has provided short-term support.
🦠 Emergence of HMPV Virus Concerns:
Reports about the Human Metapneumovirus (HMPV) spread have created caution in healthcare and pharmaceutical sectors. While not yet causing widespread economic impact, it is being monitored closely for potential disruptions to global supply chains and market sentiment.
📈 Scenarios for Traders
👉 Bullish Scenario (Above 24,400):
Targets: 25,550 and higher with strong volume.
Stop Loss: Below 24,000.
👉 Bearish Scenario (Below 23,200):
Targets: 22,500 and lower.
Stop Loss: Above 23,600.
👉 Neutral Range (23,200–24,400):
Consolidation likely, favoring short-term trades within the range.
📘 NIFTY 50 Overview
💼 About:
India’s benchmark stock market index representing the top 50 NSE-listed companies across 13 sectors.
📊 Historical Growth:
Launched in 1996 with a base value of 1,000.
Reflects India's economic progress through blue-chip companies.
📈 Key Drivers:
Economic Expansion: Supported by GDP growth and reforms (e.g., GST, Make in India).
Foreign Investments: High-growth emerging market status attracts FII/FDI.
Sectoral Growth: IT, banking, and FMCG as major contributors.
🌟 Influencing Factors
📊 Economic: GDP growth, inflation, and interest rates.
🌍 Global Events: Fed policies, geopolitical tensions, and commodity prices.
📅 Domestic: Earnings reports, budget announcements, and rupee movements.
📋 Actionable Strategies
📈 Bullish:
Entry: Above 24,400 with strong volume.
Target: 25,550+.
Stop Loss: Below 24,000.
📉 Bearish:
Entry: Below 23,200 with confirmation.
Target: 22,500 or lower.
Stop Loss: Above 23,600.
📢 Disclaimer:
This analysis is for educational purposes only. Consult a certified financial advisor before investing.
💡 Prepared by: Hiren Soni, a Financial Engineer 🚀

PFC Positional Short trade SetupNegative crossover with volume supported move. Sell Positional ~ 451, With Stop ~ 468, For Target ~ 410. Time Frame - (5 To 8 Day's)

NIFTY PREDICTIONS.... BEARISH OUTLOOK FOR DECEMBER 2024. I'll try explaining my Nifty chart analysis through Elliot waves.
Nifty, again, is likely correcting in a 5-wave pattern. After reaching an ATH of 24274, Nifty's downside waves/correction started towards the end of September.
Wave (1) moved in a 5-wave pattern and ended around 24700, as marked in the chart.
Wave (2) had a zig-zag pattern and ended around 25200.
Wave (3) also had a 5-wave pattern, falling 1.23 times wave 1 to end around 23300 levels.
Wave (4)- Nifty is currently in this wave, which is probably in a zig-zag pattern. Wave (4), as usual, notoriously has violent moves on either side, giving challenges to traders.
Probable levels of termination of wave (4) are 24800 {0.5 of waves (1-3)}and 25150 {0.618 of waves (1-3).
Wave (5) - Assuming wave (4) termination around 25150, we can expect a big correction in Nifty to 22700 levels. This wave (5) alone can cause approximately 10% fall in Nifty.
Remember,
THE MARKET IS ALWAYS RIGHT.
Trade with appropriate stoploss.

Nifty Trading Strategy for 19th December 2024Nifty Trading Strategy
Key Levels:
Buy Above: The high of the 15-minute candle that closes above 24,315
Sell Below: The low of the 15-minute candle that closes below 24,125
Targets:
Upside Targets: 24,444, 24,533
Downside Targets: 24,010, 23,950, 23,850
Strategy Details:
Buy Signal: Enter a buy position above the high of the 15-minute candle that closes above 24,315, aiming for targets of 24,444 and 24,533.
Sell Signal: Enter a sell position below the low of the 15-minute candle that closes below 24,125, aiming for targets of 24,010, 23,950, and 23,850.
Additional Tips:
Monitoring: Continuously monitor the 15-minute chart for clear buy or sell signals.
Risk Management: Always use stop-loss orders to manage risk and protect your capital.
Market Conditions: Stay updated on market news and events that could impact Nifty.
Disclaimer:
I am not SEBI registered. This analysis is for informational and educational purposes only. Please consult with a certified financial advisor before making any trading decisions.

BUY ASHOK LEYLANDBUY ASHOK LEYLAND for target price 253, as it broke the trendline and made double bottom and will break this flag structure to continue till 253.

BUY VEDANTA LTDBUY signal for VEDANTA, as it has broken the trendline also moving average cross cover signaling a strong buy for VEDANTA.

BUY HINDCOPPERBuy hindcopper as it is oversold stock, making inverted head and shoulder also ema crossover giving a strong buy signal.

Idea purely on technical basis + NewsThis idea is purely basis current price action + volume and news. No other factors considered.
NSE:DHANI has shown promising signs of a potential turnaround, indicating a shift in sentiment following a period of indecision or stabilization.
The Diamond Bottom pattern emerges amidst a downtrend, characterized by the formation of higher highs and lower lows within a widening pattern.
Over time, this pattern evolves as the highs reach a peak and the lows begin to ascend, leading to a gradual narrowing of the trading range.
Upon the breakout above the boundaries of the diamond pattern, there's a notable indication of a substantial reversal, marking the onset of a fresh uptrend.
Other things to consider at current situation
- Volume is increasing
- Trading above 10 EMA, 50 EMA and 100 EMA
News
Dated: March 18, 2024
- Submitted the building plans to the Directorate of Town and Country Planning (DTCP) for approvals of 60 lac sq ft of residential development saleable area in Sector 104, Gurugram located on 8 lane Dwarka Express way. The Project is proposed to be launched in July’
- Submitted the building plans for development of saleable area of 2.6 lac sq ft of office space in Worli, Mumbai. The Project is expected to be launched in August’ 2024.
PLEASE NOTE THAT:
This chart analysis is only for reference purpose.
This is not buying or selling recommendations.
I am not SEBI registered.
Please consult your financial advisor before taking any trade

Piramal Enterprises Ltd - Value Investing?Piramal Enterprises Ltd - Analysis
The stock is displaying a promising bullish candlestick pattern , signaling a potential halt to its recent downtrend and a possible upward turn in the short term.
There is price and psi divergence seen on daily chart, which is positive indication.
Moreover, the stock seems to present an appealing value investment opportunity based on two crucial valuation metrics:
Price/Book Ratio of 0.69 : This indicates that the stock price is relatively low compared to the company's book value, reflecting a potentially undervalued asset.
Price/Cash Flow Ratio of 14.12 : This ratio suggests that the share price is reasonably low when weighed against the company's generated cash flow, indicating a potentially favorable investment in terms of cash flow generation.
Additionally, the Earnings Yield of 18% signifies the return the company generates on each invested dollar, indicating a relatively robust performance in generating earnings.
PLEASE NOTE THAT:
This chart analysis is only for reference purpose.
This is not buying or selling recommendations.
I am not SEBI registered.
Please consult your financial advisor before taking any trade

CCL Products (India) Ltd Looks Good!Script - NSE:CCL
Pattern: Symmetrical Continuation Triangle
The recent price movement indicates a breakout from a consolidation phase, signaling a probable continuation of the previous uptrend.
In a Bullish Symmetrical Continuation Triangle, there are two trendlines converging as prices form lower highs and higher lows. During this consolidation, trading volume typically decreases as the price fluctuates within a tightening range, reflecting uncertainty among market participants.
However, prior to the triangle's apex, there's a significant breakout above the upper trendline accompanied by a notable surge in trading volume. This breakout confirms the pattern as a continuation of the uptrend observed before the consolidation phase.
PLEASE NOTE THAT:
This chart analysis is only for reference purpose.
This is not buying or selling recommendations.
I am not SEBI registered.
Please consult your financial advisor before taking any trade

AGI Greenpac Ltd. - Looks Good!NSE:AGI
This stock has formed a pattern called Double Bottom.
A "double bottom" is a chart pattern used in technical analysis to predict a potential reversal of a downtrend. It typically occurs after a prolonged decrease in price and consists of two distinct lows at approximately the same level, separated by a moderate peak.
target price for the intermediate-term in the range of 955.00 to 965.00.
Also The MACD has also generated a bullish signal.
RSI above 60.
PLEASE NOTE THAT:
This chart analysis is only for reference purpose.
This is not buying or selling recommendations.
I am not SEBI registered.
Please consult your financial advisor before taking any trade

#RELIANCE: Big Investment Opportunity In Making±Dear Traders,
We are seeing some major correction on Reliance since last few weeks, in our technical view price is yet to drop further towards our designated buying zone. Expect a swift buy from our identified key level, even possible to see a continuous bull run taking price above 3500 region. If you agree to our view please like and comment for more.

NIFTY... 26000 TARGET IN 2024!Guys... I am sharing my analysis of Nifty over a longer time frame.
The Elliot waves are marked on the chart. Nifty is currently in the wave 3 of the primary cycle.
This primary cycle runs in smaller intermediate waves.
Wave 1 started on April 2023;
Wave 3 from November 2023;
Expecting wave 4 to end by April 2024, and we can expect wave 5 to begin from May 2024.
So, as per this analysis, we can see a red candle in April month - the wave 4 correction, which is likely to end around 21400 - 21500 levels.
Wave 5, which is likely to begin in May, is likely to last till December 2024, taking nifty to 26000 levels (approximately 26400).
In this, wave 3 is 1.23 times wave 1, and wave 5 is 1.618 times wave 1.
Hopefully we get to witness a 20 - 25% rally in Nifty this year :)
This is only my analysis & remember the market is always RIGHT!

Big Breakout Alert! Negative Momentum in GODREJPROP & ESCORTSGODREJPROP
The stock's price has been following an upward trend within a parallel channel.
Recently, the stock broke through the lower boundary of the channel with a powerful bearish candle.
With pessimistic market sentiment, it is anticipated that the stock price will continue to correct, presenting a chance to take a short position.
ESCORTS
Following the emergence of the bullish Pole & Flag pattern, the stock experienced a significant upward surge backed by robust momentum.
After reaching an all-time high close to the 4,400 level, the stock retraced and eventually formed a Double Top pattern signaling a potential bearish trend.
A recent breach of the pattern's neckline to the downside suggests further downside potential for the stock.

DIVISLAB and CHAMBLFERT showing high rise in Future OIDIVISLAB
The price has been stuck in a tight range for over a year.
Then it broke through its resistance level.
Since then, the price has stayed above that point and is rising steadily.
A breakout has occurred, and the stock price continues to climb
CHAMBLFERT
The stock price was gradually rising within a parallel channel.
After breaking out of the channel, there was a significant price surge followed by a period of consolidation.
Now, the price is attempting to surpass its resistance and continue moving upwards.

ICICIPRULI & DEEPAKNTR - Breakthrough of the Rounding Bottom ICICI PRUDENTIAL
The stock experienced an upward trend, forming an Ascending Broadening Wedge pattern that suggested a bearish outlook.
Following a breakdown, the stock price fell sharply and entered a consolidation phase.
During this period, the stock exhibited progressively smaller price fluctuations, establishing a series of consolidation bases, each one tighter than the last, formation of a Volatility Contraction Pattern.
After breaking through this phase, the price reached an all-time high and is now set to climb even further.
DEEPAK NITRITE
During the upward trend, the stock price established a Pole & Flag pattern, signaling a continuation of the trend.
However, following the breakout, the price underwent a significant consolidation phase, resulting in the formation of a Rounding Bottom pattern.
Recently, a breakout has taken place, indicating that the price is poised for an upward movement.
