Understanding the Changing Dynamics of the World EconomyGlobal Market Shift:
The global market is undergoing a profound shift, driven by a combination of economic, political, technological, and social forces. What once appeared to be a relatively stable, globalization-driven economic order has now evolved into a more fragmented, uncertain, and dynamic system. This global market shift is redefining how countries trade, how businesses operate, how capital flows, and how investors allocate resources. Understanding these changes is essential for policymakers, corporations, and individuals seeking to navigate the future economic landscape.
From Globalization to Strategic Realignment
For decades, globalization was the dominant theme shaping global markets. Free trade agreements, integrated supply chains, and cross-border capital flows allowed companies to optimize costs and expand markets. However, recent years have seen a clear shift away from unfettered globalization toward strategic realignment. Trade tensions, geopolitical conflicts, and national security concerns have pushed countries to prioritize self-reliance, resilience, and regional partnerships over pure efficiency.
This transition is evident in the restructuring of supply chains. Companies are moving away from single-country dependence and adopting strategies such as “China plus one,” nearshoring, and friend-shoring. The goal is not only cost reduction but also risk management, ensuring continuity during disruptions such as pandemics, wars, or trade sanctions. As a result, global trade patterns are becoming more regionalized, altering the balance of economic power.
Shifting Economic Power Centers
Another critical aspect of the global market shift is the gradual movement of economic influence from developed economies to emerging markets. While the United States and Europe remain central players, countries in Asia, the Middle East, and parts of Latin America are gaining prominence. China, India, Southeast Asian nations, and Gulf economies are increasingly shaping global demand, investment flows, and innovation trends.
This shift is supported by demographic advantages, growing middle-class populations, and rising domestic consumption in emerging markets. At the same time, developed economies face challenges such as aging populations, slower growth, and high debt levels. As global growth increasingly depends on emerging economies, international institutions, investors, and corporations are recalibrating their strategies to align with this new reality.
Monetary Policy and Capital Flow Rebalancing
Global monetary conditions have played a major role in driving market shifts. After years of ultra-loose monetary policy following the global financial crisis, central banks worldwide entered a tightening phase to combat high inflation. Rising interest rates in developed markets, particularly the United States, have reshaped global capital flows.
Higher yields in advanced economies attract capital away from riskier assets and emerging markets, leading to currency volatility and financial stress in some regions. At the same time, countries with strong fundamentals and credible policy frameworks are better positioned to withstand these pressures. This environment has made investors more selective, focusing on quality, stability, and long-term growth rather than chasing yield alone.
Technological Transformation and Digital Markets
Technology is one of the most powerful forces behind the global market shift. Advances in artificial intelligence, automation, cloud computing, and digital platforms are transforming industries at an unprecedented pace. Traditional business models are being disrupted, while new digital ecosystems are emerging across sectors such as finance, healthcare, retail, and manufacturing.
Digitalization has also changed the nature of global competition. Companies no longer need a physical presence in every market to reach customers, while data and intellectual property have become critical assets. At the same time, governments are increasingly regulating technology, data flows, and digital currencies, adding a new layer of complexity to global markets. The race for technological leadership is now closely linked to economic and geopolitical power.
Geopolitics and Market Fragmentation
Geopolitical developments are another major driver of global market shifts. Conflicts, sanctions, trade wars, and diplomatic tensions have direct and indirect effects on markets. Energy prices, commodity supply chains, defense spending, and currency movements are all influenced by geopolitical risks.
The result is a more fragmented global economy, where political alignment often determines economic partnerships. This fragmentation challenges the idea of a single, unified global market and increases uncertainty for businesses and investors. Risk management, diversification, and geopolitical awareness have become essential components of decision-making in this new environment.
Sustainability and the ESG Transition
Sustainability has moved from the margins to the mainstream of global markets. Climate change, environmental risks, and social responsibility are now central considerations for governments, corporations, and investors. The transition toward renewable energy, electric mobility, and sustainable infrastructure is reshaping entire industries.
Capital is increasingly flowing toward companies and countries that align with environmental, social, and governance (ESG) principles. At the same time, traditional sectors such as fossil fuels are facing structural challenges, even as they remain critical to short-term energy security. This dual reality creates both opportunities and risks, making sustainability a key factor in the global market shift.
Impact on Businesses and Investors
For businesses, the global market shift demands greater agility and strategic foresight. Companies must balance efficiency with resilience, global reach with local adaptation, and innovation with regulatory compliance. Those that can anticipate change and invest in technology, talent, and sustainable practices are more likely to thrive.
Investors, meanwhile, must adapt to a world of higher volatility and complexity. Diversification across geographies, asset classes, and themes has become more important than ever. Long-term trends such as digitalization, emerging market growth, and sustainability offer significant opportunities, but they require patience and informed decision-making.
Conclusion: Navigating a New Global Order
The global market shift represents a transition from a relatively predictable, globalization-driven system to a more complex, multipolar, and dynamic economic order. While this shift brings uncertainty and challenges, it also creates opportunities for innovation, growth, and transformation. Understanding the underlying drivers—geopolitics, technology, monetary policy, sustainability, and demographic change—is crucial for navigating this evolving landscape.
In the years ahead, success in global markets will depend not on resisting change but on embracing it with clarity, adaptability, and a long-term perspective. The global market shift is not a temporary phase; it is a defining feature of the modern world economy, shaping the future of trade, investment, and prosperity.
Indicators

Gold direction today November 17📊 Support – Resistance – Fibonacci Analysis
1. Trend Overview
Price has broken below the ascending channel, signaling a shift into a corrective downtrend phase.
2. Key Resistance Zone
4,215 – 4,230
Confluence of Fibonacci retracement 0.5 – 0.618
Overlaps with a supply zone + EMA89
→ Strong resistance, high probability of selling pressure.
This is also the expected pullback/retest area before the next bearish leg.
3. Key Support Levels
Support 1 – 4,000
Fibonacci extension 0.5
Horizontal support
→ Likely to generate a short-term reaction.
Support 2 – 3,890
Major downside target if the structure fully breaks
→ Primary bearish target for a deeper continuation.
4. Price Scenario
Price may pull back toward 4,215 – 4,230.
BUY GOLD : 4000 - 3997
Stoploss : 3987
Take Profit : 100-300-500pips
SELL GOLD : 4212 - 4215
Stoploss : 4225
Take Profit : 100-300-500pips

How will the golden new week be from 10-14/11?📉 H4 Analysis (Trendline, Support & Resistance)
Structure:
The price is currently moving within an upward channel.
Trendline:
Upper red trendline: Acting as dynamic resistance.
Lower red trendline: Current support, from where the price has bounced several times.
🧭 Fibonacci Levels:
0.5 = 4,130
0.618 = 4,188
→ This zone (4,180 – 4,200) is the key resistance zone.
💎 Key Levels:
Resistance: 4,180 – 4,200
(Fibo 0.618 + Previous Swing High)
Support: 3,890 – 3,920
(Previous Base + Bottom of Channel)
⚔️ Possible Scenarios:
If the price stays above 4,000 → Bullish move may continue, target 4,180–4,200.
If the price falls below 3,970 → Bearish breakdown, target 3,890 support zone.
📊 In Summary:
🔺 Resistance: 4,180 – 4,200
🔻 Support: 3,920 – 3,890
⚡ Trend: Mildly bullish, but strong resistance exists at 4,200.
SELL GOLD: 4195 – 4200
Stoploss: 4210
Take profit: 100-300-500pips
BUY GOLD: 3885 – 3890
Stoploss: 3970
Take profit: 100-300-500pips

EMA vs SMA vs WMA: Which Moving Average Should You Use?🔎 Intro / Overview
Moving Averages remain one of the most trusted tools in technical analysis. They smooth price action, highlight the trend, and often act as dynamic support or resistance.
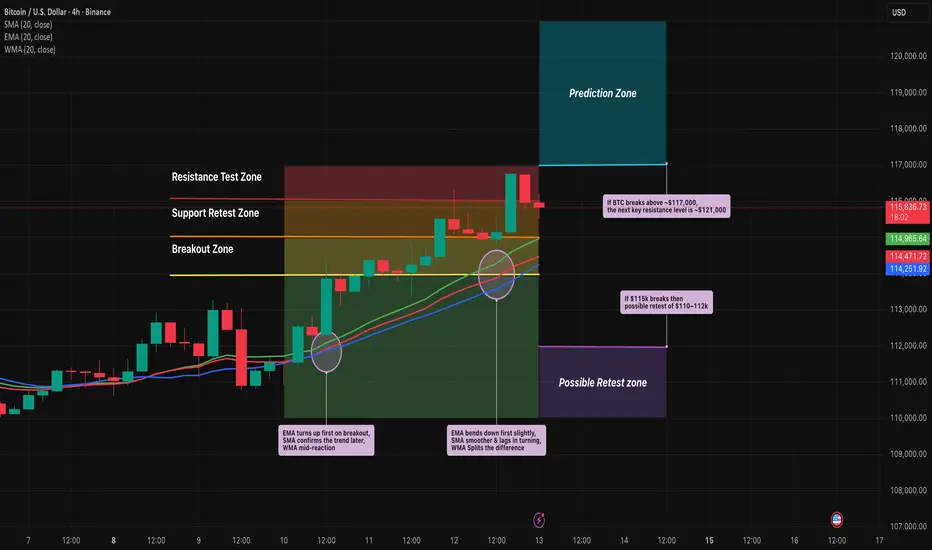
In this post, we compare the 20-period SMA, EMA, and WMA on BTCUSD 4H to show how each reacts differently to market moves.
___________________________________________________________
📔 Concept
SMA (Simple Moving Average): Every candle in the lookback is weighted equally → smooth but slower to react.
EMA (Exponential Moving Average): Recent candles carry more weight → reacts faster, hugs price closely.
WMA (Weighted Moving Average): Linear weighting → a balance between SMA’s stability and EMA’s sensitivity.
The difference lies in responsiveness. Faster averages react early but risk false signals, slower averages confirm trends but lag.
___________________________________________________________
📌 How to Use
1️⃣ Plot the 20-period SMA, EMA, and WMA together.
2️⃣ Watch how each responds during pullbacks, rallies, and consolidations.
3️⃣ Use EMA for quicker signals, SMA for smoother long-term view, and WMA if you prefer a middle ground.
4️⃣ Combine with price action or RSI to avoid relying on moving averages alone.
___________________________________________________________
🎯 Trading Plan
Intraday traders: EMA crossovers (e.g., 9 vs 21 EMA) for faster entries and exits.
Swing traders: SMA for identifying trend direction and major support/resistance.
Balanced traders: WMA for medium-term setups where stability and responsiveness matter equally.
Always align the moving average with your trading style and risk appetite.
___________________________________________________________
📊 Chart Explanation
On BTCUSD 4H:
EMA (red) bent upward first during the $114k breakout, SMA (blue) confirmed later, and WMA (green) sat between them.
At the $115k retest, EMA dipped first, while SMA lagged.
At $116.5–117k resistance, EMA whipsawed but SMA stayed smoother.
Notice how these differences become clear during sharp pullbacks, quick rallies, and sideways ranges.
___________________________________________________________
👀 Observation
EMA is quick but noisy ⚡, SMA is calm but late 🕰️, WMA strikes a middle ground ⚖️.
___________________________________________________________
❗ Why It Matters?
Choosing the right moving average impacts how quickly you spot entries, confirm trends, and manage stop-losses. Understanding the differences helps traders adapt strategies to both trending and sideways markets.
___________________________________________________________
🎯 Conclusion
No single moving average is “best.” Each serves a purpose depending on the timeframe and style of trading. The key is consistency — choose one that aligns with your plan, test it, and apply it with discipline.
👉 Which one do you prefer in your trading — EMA, SMA, or WMA?
___________________________________________________________
⚠️ Disclaimer
📘 For educational purposes only ·
🙅 Not SEBI registered ·
❌ Not a buy/sell recommendation ·
🧠 Purely a learning resource ·
📊 Not Financial Advice
Impact of Rupee-Dollar Exchange Rate on Indian StocksIntroduction
The stock market is a complex system where numerous factors—both domestic and global—interact to determine price movements. One such crucial factor is the exchange rate between the Indian Rupee (INR) and the US Dollar (USD). The Rupee-Dollar exchange rate plays a vital role because the US Dollar is the world’s reserve currency, the primary medium of global trade, and a benchmark for financial transactions worldwide.
In India, the economy is deeply interconnected with global trade, capital flows, and financial markets. Any change in the value of the Rupee against the Dollar has wide-ranging implications on businesses, investors, and the stock market. Companies that import raw materials or export finished goods, sectors like Information Technology (IT), Pharmaceuticals, Oil & Gas, Banking, Aviation, and even Foreign Institutional Investors (FIIs), are directly influenced by these fluctuations.
This essay explores in detail how the Rupee-Dollar exchange rate impacts Indian stocks, covering the theoretical background, sectoral influences, investor behavior, macroeconomic effects, and real-world case studies.
Understanding the Rupee-Dollar Exchange Rate
The exchange rate refers to how much one unit of a currency is worth in terms of another. In India, the exchange rate most closely tracked by investors is INR/USD—the number of Rupees required to buy one US Dollar.
If 1 USD = ₹80, it means that importing something worth $1 will cost ₹80 in India.
If the Rupee depreciates (falls in value), say 1 USD = ₹85, imports become more expensive, but exporters receive more Rupees for the same Dollar earnings.
If the Rupee appreciates (gains in value), say 1 USD = ₹75, imports become cheaper, but exporters earn fewer Rupees per Dollar.
This constant push-and-pull directly influences corporate profitability and, in turn, the stock market.
Why Does the Rupee Move Against the Dollar?
The exchange rate fluctuates due to a combination of domestic and global factors:
Demand & Supply of Dollars – If India imports more than it exports, demand for Dollars rises, weakening the Rupee.
Foreign Institutional Investment (FII) Flows – When FIIs invest in Indian equities, they bring in Dollars, strengthening the Rupee. Conversely, when they pull out, the Rupee weakens.
Interest Rate Differentials – Higher interest rates in the US attract global investors, increasing demand for Dollars.
Crude Oil Prices – India is heavily dependent on crude imports. Rising oil prices increase Dollar demand, weakening the Rupee.
Geopolitical Events – Wars, sanctions, and global economic slowdowns push investors toward the Dollar as a "safe haven."
Inflation & Growth Rates – Higher inflation in India compared to the US reduces the Rupee’s purchasing power.
These factors cause daily volatility in the Rupee-Dollar exchange rate, impacting stock prices.
The Link Between Exchange Rate and Stock Market
The Rupee-Dollar relationship influences stocks in three broad ways:
Corporate Earnings Impact – Companies that earn or spend in Dollars see changes in profitability.
Foreign Investor Behavior – FIIs track currency stability before investing in emerging markets like India.
Macroeconomic Sentiment – A stable Rupee improves confidence, while sharp depreciation raises concerns about inflation, current account deficit, and fiscal health.
Sector-Wise Impact of Rupee-Dollar Exchange Rate
1. Information Technology (IT) Sector
Indian IT companies like TCS, Infosys, Wipro, and HCL earn the majority of their revenue in Dollars by exporting software services to the US and Europe.
A weak Rupee is positive for IT stocks since they earn more Rupees for the same Dollar revenue.
Example: If Infosys earns $1 billion, at ₹80/USD revenue = ₹80,000 crore. If Rupee falls to ₹85/USD, revenue = ₹85,000 crore (without increasing actual Dollar earnings).
Impact: Rupee depreciation → IT stocks rally. Rupee appreciation → IT stocks face margin pressure.
2. Pharmaceutical Sector
Similar to IT, Pharma companies like Sun Pharma, Dr. Reddy’s, and Cipla export a large share of medicines to the US.
A weak Rupee boosts export revenues, but import costs (like Active Pharmaceutical Ingredients from China) may rise.
Impact: Net positive for export-oriented pharma firms, but mixed for those heavily dependent on imports.
3. Oil & Gas Sector
India imports over 80% of its crude oil needs, priced in Dollars.
A weak Rupee makes oil imports costlier, increasing input costs for companies like IOC, BPCL, HPCL.
This also impacts sectors like aviation, paints, fertilizers, and chemicals, which rely on crude derivatives.
Impact: Rupee depreciation hurts oil & gas and related sectors.
4. Aviation Industry
Airlines like IndiGo, SpiceJet, and Air India earn revenue in Rupees but pay for aircraft leases, maintenance, and fuel in Dollars.
A weak Rupee increases costs significantly, leading to lower margins.
Impact: Rupee depreciation is negative for aviation stocks.
5. Banking & Financial Services
Banks with significant foreign borrowings may face higher repayment costs when the Rupee falls.
However, if they hold Dollar assets, they benefit.
Investor sentiment in the financial sector often mirrors overall macroeconomic stability tied to currency movements.
6. Import-Oriented Companies
Sectors like electronics, automobiles, FMCG (raw materials), and chemicals rely on imports.
A weaker Rupee raises raw material costs, compressing margins unless passed on to consumers.
7. Export-Oriented Manufacturing
Sectors like textiles, gems & jewelry, and leather benefit from a weaker Rupee as global buyers pay in Dollars.
However, if raw materials are imported, the benefits get diluted.
Impact on Foreign Investors
Foreign Institutional Investors (FIIs) are among the biggest drivers of the Indian stock market.
Stable Rupee: Encourages FIIs to invest since currency risk is lower.
Weakening Rupee: Even if stock returns are strong, FIIs may lose money when converting Rupees back to Dollars.
Example: If Nifty rises 10% but the Rupee falls 8% against the Dollar, FIIs net only ~2% returns.
Sudden depreciation often triggers FII outflows, leading to stock market corrections.
Thus, exchange rate stability is as important as stock fundamentals in attracting foreign capital.
Macroeconomic Effects on Stock Market
Inflation: A weak Rupee increases import costs (oil, electronics, machinery), leading to inflation. High inflation reduces corporate margins and consumer demand, pressuring stocks.
Current Account Deficit (CAD): Higher import bills widen CAD, weakening investor confidence.
Government Fiscal Position: Subsidy burdens (fertilizers, fuel) rise with Dollar appreciation, impacting fiscal deficit and bond yields, indirectly affecting equities.
Monetary Policy: RBI may raise interest rates to defend the Rupee, impacting borrowing costs and stock valuations.
The Way Forward
India’s growing integration into the global economy ensures that the Rupee-Dollar dynamic will continue to influence stocks. Key trends to watch:
US Federal Reserve policies – Dollar movements globally.
Energy Transition – Reducing oil imports will lower currency vulnerability.
Boosting Exports – Government initiatives like PLI schemes strengthen export-led sectors.
RBI Interventions – Maintaining stability via forex reserves.
Conclusion
The Rupee-Dollar exchange rate is more than just a number—it’s a reflection of India’s economic health, trade balance, and global investor confidence. Its impact on the stock market is far-reaching:
Exporters like IT and Pharma gain from Rupee weakness.
Import-heavy sectors like oil, aviation, and FMCG suffer.
Investors—both domestic and foreign—adjust portfolios based on currency trends.
Macroeconomic stability is closely linked to exchange rate dynamics.
For stock market participants, understanding this relationship provides an edge in making informed investment decisions. In the long run, India’s structural reforms, increasing exports, and growing financial depth may reduce vulnerability to Rupee-Dollar volatility. Until then, every swing in the currency will continue to ripple across Dalal Street.

Opportunities in PSU Stocks1. Historical Context of PSU Stocks in India
PSUs were originally created with the objective of building India’s industrial and economic base after independence. Since the private sector lacked resources and experience in heavy industries, the government stepped in to build enterprises in key sectors:
Oil & Gas: ONGC, IOC, HPCL, BPCL
Banking & Finance: SBI, PNB, BoB, LIC
Power & Energy: NTPC, NHPC, Power Grid, SJVN
Metals & Mining: Coal India, NMDC, Hindustan Copper
Engineering & Infrastructure: BHEL, NBCC, IRCON, RITES
Defense: HAL, BEL, BDL, Mazagon Dock
Initially, PSUs were seen as the backbone of the economy. Over time, inefficiencies, overstaffing, and political interference reduced their competitive edge. Private sector companies began to outperform them. This led to a long period where PSU stocks underperformed compared to private companies.
However, recent changes in government strategy, digital reforms, capital market participation, and global commodity cycles have shifted the outlook.
2. Why PSU Stocks are Back in Focus
Several factors have brought PSU stocks back into investor interest:
(a) Attractive Valuations
For many years, PSU stocks traded at low price-to-earnings (P/E) multiples compared to private peers. This made them undervalued despite strong fundamentals. Recent re-rating has unlocked opportunities.
(b) High Dividend Yields
PSUs are known for distributing high dividends, as the government is the largest shareholder and depends on dividend income. Some PSU stocks give 4%–10% annual dividend yield, making them attractive for long-term investors.
(c) Government Reforms & Disinvestment
The government has actively promoted disinvestment and privatization (e.g., Air India’s sale, BPCL privatization plans). This increases efficiency, improves market perception, and boosts stock prices.
(d) Revival in Core Sectors
Energy demand, infrastructure growth, and defense modernization are boosting PSU earnings. For example, Power Grid benefits from rising electricity demand, while HAL and BEL gain from India’s defense indigenization push.
(e) Improved Corporate Governance
Many PSUs have adopted better transparency, digital systems, and profit-focused strategies, reducing inefficiency and improving investor confidence.
3. Opportunities Across Different PSU Sectors
3.1. Banking & Financial PSUs
Key Players: SBI, PNB, BoB, Canara Bank, LIC, GIC, REC, PFC
Opportunity:
Public sector banks have cleaned up their balance sheets after years of bad loans (NPAs).
Credit growth is rising as the Indian economy expands.
SBI, the country’s largest bank, has become a strong wealth creator.
LIC, the insurance giant, is expanding beyond traditional markets and can benefit from India’s growing insurance penetration.
NBFCs like REC and PFC benefit from power sector financing demand.
Why Attractive: PSU banks trade at lower valuations than private banks but are witnessing strong earnings growth.
3.2. Oil & Gas PSUs
Key Players: ONGC, IOC, BPCL, HPCL, GAIL, Oil India
Opportunity:
India is heavily dependent on oil & gas imports, making PSUs critical players.
Rising energy demand ensures long-term growth.
GAIL’s gas distribution and pipeline network is expanding with the government’s push for a gas-based economy.
Strategic privatization of BPCL can unlock massive value.
Why Attractive: High dividend yields, global energy price cycles, and government support.
3.3. Power & Energy PSUs
Key Players: NTPC, NHPC, Power Grid, SJVN, Coal India
Opportunity:
India’s power demand is growing rapidly due to urbanization and industrialization.
NTPC is expanding into renewable energy.
Power Grid is a monopoly in transmission with stable cash flows.
Coal India benefits from being the largest coal producer in the world.
Why Attractive: Stable earnings, strong dividend payouts, and long-term demand visibility.
3.4. Defense PSUs
Key Players: HAL, BEL, BDL, Mazagon Dock, GRSE, Cochin Shipyard
Opportunity:
India is pushing for defense indigenization under the Atmanirbhar Bharat initiative.
Defense budget allocation is rising each year.
Export opportunities for Indian defense equipment are growing.
HAL and BEL are showing strong order books with multi-year growth visibility.
Why Attractive: Strategic importance, government support, and long-term contracts.
3.5. Infrastructure & Engineering PSUs
Key Players: BHEL, NBCC, IRCON, RITES, Engineers India
Opportunity:
India’s infrastructure push (roads, railways, housing, smart cities) benefits these companies.
IRCON and RITES are beneficiaries of railway modernization and export of rail technology.
NBCC plays a crucial role in government construction projects.
Why Attractive: Government-backed contracts, order book strength, and growth in infrastructure spending.
3.6. Metals & Mining PSUs
Key Players: NMDC, Hindustan Copper, MOIL, NALCO
Opportunity:
Commodity supercycles and rising demand for minerals (iron ore, copper, manganese, aluminum) benefit these PSUs.
NMDC is a low-cost iron ore producer, while NALCO is expanding aluminum production.
Electric vehicle (EV) growth increases demand for copper and aluminum.
Why Attractive: Global commodity upcycle, cost advantage, and strong government backing.
4. Key Strengths of PSU Stocks
Stable Business Models – Many PSUs enjoy monopolies or dominant positions in their industries.
Dividend Income – Attractive for long-term investors seeking passive income.
Government Support – Financial backing, bailout potential, and favorable policies.
Strategic Importance – PSUs play critical roles in defense, energy, and infrastructure.
Value Unlocking via Privatization – Upcoming privatizations can lead to stock re-rating.
5. Risks in PSU Stocks
While opportunities are strong, investors must be aware of risks:
Government Intervention – Policy decisions can affect profitability (e.g., fuel price controls for OMCs).
Competition from Private Sector – Private banks, energy companies, and defense startups pose challenges.
Global Commodity Price Volatility – Affects PSU metal, mining, and oil companies.
Disinvestment Delays – Political opposition or market conditions can slow privatization.
Efficiency Concerns – Despite improvements, some PSUs still face bureaucratic inefficiencies.
6. Investment Strategies in PSU Stocks
Dividend Investing – Focus on high-yield PSU stocks like Coal India, NTPC, Power Grid.
Value Investing – Buy undervalued PSUs trading at low P/E or P/B ratios.
Thematic Investing – Play sectors like defense indigenization (HAL, BEL) or renewable energy (NTPC, SJVN).
Disinvestment Opportunities – Monitor privatization candidates for potential re-rating.
Balanced Portfolio – Mix of stable dividend PSUs and growth-oriented defense/infra PSUs.
7. Outlook for PSU Stocks in India
The next decade could be transformational for PSU companies. Key trends driving growth:
India’s $5 trillion economy target will need massive energy, infrastructure, and defense spending.
Privatization push will unlock value and reduce inefficiencies.
Renewable energy expansion will benefit NTPC, NHPC, and SJVN.
Defense exports will grow as India becomes a global supplier.
Digitalization in PSU banks will improve competitiveness.
Foreign institutional investors (FIIs) and domestic investors are increasingly allocating capital to PSU stocks, indicating confidence in their long-term prospects.
Conclusion
PSU stocks in India are no longer “sleeping giants.” They have evolved into strong wealth-creating opportunities, backed by government reforms, improved efficiency, sectoral growth, and undervaluation compared to private peers.
Opportunities exist across multiple sectors: banking, energy, defense, infrastructure, and commodities. While risks remain in terms of government interference and competition, the overall outlook is positive.
For long-term investors, PSU stocks offer a unique combination of dividend income, stability, and growth potential. With India’s economic rise, PSU stocks can play a central role in wealth creation for investors who are willing to stay patient and selective.

EUR/USD Short Setup: Resistance Rejection at 1.1710Pair: EUR/USD
Timeframe: 15-min
Current Price: ~1.1703
Setup Shown: A short trade (sell position) with:
Entry: ~1.1709
Stop Loss (SL): 1.1729
Take Profit (TP): 1.1631
Risk/Reward Ratio: About 1:4 (20 pips risk, ~80 pips potential reward)
Technical Observations:
Recent Trend:
Price rallied from ~1.1630 up to ~1.1710.
After reaching resistance, it’s stalling around 1.1710.
Resistance Zone:
Around 1.1710–1.1730, multiple rejections are visible.
That makes this area a good short-entry zone.
Support Zone:
Next strong support lies near 1.1630–1.1640, which is the TP level.
If broken, EUR/USD could continue lower.
Volume:
Volume spikes during the previous drop, showing strong selling interest.
Market Structure:
Lower highs and lower lows are visible before the rally.
This move could just be a retracement in a broader downtrend.
Trade Idea (from chart):
Bias: Bearish
Reasoning:
Price rejected resistance at 1.1710–1.1730.
Risk is small compared to the potential downside (good R:R).
Confirmation Needed:
Watch for bearish candlestick patterns (e.g., engulfing, pin bar) at current levels.
Check for USD strength in macro data/events.
✅ If confirmed, the short makes sense:
Sell near: 1.1709
Stop loss: 1.1729
Take profit: 1.1631

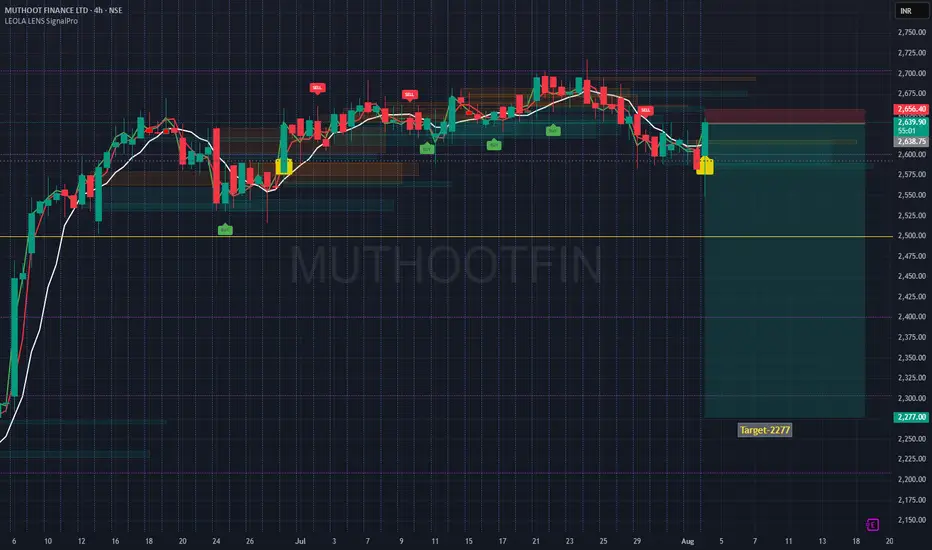
MUTHOOTFIN Structure Breakdown- 2277- Step Towards a Fall 🔍 Technical Structure Breakdown:
🟡 Caution label printed after extended distribution — often a signal for upcoming directional shift.
🔴 Price rejected strongly from the upper red supply zone near ₹2,656, confirming resistance from prior SELL cluster.
⚪ Structure broke below a multi-session accumulation zone, flipping the bias to bearish.
🟢 Current rebound is testing the underside of broken structure — often a key area for rejection or continuation.
📉 Target: ₹2,277, aligning with a major historical reaction zone and potential liquidity pocket.
This setup reflects a classic breakdown-retest structure where price may revisit lower order blocks if it fails to reclaim the broken support zone.
⚠️ Disclaimer:
This post is intended solely for educational purposes and does not constitute financial advice. Please do your own research and consult a licensed financial advisor before making any investment or trading decisions.
Mastering Multi Time Frame Analysis | Swing and Intraday TradingWhether you're a price action trader or rely on indicators, mastering Multi Time Frame (MTF) Analysis can transform your swing and intraday trading decisions. In this video, I break down how to use MTF effectively to align your entries, spot fakeouts, and trade with higher conviction.

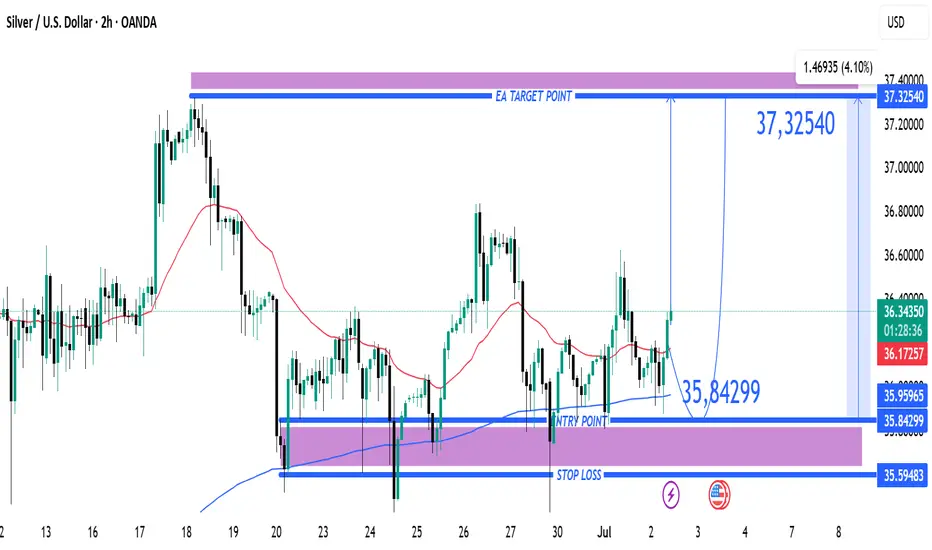
Silver (XAG/USD) Bullish Trade Setup from Key Support Zone XAG/USD (Silver) Trade Analysis – 2H Chart (July 2, 2025)
🔹 Trade Setup Overview:
Entry Point: 35.84299
Target (TP): 37.32540
Stop Loss (SL): 35.59483
Current Price: 36.36350
Risk/Reward Ratio: ~5.9:1 (Very favorable)
🔹 Technical Insights:
Support Zone:
Price recently tested and respected a strong demand zone between 35.60 – 35.84, which has now acted as a bounce level.
Multiple wicks and rejections at this zone highlight buyer interest.
Moving Averages:
50 EMA (red) is starting to flatten, possibly hinting at momentum reversal.
200 EMA (blue) held as dynamic support during the last dip — a bullish signal.
Breakout Potential:
Price has bounced off the entry zone and is approaching minor resistance near 36.40–36.60.
A clean break above this area can trigger momentum toward the 37.30s.
Volume & Momentum:
The latest candle shows strong bullish momentum, validating the bounce setup.
No sign of exhaustion yet.
🔹 Strategy Suggestion:
Entry has already occurred or is slightly above entry zone — ideal for aggressive traders to ride the momentum.
Conservative traders may wait for a pullback near 36.00–36.10 before entering.
SL is well-placed below previous lows and structure — reasonable protection.
🔹 Conclusion:
This setup reflects a bullish continuation trade from a strong support zone. Given the risk/reward profile and recent bullish action, this trade is technically sound as long as price stays above 35.84. A close below this level could invalidate the setup
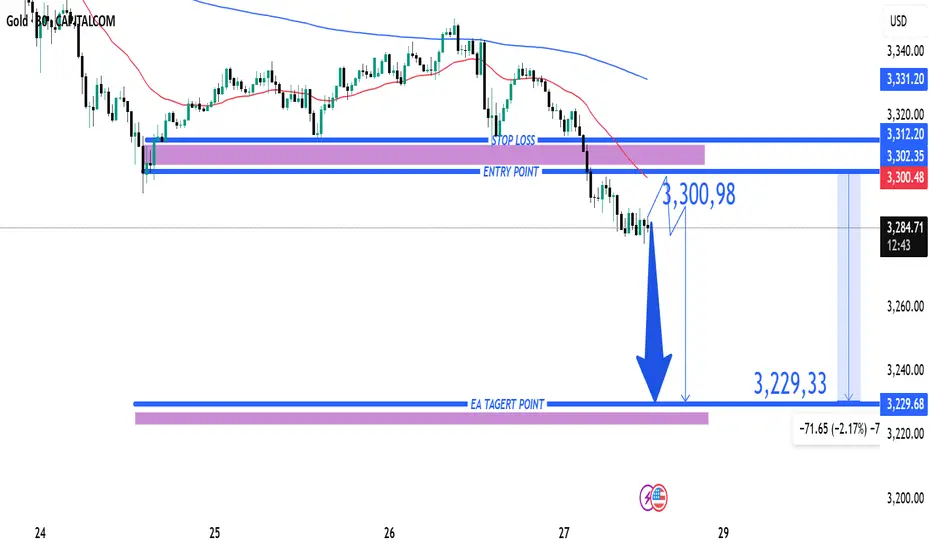
Gold (XAU/USD) Bearish Trade Setup – June 27, 2025Entry Point: Around 3,300.98 USD
Stop Loss (SL): ~3,312.20 USD
Take Profit (TP): 3,229.33 USD
Current Price: 3,286.15 USD
Risk-Reward Ratio: ~1:6.3
(Potential reward ≈ 71.65 pts; risk ≈ 11.22 pts)
Technical Breakdown:
Trend:
The price is in a short-term downtrend, supported by:
Lower highs and lower lows.
Price trading below both 50 EMA (red) and 200 EMA (blue), confirming bearish momentum.
Bearish Breakout:
Price broke below a key support-turned-resistance zone near 3,300–3,302, triggering sell pressure.
Resistance Area:
Strong rejection at 3,302–3,312 zone, which is now acting as resistance.
SL is placed just above this zone to protect against false breakouts.
Target Zone:
TP set at 3,229.33, aligning with a previous support zone — a logical area for price to react.
Strategy Notes:
Bias: Bearish
Entry confirmation: Already triggered.
Risk Management: SL placement is tight and strategic; RR ratio is highly favorable.
Next support below TP: If 3,229 breaks, further downside could follow.
Summary:
This setup shows a well-defined bearish continuation with a clean break of support, a controlled SL above resistance, and a strong RR ratio. A suitable trade for trend-following strategies, but price must not retrace above 3,312 for this idea to remain valid.
USD/JPY Bullish Reversal Trade Setup – Key Support Test at 145.2Entry Point: 145.273 (highlighted in blue)
Stop Loss: ~144.817–145.260 (purple zone)
Target Point (TP): 148.133 (upper resistance zone)
📉 Recent Price Action:
Price peaked near 148.05 before reversing sharply and breaking the trendline.
The market is currently testing the support zone (near the 145.273 entry level).
Moving averages (red = short-term, blue = long-term) show a crossover to the downside, suggesting short-term bearish momentum.
📈 Trade Setup:
Strategy Type: Long (Buy) Setup
Risk/Reward: Favorable, approximately 1:2+
Entry Zone: The current price is close to the entry level at 145.273, making this a timely area to watch for a bounce or confirmation.
⚠️ Risk Factors:
If price breaks below 144.817, the setup becomes invalid.
Short-term momentum is still bearish; confirmation (like a bullish engulfing candle or support hold) is important before entering.
✅ Confirmation Triggers for Entry:
Strong bullish candlestick pattern near entry zone.
RSI or MACD bullish divergence (not shown but useful to check).
Volume spike on bounce from support.

GOLD SPOT (XAU/USD) 1H ANALYSIS – BULLISH STRUCTURE HOLDING STRO📈 GOLD SPOT (XAU/USD) 1H ANALYSIS – BULLISH STRUCTURE HOLDING STRONG! 🚀✨
🔍 Overview:
Gold is currently trading within a well-defined ascending channel 📊, showing clear bullish intent. Price action has respected the lower channel support, bouncing strongly from a key demand zone highlighted in blue.
🟦 Support Zone:
The price is consolidating just above the $3,385–$3,390 support zone 🛡️, which has acted as a springboard multiple times in the past. This area aligns perfectly with the lower trendline, increasing its reliability.
📍 Key Price Targets:
🎯 $3,402 – First breakout confirmation and minor resistance.
🎯 $3,422 – Mid-level target, possible resistance.
🎯 $3,452 – High-probability target if bullish momentum continues.
🎯 $3,460+ – Extended target aligning with the channel top.
📈 Technical Structure:
Price is respecting higher lows and higher highs, maintaining bullish momentum.
A breakout above $3,402 could trigger the next leg up.
Market is forming a bullish flag/pennant consolidation—potential breakout pending ⏳.
⚠️ Risk Zone:
A break below the demand zone and the channel could invalidate the bullish setup ❌. Close monitoring of lower structure is essential.
✅ Conclusion:
As long as price holds above the key support zone and within the ascending channel, bullish continuation remains the favored scenario. A breakout above interim resistance levels could send Gold toward $3,450+! 🌟📊
🔔 Watch for bullish confirmation candles or volume spikes before entry!
📅 Chart published: June 18, 2025 | XAU/USD | 1H timeframe
🧠 Strategy: Bullish breakout play 📈
💡 Sentiment: Moderately Bullish ♻️

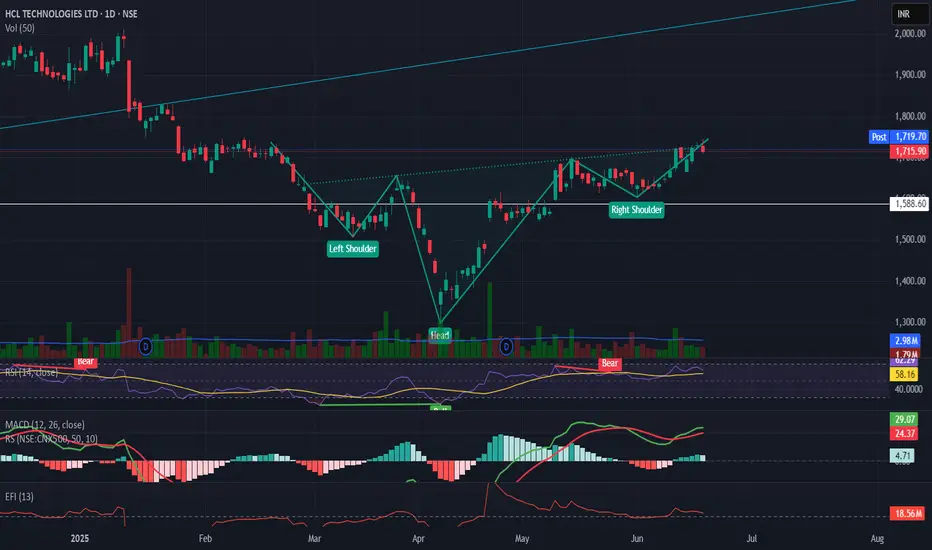
HclTech with inverse head and shoulders patternHclTech is showing six months long inverse head and shoulders pattern with major resistance at 1750.
RSI at 58
MACD is above its signal line and trending higher.
Efi Is above zero and is stable right now
target at 2140-2400 based on the pattern
Gold (XAU/USD) 1H Analysis – Potential Breakout Play🟡 Gold (XAU/USD) 1H Analysis – Potential Breakout Play 📈
🔎 Key Levels and Zones
Resistance Zone: Around $3,410 – $3,430.
Midpoint/Key Resistance-Turned-Support: Around $3,360 – $3,370.
Support Zone: Around $3,270 – $3,290.
🔀 Chart Structure & Momentum
The price is in a short-term bullish recovery after finding strong support at the $3,270 – $3,290 level.
The breakout above the midpoint around $3,360 is a significant bullish trigger, suggesting that bulls are taking charge.
📊 Scenario Analysis
Bullish Scenario (Primary Bias) 🟢: If the price holds above the midpoint ($3,360), we expect a push towards the resistance zone ($3,410 – $3,430). This aligns with the “resistance-flip-support” concept, where the previous resistance becomes a new support base.
Bearish Scenario (Alternate Bias) 🔴: If the price fails to hold above $3,360, a re-test of the support zone ($3,270 – $3,290) is likely. From there, bulls will likely try to defend the area and launch another attempt upwards.
📌 Conclusion
The path of least resistance currently favors the bulls while the $3,360 level holds.
Watch for consolidation near $3,360 – $3,370 as a healthy retest before potential continuation to the upside target zone ($3,410 – $3,430).
📅 Near-Term Bias
Remain cautiously bullish while above $3,360.
A confirmed breakout above $3,410 opens room for further bullish momentum, while a breakdown below $3,360 can re-test the key support at $3,270.

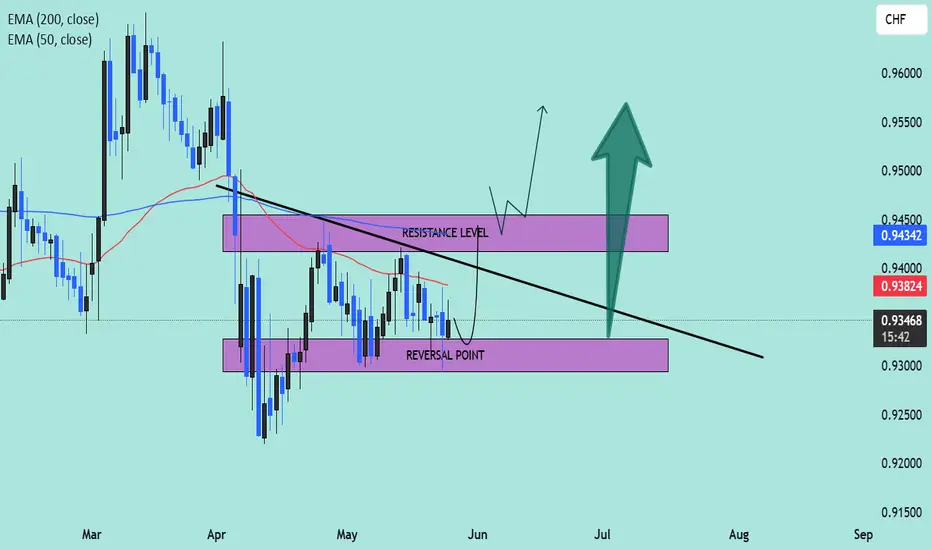
EUR/CHF Technical Outlook – Potential Bullish Reversal Setup📈 Pair: EUR/CHF
📆 Date: May 27, 2025
📊 Timeframe: Daily (D1)
📌 Technical Highlights:
🔹 Current Price: 0.93456
🔹 Key Indicators:
50 EMA (Red): 0.93824
200 EMA (Blue): 0.94342
🧠 Chart Analysis:
🔻 Downtrend Resistance Line: A clear descending trendline is pressing price lower, reinforcing a bearish structure since March.
🟣 Reversal Zone (Support Area):
Price is currently hovering just above the marked Reversal Point, a demand zone between 0.93000–0.93400. Historically, this zone has acted as a launch pad for upward momentum.
🟪 Resistance Level:
Located around 0.94300–0.94600, this zone is reinforced by the 200 EMA, making it a critical breakout area. A strong bullish close above this region could invalidate the downtrend.
🔄 Two Scenarios to Watch:
✅ Bullish Breakout Scenario:
Price may bounce from the reversal zone.
A break and retest above the resistance level could lead to bullish continuation toward 0.9500–0.9550.
Confirmation above the 200 EMA will add confidence to the breakout.
📈 Potential Buy Entry: On breakout and retest of 0.9450
🎯 Target: 0.9550
🛡️ Stop Loss: Below 0.9320
❌ Bearish Continuation Scenario:
If price fails to hold above the reversal point, sellers may regain control.
A breakdown below 0.9300 could trigger further downside toward 0.9200 or lower.
📉 Sell Setup Invalid Until: Price closes below 0.9300 on strong volume.
🧭 Conclusion:
This chart suggests a critical decision point for EUR/CHF. A bounce from the reversal zone followed by a confirmed break above resistance could signal the start of a medium-term uptrend. Traders should monitor price action closely for confirmation signals near the trendline and EMA zones.
🚦 Bias: Neutral to Bullish, awaiting confirmation
🧠 Tip: Watch for candlestick patterns (like bullish engulfing or pin bars) near the support zone for early entries.
EUR/USD Forming Double Top –Bearish Reversal Toward Key Support?📉 EUR/USD Technical Outlook – Bearish Bias Developing 🔍
🟪 Key Resistance Zone:
📍 1.1350 – 1.1450
Price has tested this resistance zone multiple times, forming a double-top pattern (🔄) within the highlighted circle. This signals buying exhaustion and potential reversal pressure. The recent failure to break above confirms the zone’s strength.
🔴 EMA Confluence:
🧭 50 EMA (red): ~1.1242
🧭 200 EMA (blue): ~1.0961
The price is currently hovering just above the 50 EMA but well above the 200 EMA, which is acting as a dynamic support. The crossover has already occurred, so if price breaks below the 50 EMA decisively, momentum could shift bearish.
🔻 Support Breakdown Risk:
A breakdown from the 1.1200 neckline area (highlighted in red oval) would confirm the double-top pattern 🎯. That opens downside potential toward the strong demand zone below.
🟪 Strong Support Zone:
📍 1.0700 – 1.0800
This area aligns with prior consolidation (March lows) and the 200 EMA, making it a high-probability reversal zone 📈 if the bearish scenario plays out.
📌 Trade Setup Insight:
✅ Bearish confirmation below 1.1200 neckline 📉
🎯 Target: 1.0800 zone
❌ Invalidation: Break above 1.1350 resistance
🔵 Summary:
The chart is hinting at a classic double-top reversal below a key resistance zone. If price breaks the neckline, sellers are likely to gain control, targeting the strong support near the 200 EMA.
📊 Bias: Bearish 👇
📅 Timeframe: Daily
🛑 Risk Management: Watch for fake-outs near neckline; volume confirmation preferred.

Technical Levels Respected – BTC Reaches $108K Target📍 BTC Target Hit with Precision!
✅ As predicted in the previous analysis, Bitcoin has successfully tapped the $108K resistance zone — clean and technical execution!
📊 My chart spoke in advance... and the market listened.
🎯 Why miss out on these accurate forecasts?
📉 My strategies are not just random lines — they’re built on solid market structure, EMAs, and key price action zones.
📢 Let’s stay connected!
🧠 I’m committed to sharing educational content and professional trading insights to help you grow as a trader.
💡 Whether you're a beginner or seasoned trader, there’s always something new to learn with me.
📚 Join the journey — learn, trade, and win!
📩 DM or follow to get consistent updates and chart breakdowns.
🚀 Let’s trade smart, not hard!

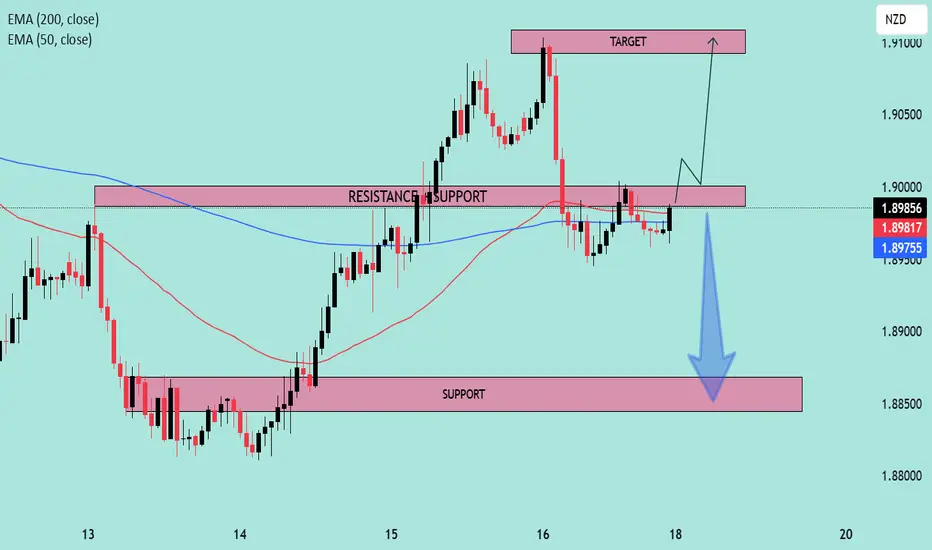
EURNZD at Key Decision Zone | Breakout or Breakdown? 📊 Pair: EURNZD
🕒 Timeframe: Likely H1 or H4
📅 Date: May 18, 2025
🔍 Technical Analysis
🔁 Key Zones
🔴 Resistance-Turned-Support (RTS):
1.8975 – 1.8990
This area was previously a resistance level that price broke above, and is now acting as a critical support zone (flip zone). Price is currently retesting this area.
🎯 Target Zone (Resistance):
1.9085 – 1.9110
This is the next projected bullish target if price successfully rebounds from current support.
🛑 Major Support Zone:
1.8840 – 1.8860
Strong buying interest was seen here previously, acting as a safety net in case of bearish rejection from the current level.
🔄 EMA Confluence
📘 EMA 200 (Blue): 1.8975
📕 EMA 50 (Red): 1.8981
Price is hovering around the EMAs, indicating a moment of decision. A decisive move above these EMAs could trigger bullish momentum. 📈
🔮 Scenario Outlook
🟢 Bullish Scenario (Preferred Setup)
✅ Confirmation above 1.8990
➡️ Retest and continuation could push price toward the 1.9100 target zone.
🔼 Momentum supported by prior breakout and higher lows.
📌 Entry Idea: Above 1.8995
🎯 Target: 1.9100
🛡️ Stop: Below 1.8950
🔴 Bearish Scenario
❌ If price fails to hold the 1.8970–1.8990 zone, a breakdown could follow.
⬇️ Likely move toward 1.8850 support zone.
🚨 Watch for bearish engulfing or rejection candles near resistance.
🧠 Summary
Price is at a key decision point.
✅ Bullish bias is slightly stronger due to market structure (higher highs & higher lows).
⚠️ But a clean break below support would shift focus to the downside.
📈 Strategy: Wait for confirmation ⚖️
Bullish: Break + retest of 1.8990
Bearish: Breakdown below 1.8950 and close under EMAs
Critical Reversal or Breakdown? | XAU/USD at Make-or-Break Zone 📉 Chart Overview:
Instrument: XAU/USD (assumed from chart context)
Timeframe: 4H or Daily (based on candlestick size)
Indicators Used:
📏 EMA 50 (Red): 3,247.86
📏 EMA 200 (Blue): 3,221.42
🔍 RSI (14): Currently at 45.90 (below midline, showing weak momentum)
🔎 Key Zones:
🧱 Support Zone: ~3,180 – 3,220
Price is currently sitting on this key demand zone.
Price previously bounced here sharply ➡️ indicating buyer interest.
📦 Resistance Block: ~3,260 – 3,280
Short-term resistance, price has been repeatedly rejected from here.
🎯 Target Zone: ~3,420 – 3,460
If price breaks out from the support-resistance squeeze, this is the potential bullish target 🎯.
🧭 EMA Analysis:
EMA 50 is still above EMA 200 ➡️ Golden Cross formation (medium-term bullish bias) ✅
However, price is currently below both EMAs, signaling short-term weakness ❌
📉 Bearish Scenario (📍Blue Arrow Down):
If price breaks below the support zone at ~3,180, we could see a sharp drop toward the next support at ~3,032 🔻.
RSI is trending down near 40, close to oversold territory ⚠️
🚀 Bullish Scenario (📈 Blue Arrow Up):
A successful retest and bounce from this support area (currently forming a rounded bottom 🥄) could lead to a bullish move toward the target zone.
This is further supported by the potential RSI bounce from the 40 area, signaling renewed momentum 🔋.
✅ Bias & Conclusion:
Neutral-to-Bullish Bias 🤝: As long as the price holds above the major support zone (~3,180), buyers have a chance to reclaim higher levels.
Look for confirmation breakout above the local resistance (~3,260) for a move toward 3,400+ 🚀.
A breakdown below support would invalidate the bullish thesis and target 3,030 instead 📉.
🛠️ Trading Plan (not financial advice!):
Long Entry: On bullish breakout & retest of ~3,260 ✅
Stop-Loss: Below ~3,180 ⚠️
Target: ~3,420 – 3,460 🎯

USD/JPY Rebounds from Key Support – Eyes on 150.035 Target Support Zone:
The price is currently respecting a strong support area between 144.459 - 145.101. This zone aligns closely with the 200 EMA (145.101), increasing its validity.
EMAs:
50 EMA (146.059) is slightly above the current price.
200 EMA (145.101) is acting as dynamic support.
Price is currently trading just above the 200 EMA and below the 50 EMA — a neutral-to-bullish bias, especially since it bounced off support.
Bullish Signal:
The price has rejected the support zone and is attempting to break higher, supported by the bullish arrow projection.
Target Point:
Clearly marked at 150.035, which is a previous resistance level. This gives a potential upside of around 460 pips from the support area.
🧭 Trade Idea (if bullish bias is maintained)
Entry: Around 145.40–145.10 (current area)
Stop Loss: Below 144.459 (support base)
Take Profit: Around 150.035
Risk-Reward: ~1:3 or higher, depending on exact entry/exit.
⚠️ Caution
Watch for resistance at 146.059 (50 EMA); a clean break and retest would further confirm upside potential.
If price closes below 144.459, bullish invalidation could lead to a deeper correction

XAU/USD) Bullish Trade Setup – Targeting $3,506.52 with Entry atEntry Point: $3,221.19
Stop Loss: $3,169.80
Resistance Zone: Around $3,277.98 to $3,280.64
Target (TP) Point: $3,506.52 (Approx. 9.05% upside)
📊 Technical Indicators and Markings:
Moving Averages:
Likely a 50-period (blue) and 200-period (red) moving average.
Price is currently below both MAs, signaling a short-term downtrend.
Support & Resistance Zones:
Strong support around $3,207.67–$3,221.19 (entry area).
Resistance at $3,244.25–$3,280.64.
Stop-loss is strategically placed below support to limit downside risk.
Target Area:
Projected upside target is $3,506.52, with a potential 9.05% gain from the entry.
This is marked as the EA (Expert Advisor) Target Point, possibly suggesting this is a strategy from an automated trading system.
Orange Circles:
Likely indicate swing highs and lows, used to identify trend patterns and potential reversal points.
📈 Trading Idea Summary:
Bullish Setup: Buying at support, aiming for breakout above resistance to reach target.
Risk-Reward Ratio: Favorable, assuming price holds above $3,207.
Watch for Confirmation: Price needs to break above resistance around $3,280 for momentum continuation

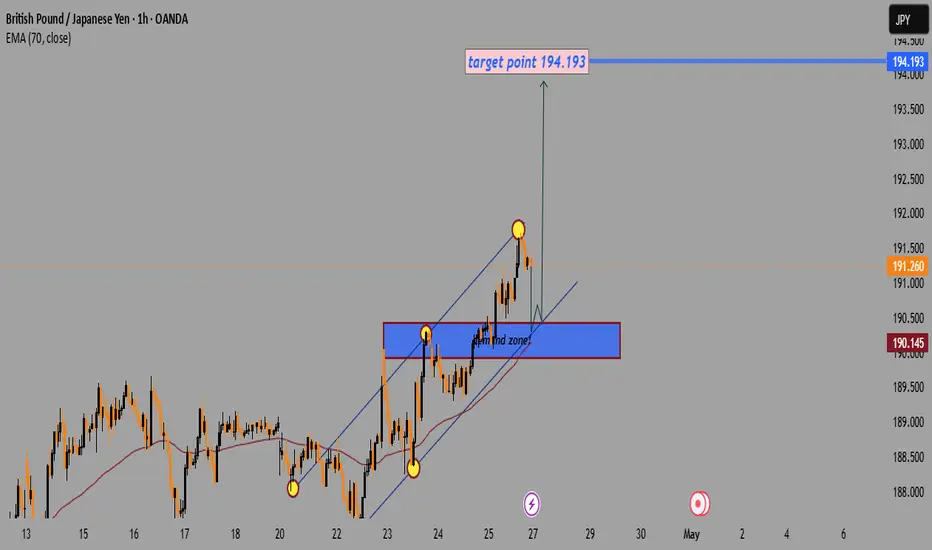
GBP/JPY Bullish Setup:Targeting194.193 After Demand Zone RetestTrend:
📈 Uptrend inside a rising channel (blue lines).
Key Zones:
🟦 Demand Zone: Between 190.400 - 190.700.
🧲 Acts as strong support where buyers previously stepped in.
Indicators:
📉 EMA 70 at 190.145 (below price) → bullish support.
Price Action:
📍 Current price: Around 191.260.
🔥 Recently touched upper channel resistance and pulled back slightly.
Target:
🎯 Target Point: 194.193.
Scenario:
🔄 Expecting a small pullback towards the demand zone or channel support.
🚀 Then a bullish continuation towards the target (194.193).
Risk Warning:
⚠️ If the price breaks below the demand zone and EMA, the bullish idea might be invalid.