XAUUSD HUGE 36 POINTS UPSIDE POSSIBLE NEW ALL TIME HIGH 3171++XAUUSD strong again buy mode chance above 3134.60
there is no resistance upto new all time high 3171++++
wait for active zone
Buy above 3134.60
Stoploss...............3124.....10 points
Target1.........3141.......6 points+++
Target2.........3151.......16 points+++
Target3..........3161.......26 points+++
Target4...........3171+++ new all time high ....upto 3178+++
Disclaimer - This level only for educationa purpose and papertrade . Do ur own analysis. Thank u
Indicators

Gold (XAU/USD) Bullish trend Demand Zone – Trend Analysis🔵 Demand Zone (Support Area):
This blue zone represents a strong buying area where buyers are expected to step in.
If the price touches this zone and bounces, it confirms bullish strength.
📉 Trend Line Break:
The previous trendline has been broken ⛔, signaling a possible retest before a move up.
🛑 Stop Loss (Risk Management):
Positioned at 3,108.52 🔴, meaning if the price drops below this, the trade setup becomes invalid.
🎯 Target Point (Take Profit Level):
3,167.77 ✅ is the potential profit zone if the price moves upward from the demand area.
🟠 Expected Price Movement:
The orange dotted line 🔶 suggests a likely move:
1. Price dips into the demand zone (🔵).
2. Bounces back up 🔄.
3. Breaks minor resistance 🟦.
4. Rallies to the target zone 🎯.
Overall, bullish movement 📈 is expected if the demand zone holds! 🚀

XAUUSD 18 points up NEXT ALL TIME HIGH 3170++XAUUSD strong above 3152.30
There is no resistance upto 3170++
wait for active zone
Buy above 3152.30
Stoploss...........3144.70.....7.60 points
Target1...........3158....6 points
Target2............3160...8 points
Target3............3168...16 points
Target4 Risk.......3170...18 points
Final expect 3178 to 3185 only maximum
I suggest buy above only mode 3152.30
below this levels downtrends
Disclaimer - This level only for educational purpose and papertrade . Do ur own analysis

XAUUSD 13 POINTS STRONG INTRADAY ABOVE 3137.10 TARGET UPTO 3150XAUUSD strong zone intraday wise if active above 3137.10
current mkt price 3133.40
there is no resistance upto 3141.50 next 3150
wait for active
Buy above 3137.10
Stoploss..............3131....6 points
Target1.............3141.50....4.50 points
Target2.............3150........13 points
Disclaimer- This level only for educational purpose only . Do ur own analysis

XAUUSD 1% FALL CHANCE 38 + POINTSXAUUSD weak below only 3116.50
There is no suport 3116.50 to 3078
wait for active zone
Sell below only 3116.50
Stoploss...............3126...10.50 points
Target1................3108....8 points
Target2................3093....23.50 points
Target3...Risk.........3078....38.50 points
1 % fall chance
Disclaimer - This level only for educational purpose only. Do or own analysis.

BANKNIFTY READY TO FLY 600 POINTS NEXT TARGETS...Banknifty strong zone above only 51245
There is no resistance upto 51830
wait for active zone
Buy above 51245
Stoploss.........50960....285 points
Target1.........51480.....235 points
Target2.........51830.....600 points
Disclaimer - This level only for education and paper trade purpose only. Do ur own analysis

XAUUSD STRONG ABOVE 3118 ..TARGET 3142.....24 POINTSPREVIOUS LEVELS MODIFY
xauusd buy above strong zone
there is no resistance upto 3142
wait for active zone
Buy above 3118
stoploss............3111....7 points
Target1..........3123.50......5.50 points
Target2.........3132...........14 points
Target3..........3142+..........24 points
Disclaimer - This level only for education and papertrade purpose only. Do ur own analysis

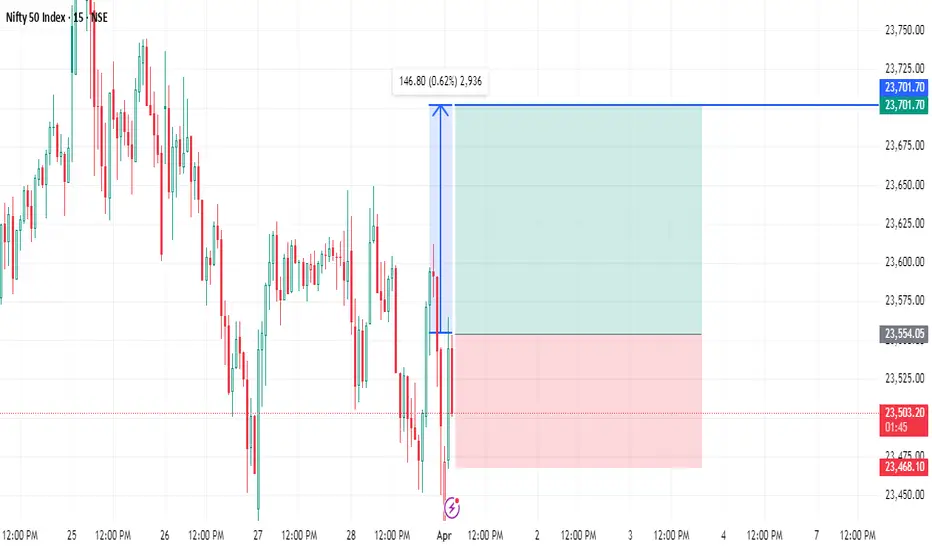
NIFTY ABOVE STRONG 23555- TARGET23700....145 POINTSNIFTY STRONG ABOVE 23555
There is upto no resistance 23700
wai for activezone
Buy above 23555
Stoploss...........23470.....85 points
Target............23700......145 points
Disclaimer- This level only for educational purpose . Do ur own analysis
Gold Spot (XAU/USD) Price Analysis –Key Zones & Potential Movemt🔵 Key Price Levels:
Current price: 🟠 $3,130.99
DEMA (9): 🔵 $3,138.21
Target price: 🎯 $3,174.92
📌 Zones Identified:
🟢 Demand Zone (Support) ⬇️: Strong buying interest, potential bounce area. If price falls here, buyers may step in.
🟡 RBR Zone (Rally-Base-Rally) 🔄: A mid-level area where price could consolidate before moving up.
🔴 Supply Zone (Resistance) ⬆️: Sellers might emerge, causing a reversal or slowdown in price movement.
📈 Potential Price Action:
🔹 Scenario 1 (Bullish 🐂): A retrace to the RBR Zone 🟡 could lead to a bounce 📈 toward the Target 🎯 at $3,174.92.
🔹 Scenario 2 (Bearish 🐻): If price drops below the Demand Zone 🟢, it may signal a trend reversal 📉.
🔹 Breakout Confirmation: If price breaks above the Supply Zone 🔴, it may continue rallying 🚀 toward the target point.

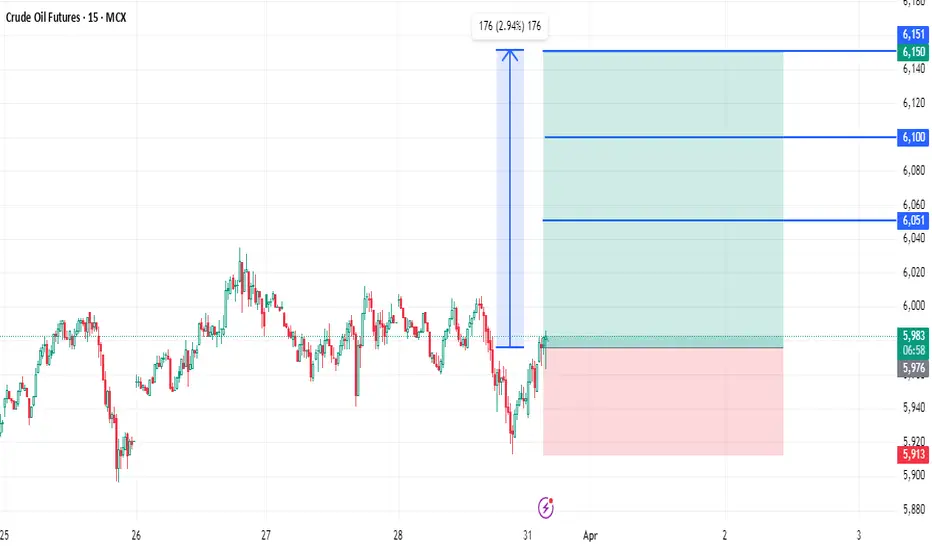
CRUDE CMP BUY 5970 TARGET 6150...180 POINTS CRUDE strong buy zone now 5970 above
Bottom out now
Buy cmp 5970
Stoploss 5913
Target1.....6005.....35 points
Target2.....6050......80 points
Target3......6100......130 points
Final 6150................180 points
Disclaimer- This level only for educational purpose only. Do ur own analysis
XAUUSD 23 POINTS FALL SHARF FALL BELOW 3113.30...UPTO 3090XAUUSD weak below zone 3113.30
There is no suport upto 3090
wait for active mode
Sell below only 3113.30
Stoploss 3021......8 points
Target1.....3109........4.30 points
Target2.....3100........13.30 points
Target3......3090.........23++ points
Disclaimer - This level only my view and education purpose only. Do ur own analysis

BTCUSD READY TO FLY 1400 POINTS ..ONESIDE UP CHANCE Btcusd strong zone above 82400
strong above 82400 there is no resistance upto 83800
wait for active mode
Buy above 82400
Stoploss.......81950....450 points
Target1........83000....600 points
Target2........83800.....1400 points
Disclaimer- This level only for educational purpose only . Do ur own analysis

XAUUSD 20 PTS SHARP FALL SURE BELOW 3113.50XAUUSD weak below 3113.50
sharp fall will chance upto 3093.....20 points
weak zone there is no suport zone below 3113.50 letsee
wait for active zone
Sell below...................3113.50
Stoploss.....................3121....7.50 points
Target1.........3109.50.....4points
Target2.........3100.........13.50 points
Target3..........3093........20+ points
Disclaimer- This level only for education purpose . Do ur own analysis

Silver (XAG/USD) Price Analysis – Key Levels & Market Outlook🔍 Key Observations:
📊 Current Price: 34.19250 USD
📈 DEMA (9, close): 34.25605 USD
🎯 Target Price: 35.38940 - 35.5000 USD
🔵 Zones Identified:
🟦 Supply Zone: 34.50 - 34.80 USD (🔼 Selling pressure area)
🟦 RBS Zone: 34.00 - 34.20 USD (🔽 Potential bounce zone)
🟦 Lower RBS Zone: 32.80 - 33.20 USD (⬇️ Strong support)
📉 Market Scenarios:
✅ Bullish Case:
Price bounces off the RBS zone at 34.00 USD ➡️ Uptrend resumes 🚀
Target: 35.50 USD 🎯
❌ Bearish Case:
Breaks below 34.00 USD ❗
Next stop: 33.00 USD ⚠️
📢 Final Thoughts:
🟢 Buyers: Wait for a bounce at 34.00 USD before entering 📈
🔴 Sellers: Look for rejection at 34.50 - 34.80 USD or breakdown below 34.00 USD 📉
⚡ Key Level to Watch: 34.00 USD 👀 A hold = bullish 📊, a break = bearish ⚠️

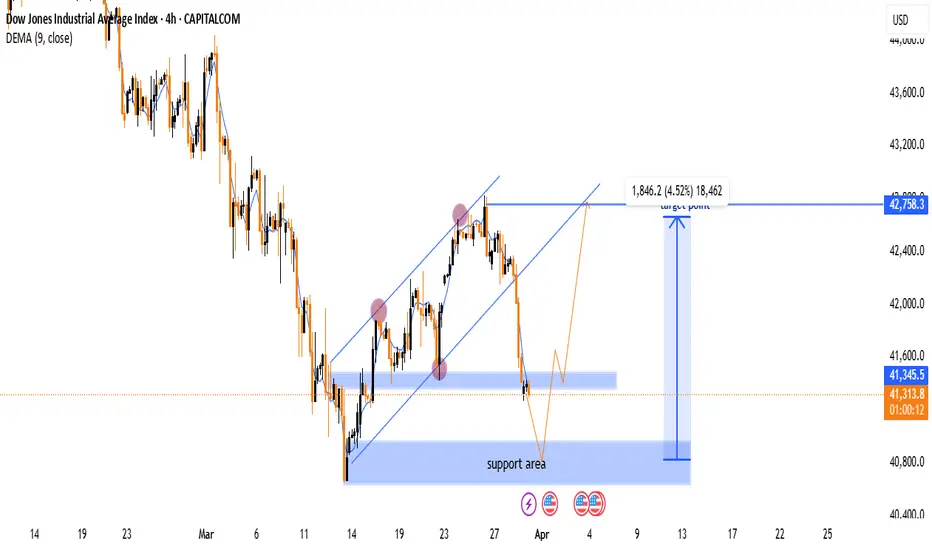
Dow Jones 4H Chart Analysis: Support Test & Potential Reversal 📉 Downtrend: The price was falling sharply before forming an upward channel.
📊 Channel Break: The price broke below the ascending channel 🚨.
🟦 Support Zone: The blue area marks a strong support region 📌.
🔵 Bounce Expected? If the price holds, a rebound could happen 📈.
🎯 Target: The projected upside target is 42,758.3 🚀.
⚠️ Risk: If the support fails, the price may drop further ⛔.
🔴 Watch for: A confirmed reversal near support or further breakdown!
XAUUSD 14 POINTS SELL BELOW 3114 SHARP FALL UPTO 3100..XAUUSD weak below only 3114
below 3114 there is no suport so sharp fall will hapen
wait for active zone
sell below 3114
stoploss..3121.......7 points
Target1........3109.50...4.50 points
Target2........3100........14 points
Disclaimer - This level only for education purpose only

BTCUSD 1000 POINTS CHANCE UP STRONG ABOVE 83640 TO 84640BTCUSD strong above only 83640
current mkt price 84110
waiting for active
Buy above 83640
Stoploss 83175...465 points
Target 84640.....1000 points
Disclaimer - This level only for education purpose and paper trade . Do ur own analysis

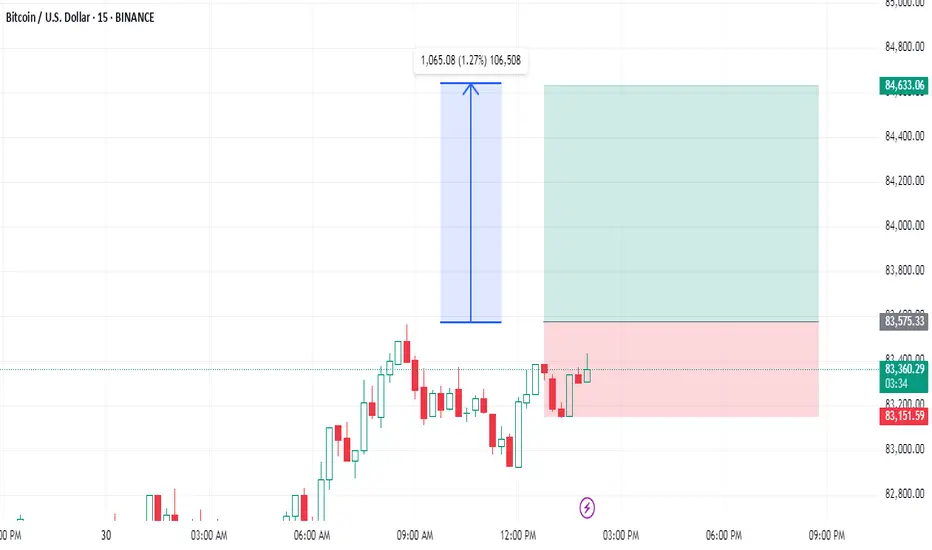
BTCUSD READY TO FLY 1060 POINTS CHANCE TO SPIKE ONESIDEBTCUSD STRONG ABOVE 83575 ONLY
current mkt price 83384
Wait for Active
Buy above 83575
Stoploss .............83150......425 points
Target 1060 points
Risk reward 2:5 ratio
Disclaimer - This level only for education purpose and papertrade only. Do ur own analysis
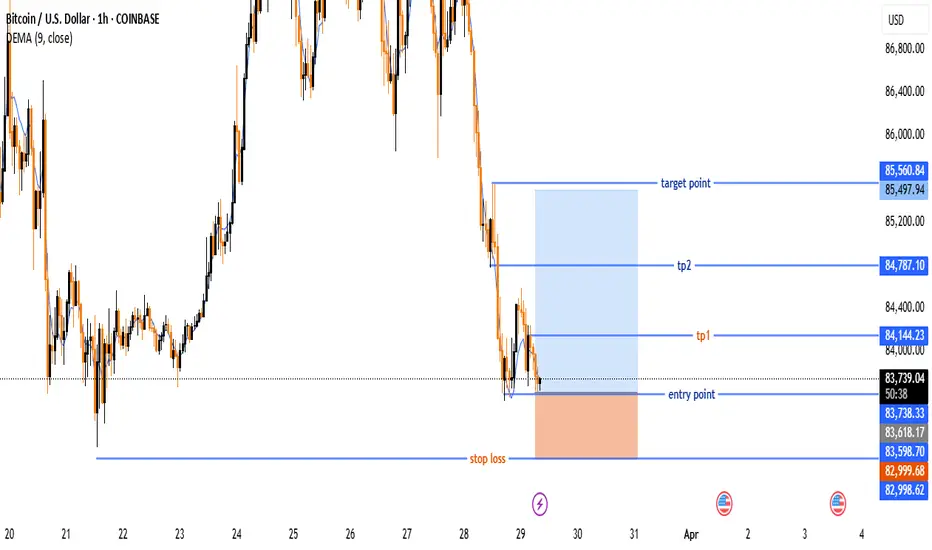
Bitcoin (BTC/USD) Trade Setup – Potential Reversal &Target Leves🔵 Entry Point:
🔹 Around $83,678.04 – The suggested buying zone.
🛑 Stop Loss:
🔻 $82,998.62 – The price level where the trade will be exited if it moves against the plan.
🎯 Target Points:
✅ TP1: $84,144.23 – First profit target.
✅ TP2: $84,787.10 – Second profit target.
🏆 Final Target: $85,560.84 – The ultimate goal for the trade.
📈 Technical Overview:
🔹 The price is at a support level, with a potential reversal to the upside.
🔹 Risk-Reward Ratio is favorable, with a clear uptrend target.
🔹 DEMA (9) at $83,776.52 indicates a possible trend shift.
Gold (XAU/USD) Bullish Outlook: Key Levels & Trade Setup📊 Gold (XAU/USD) 1H Chart Analysis 📈
🔹 Current Price & Trend:
📍 Price: 3,077.46 USD
📈 Uptrend in play (Higher Highs & Higher Lows)
📊 9-period DEMA: 3,078.47 USD (showing bullish momentum)
🔹 Key Levels:
📍 Demand Zone (Support) 📥: 🟦 3,030 - 3,040 USD (Potential Buy Area)
📍 Fair Value Gap (FVG) ⚡: 🟦 Price may retrace here before continuing up
📍 Resistance Zone (Short-term) 🚧: 🟦 3,085.15 USD
🎯 Target Price: 🔵 3,110.09 USD
🔹 📉 Possible Scenario:
1️⃣ Price retraces to the FVG zone 🟦 (Healthy pullback)
2️⃣ 📈 Bullish continuation toward the 3,110 target 🎯

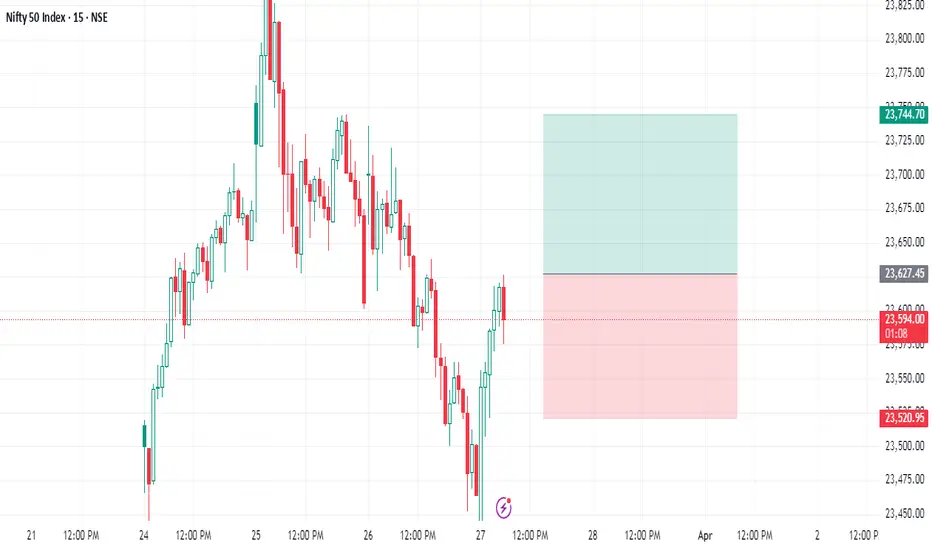
Nifty next Target 23750...112 points..SpikeNifty buy above 23627
Stoploss 23520....107 points
Target ........23740++ 112 points
Wait for active .. If active move oneside direct..check
This level only for education purpose only
Do ur own analysis
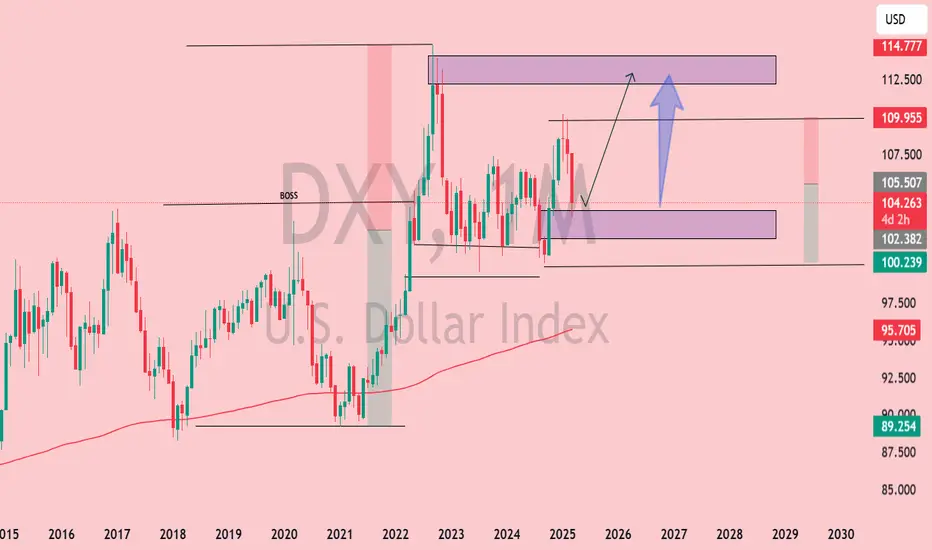
DXY Monthly Analysis: Key Support Holding, Bullish Move Ahead?📊 DXY Monthly Chart Analysis (March 27, 2025)
Key Observations:
Current Price Action:
The U.S. Dollar Index (DXY) is trading near 104.267, with notable resistance ahead.
Price is consolidating within a key demand zone (~102.5–104) after rejecting higher levels.
Technical Levels:
Support Zone: 100.2–104 (Highlighted in purple)
Resistance Zone: 112.5–114.7 (Highlighted in purple)
Major Resistance: 114.77 (Previous high, acting as a supply zone)
200-MA Support: Located below current price, offering a long-term bullish confluence.
Market Structure:
Price remains in a higher time-frame bullish trend but is experiencing a correction.
The "BOSS" level (Break of Structure) suggests a prior bullish breakout.
If the demand zone holds, a bullish continuation towards 112.5–114.7 is possible.
Projected Move:
A bounce from 102–104 could trigger a rally toward the upper resistance zone (~112.5).
A break below 100.2 could indicate a shift in trend and further downside.
Conclusion:
DXY is at a critical decision point. Holding the current support zone (~102–104) could fuel a bullish continuation toward 112–114, while a breakdown below 100.2 would weaken bullish momentum.