Elaborative analysis on Nifty: 10/12/25Watch till the end, it will be a little lengthy in comparison to my earlier videos.
This video will cover not only levels of nifty to consider but also a few educational points.
If there is any query regarding any point, mention it in the comment, so I will try to make it in the next video.
Still, no clear trend for Nifty is evident, but be ready for either side of the trend.
Indices

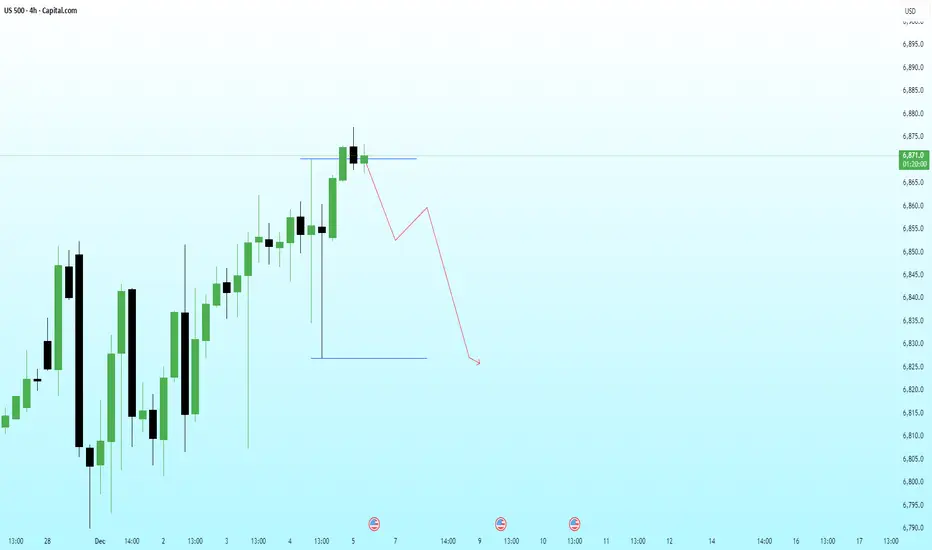
US500 – Liquidity Sweep at the Highs With Bearish Continuation PPrice has swept the immediate buy-side liquidity sitting above the recent high and is already showing signs of exhaustion. The reaction suggests a possible distribution phase forming near the top, aligning with the broader HTF narrative for a corrective leg.
If price fails to reclaim the swept high, the next logical target becomes the sell-side liquidity resting at the lower blue line.
Bearish Path:
• Sweep of the highs
• Failure to sustain above the level
• LTF shift into bearish structure
• Continuation toward downside liquidity + imbalance fill
⚠️ ENTRY CONDITION (IMPORTANT):
I will execute this trade only if the LTF replicates the structural behavior I expect from the HTF.
No LTF confirmation = No trade.
Nifty 50 at a Critical Juncture – Breakdown or Bounce Ahead?Technical Overview – Trendline Test in Action
After breaking out of a well-defined falling wedge pattern in April 2025, the Nifty 50 had been respecting an ascending support trendline, offering steady higher lows and consistent bullish structure.
However, in the most recent session, price closed just below this key trendline at 24,926.80, with volume slightly elevated — a signal that the bulls are losing control unless support is reclaimed quickly.
Key Technical Levels
Immediate Resistance: 25,100–25,250
Trendline Support (Broken): ~24,950
Major Demand Zone: 24,300–24,600
Critical Breakdown Level: 24,850
Options Chain Snapshot – What Smart Money Is Signaling
Expiry: 31st July 2025
Spot: 24,935.50
Futures: 24,956.50
🔸 Call Writers in Control
Significant OI at 25,000 CE (140.7K) and 24,950 CE (38K)
Call unwinding seen from 24,700 to 25,200, suggesting profit booking or reduced bullish conviction
IVs remain compressed across ATM and OTM calls → calm surface, but pressure building
🔹 Put Writers Still Active
24,900 PE (101K OI, +59.5K) and 25,000 PE (143K OI, +40.9K) are heavily defended
PCR remains above 1 for 24,950–25,000 zone → put writers betting on expiry support
Rising OI at 24,800 PE (84K) also shows growing downside hedges
Data vs. Price – A Divergence Worth Watching
While options data suggests bulls are trying to defend 24,900–25,000 with heavy put writing, price action tells a different story. A clean break of the trendline and a lower daily close below 24,850 would shift momentum in favor of the bears.
📉 Breakdown Confirmation:
Sustained move below 24,850
Rising call OI at 25,000+
Unwinding of 24,900 PE and 24,800 PE
Pickup in IV and red candle with volume
Strategy Ideas (Educational Purpose Only)
🟩 Bullish Scenario
Bias: Long above trendline reclaim
Entry: On breakout above 25,050
Stop Loss: Below 24,850
Target: 25,300 and then 25,500
🟥 Bearish Scenario
Bias: Short below confirmed breakdown
Entry: Below 24,850
Stop Loss: Above 25,050
Target: 24,600, possibly extending to 24,300
🟨 Neutral / Non-Directional View
Bias: Range-bound / IV crush play
Strategy: Short Straddle using 24,950 CE + 24,950 PE
Hedge Zone: Manage risk beyond ±150 points
Goal: Capture premium decay as expiry nears
🧭 Conclusion – Prepare, Don’t Predict
The Nifty 50 is sitting at a crucial inflection point — where structure meets sentiment. While option writers continue to show faith in the 24,900–25,000 zone, a clean break below the recent support could trigger swift downside toward the 24,400 zone.
In times like these, reacting to confirmation is smarter than pre-empting moves. Watch price, volume, and open interest shifts closely in the coming sessions.

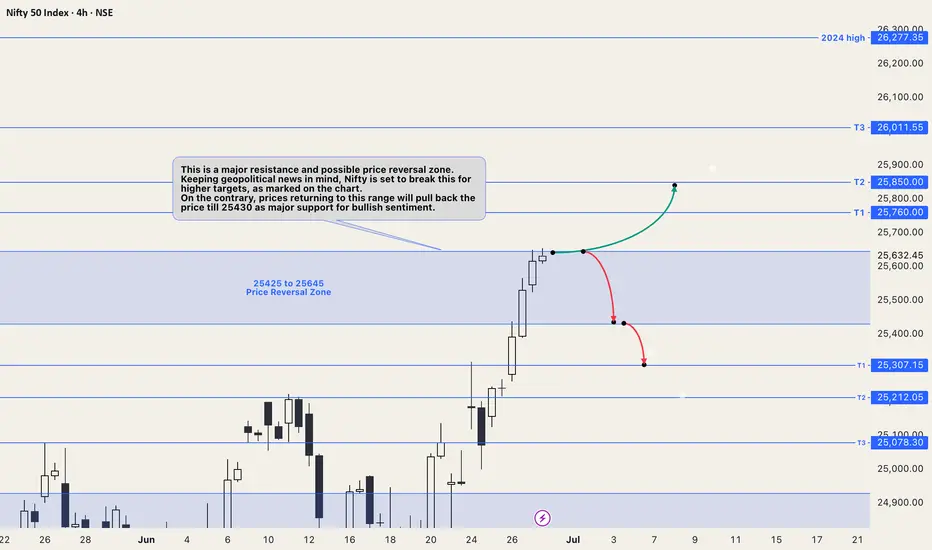
Nifty chart updates for this coming weekThis is a major resistance and possible price reversal zone. Keeping geopolitical news in mind, Nifty is set to break this for higher targets, as marked on the chart.
On the contrary, prices returning to this range will pull back the price to 25430 as major support for bullish sentiment.
All major levels for targets on both sides are mentioned on the chart. The Price trading in the blue colored range is a no-trade zone, which means it will be range-bound until it gives a breakout on either side.
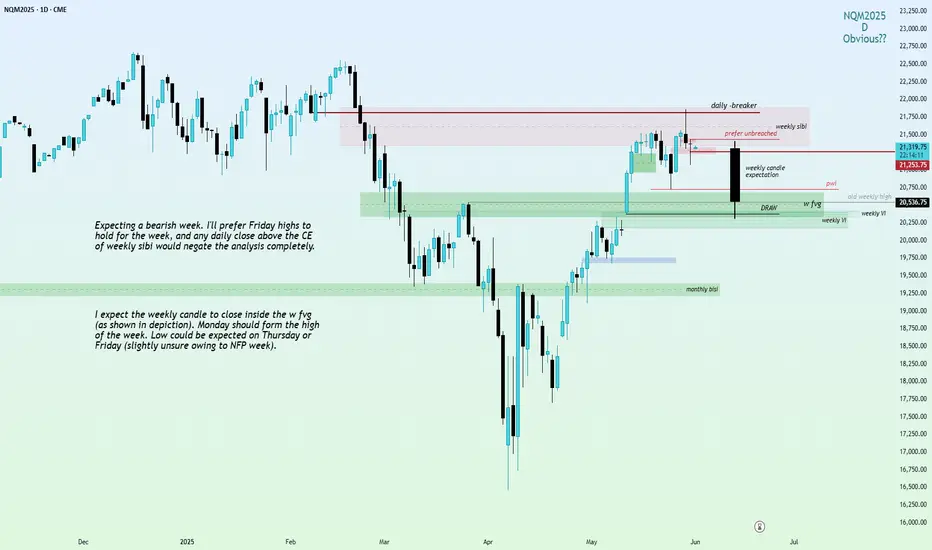
Weekly Review for US Indices. Bearish.Hello traders!
I've mentioned everything on the chart itself. Attaching YM and ES charts as well.
YM
ES
Note that if YM breaks Thurday's high, analysis of NQ and ES will be negated as well.
GLGT!
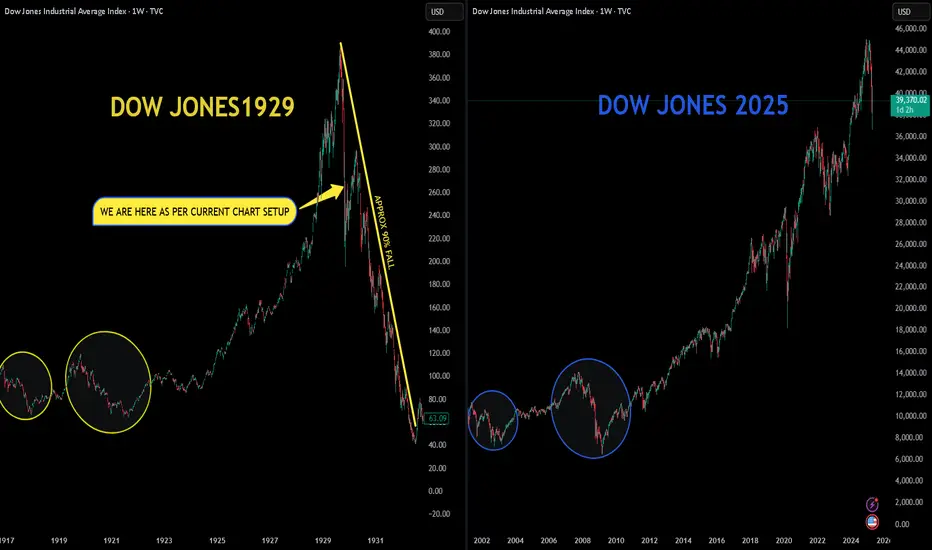
The 1929 Trade Tariff Vs The 2025 Trade Tariff (DOW JONES)Charts are self explanatory.
This is a simple comparison of the 1929 Dow Jones with the 2025 Dow Jones. As you can observe, there are many similarities.
Big Question: Can the Dow Jones again experience a 90% correction, similar to the one between 1929 and 1932 ?
NOTE: This is just an observation/correlation.
Disclaimer: This is for demonstration and educational purpose only. This is not buying or selling recommendations. Please consult your financial advisor before taking any trade.
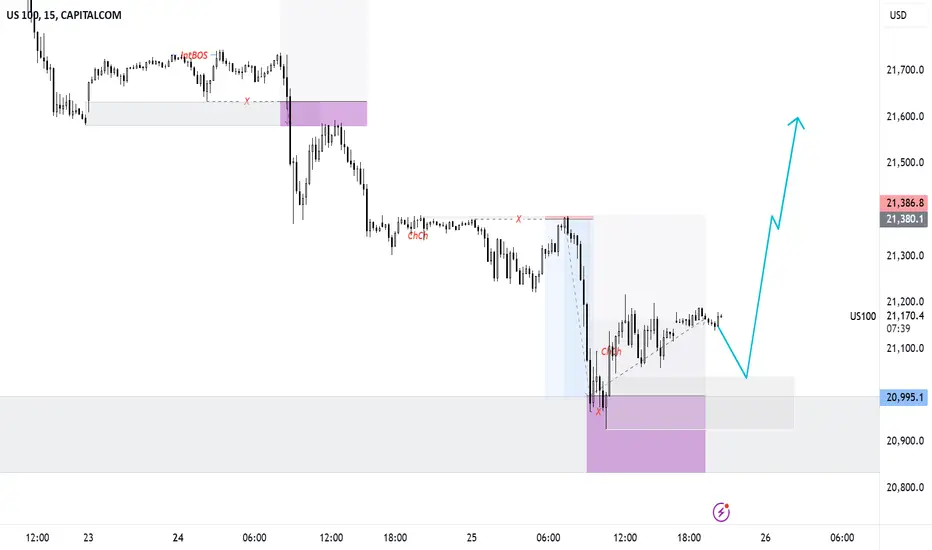
US100 View for feb last weekUS100 is reversing from the demand zone and waiting for the confirmation to enter buy side.
Here is the view for educational purposes
Buy zone is marked between 20926.5 - 21040.8. It will be the high probability area. So, wait for the confirmation before entry.
Trade with 1:3 RR and it might touch all time high again. Trade accordingly.
It might be weak below the marked zone.
Trade after the confirmation.
Nifty buy!!!!!!See the charts,
Price is going for 50% RETRACEMENT,so if you want to take a quick trade, look for the fvg to buy.
If you don't want means just wait for price to reach some key areas, to take shorts.
Capital is important so plan wisely, don't lose it with fomo.
Learn to trade by yourself is better.

Trading indicators Trading indicators are mathematical formulas that give you a way to plot information on a price chart. This information can be used to identify possible signals, trends, and shifts in momentum. In simple terms, trading indicators can highlight when something might be happening.
Learn how to understand the concept of a stock trading indicator, how it affects your trading results and how to use to your benefit during day trading!
Volume Weighted Average Price (VWAP) ...
Bollinger Bands Trading Indicator. ...
Moving Average Convergence Divergence (MACD) ...
Fibonacci Trading Indicator. ...
Pivot Points.

SMC Trading with Professionals In conclusion, Smart Money Concepts (SMC) provides traders with a strategic framework that focuses on understanding the actions and motives of market makers, particularly institutions such as banks and hedge funds.
It compares favourably to other strategies, such as swing trading and scalping, although each are much more appropriate in a short term timeframe. If you are looking for the latest and greatest strategy traders are raving about, then SMC might be a great fit for you.

Journey of Advanced Divergence TradingCommon types of trading are intraday, positional, swing, long-term trading, scalping, and momentum trading. Trading involves exchanging goods or services. In stock trading, investors buy and sell stocks from companies within regulated markets overseen by Indian regulatory bodies.
Master these skills and then you'll get a genuine shot at being a trading master.
Skills #1 and #2 – Research and Analysis. ...
Skill #3 – Adapting Your Market Analysis to Changing Market Conditions. ...
Skill #4 – Staying in the Game. ...
Skills #5 and #6 – Discipline and Patience. ...
Bonus Skill #7 – Record Keeping. ...
In the End.

Bearish trend in Nifty(Weekly) (In Hindi)NSE:NIFTY On Indices analysis, we are looking at some of the top Indices at the weekly level. It is clearly visible that Nifty is on the bearish side and holding at key support. The next key support could be 23,500. Last week's bearish candle somewhat engulfed the previous bullish candle, confirming the downtrend.
The rest of the other Indices are also looking at a downward trend with a few exceptions like IT, Pharma & Metal, which have made a double top pattern for a trend reversal.

Option Data Trading– Option Chain Analysis can be used to find out the actual trend of the particular stock or index. Usually institutions and big funds sell options. By finding out which strike has more open interest, we can actually understand the support and resistance levels of a security (be it stocks or indices) for that expiry.
How to do option analysis? Option analysis involves studying various parameters like strike prices, premiums, implied volatility, open interest, and time decay. Combining this data with technical and fundamental analysis helps assess potential trade setups and risks.

GRANULES INDIA LTDBuy above 595
All important points are marked.
𝐃𝐢𝐬𝐜𝐥𝐚𝐢𝐦𝐞𝐫: 𝐈𝐧𝐯𝐞𝐬𝐭𝐦𝐞𝐧𝐭 𝐢𝐧 𝐬𝐞𝐜𝐮𝐫𝐢𝐭𝐢𝐞𝐬 𝐦𝐚𝐫𝐤𝐞𝐭 𝐚𝐫𝐞 𝐬𝐮𝐛𝐣𝐞𝐜𝐭 𝐭𝐨 𝐦𝐚𝐫𝐤𝐞𝐭 𝐫𝐢𝐬𝐤𝐬, 𝐫𝐞𝐚𝐝 𝐚𝐥𝐥 𝐭𝐡𝐞 𝐫𝐞𝐥𝐚𝐭𝐞𝐝 𝐝𝐨𝐜𝐮𝐦𝐞𝐧𝐭𝐬 𝐜𝐚𝐫𝐞𝐟𝐮𝐥𝐥𝐲 𝐛𝐞𝐟𝐨𝐫𝐞 𝐢𝐧𝐯𝐞𝐬𝐭𝐢𝐧𝐠. 𝐒𝐭𝐨𝐜𝐤𝐬 𝐬𝐮𝐠𝐠𝐞𝐬𝐭𝐞𝐝 𝐢𝐧 𝐭𝐡𝐢𝐬 𝐠𝐫𝐨𝐮𝐩 𝐚𝐫𝐞 𝐟𝐨𝐫 𝐞𝐝𝐮𝐜𝐚𝐭𝐢𝐨𝐧 𝐩𝐮𝐫𝐩𝐨𝐬𝐞. 𝐖𝐞 𝐝𝐨𝐧𝐭 𝐦𝐚𝐤𝐞 𝐚𝐧𝐲 𝐩𝐫𝐨𝐟𝐢𝐭𝐬 𝐟𝐫𝐨𝐦 𝐭𝐡𝐢𝐬 𝐫𝐞𝐜𝐨𝐦𝐦𝐞𝐧𝐝𝐚𝐭𝐢𝐨𝐧𝐬 𝐞𝐯𝐞𝐫𝐲𝐭𝐡𝐢𝐧𝐠 𝐬𝐡𝐚𝐫𝐞𝐝 𝐡𝐞𝐫𝐞 𝐚𝐫𝐞 𝐜𝐨𝐦𝐩𝐥𝐞𝐭𝐞𝐥𝐲 𝐨𝐟 𝐟𝐫𝐞𝐞 𝐨𝐟 𝐜𝐨𝐬𝐭.

Why had Hong Kong's Stock Market Index Rallied recently? (HK50)2nd October 2024 / 11:15 AM IST
One Question arise whatever situation is arising internationally let's keep it aside ❗
What Technically has happened in Index HK50 that's what I have discussed in here.
30 % in Three Week Time Period
Everything is pinned in Chart ‼️‼️👍

Histogram(MACD) Divergence Trading Let us discuss the MACD indicator strategy and histogram. I know being a chartist you are familiar with this tool.
Hence I hope this will be a revision for you. Assuming you already know this topic, you should know that MACD Histogram is derived from MACD.
To me, it is the effect of MACD (cause), without which MACD Histogram would not have been born. I hope you can relate it to the previous paragraph. If not, no problem. Carry on reading.
But before proceeding further I would request you to recapitulate MACD (moving average convergence divergence). Thanks for converging your thoughts with that of mine. I am glad. It will help me to explain this article without taking the additional burden.
MACD Histogram Peak-Trough Divergence
By now you must have understood how the histogram dances to the tunes of prices. If one looks at it closely then one can easily identify the divergences.
You will notice that a peak and trough divergence is formed with two peaks or two troughs in the MACD Histogram.
Usually, it can be segregated into two parts, i.e. bullish peak and trough divergence and bearish peak and trough divergence.
Alright, I will explain you in short.
Bullish Peak-Trough Divergence
It is formed when MACD makes a lower low and on the contrary, MACD-Histogram makes a higher low. One thing you should keep in mind, i.e., well-defined troughs define the health of a bullish peak-trough divergence.
bullish peak trough divergence
Bearish Peak-Trough Divergence
It is formed when MACD makes a higher high and on the contrary MACD Histogram makes a lower high.
One thing you should keep in mind, i.e., well-defined peaks define the health of a bearish peak-trough divergence.

Nikkei 225 projectionAs per the analysis, Nikkei 225 is projected to reach a 40000 upside target this month.
Bullish view invalidates below 37740, pushing prices down until 36300 and 34100 in due course.

NIFTY FALL TO 21500❗❗❗❗There is a high chance for nifty to reach 21780 and 21550.
If today big fall means it will reach these prices.
Orelse it will reach on next week.
Learn to analyse by yourself is better for you.

A GOOD FALL SHOWING ON JP225ITS A SURESHOOT
IRS MY PERSONAL STRATEGY
Its showing a good falling
Having a good potential
There is nothing to doubt
It have a great surety of FALL
Due to these reason
1.It have clear-cut neckline without any confusing chat
2. It have clear entry and Tp point
3. Sellers seems heavy due to volume

EURUSD 15M ANALYSISFOREXCOM:EURUSD
Hello traders , here is the full multi time frame analysis for this pair, let me know in the comment section below if you have any questions, the entry will be taken only if all rules of the strategies will be satisfied. wait for more Smart Money to develop before taking any position . I suggest you keep this pair on your watchlist and see if the rules of your strategy are satisfied...
Keep trading
Hustle hard
Markets can be Unpredictable, research before trading.
Disclaimer: This trade idea is based on Smart money concept and is for informational purposes only. Trading involves risks; seek professional advice before making any financial decisions. Informational only!!!!

NIFTY 50 NSE Date - 29th Feb. 2024
After seeing Chart, it seems like sellers are more aggressive than buyers because it fails to sustain resistance level and also 23rds gap up also not sustain. but still for safer side I suggest wait for retest for Buy side specially.
and on smaller Timeframe should find short opportunity for next 2 to 3 trading days.
Thank you!

NIFTY50 - Levels Marked Out - 22nd February #indicesNIFTY50 Update - 22nd Feb, 2024
- Lots of Volatility
- Levels marked out to get an understanding of the movement
- Keeping the Risk Management in Play till a clear indication of reversal forms out
- Don't overthink the trades, but instead flow with the trend of the market
#nifty50 #indices

Nas100 Short TradeNasdaq has been Diverging on the Daily MACD since January 26th. Momentum is finally signaling towards the down side. Failing to make Higher Highs on the 4 Hour Time Frame, rejecting perfectly off of the upper Trend Line. Confirming that there is a Trend Change coming. Stop Loss placed above the Trend Line at 18092.26.
