INDIGO – Calm Under Pressure | Demand Zone Commands Respect💹 InterGlobe Aviation Ltd (NSE: INDIGO)
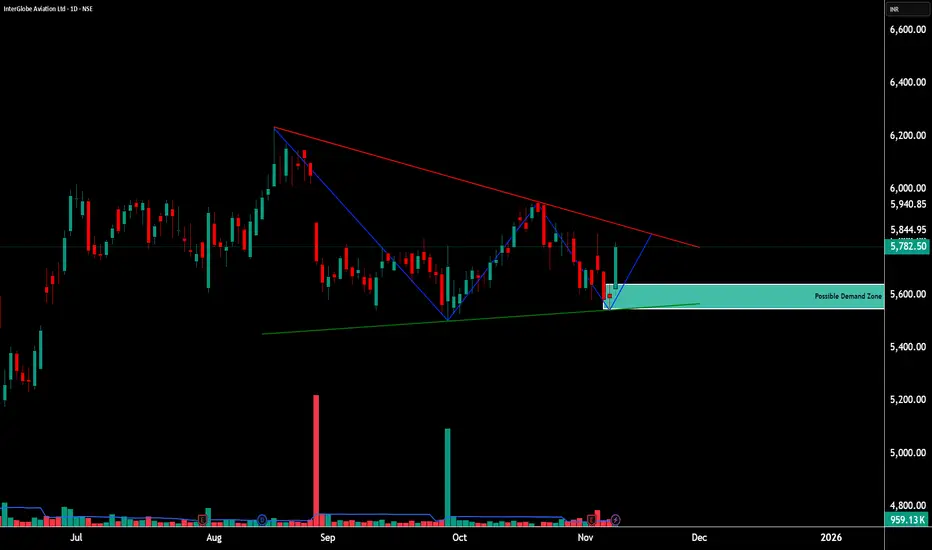
Sector: Aviation & Transport Services | CMP: ₹5,782.50 | View: Descending Structure + Demand Zone Reaction
________________________________________
📊 Price Action
InterGlobe Aviation continues to move within a descending structure, maintaining a controlled series of lower highs under the falling red trendline.
Each time the stock has dipped, it has found support around the ₹5,450–₹5,650 demand zone, a region that has consistently attracted buying interest.
The latest daily candle shows renewed strength emerging from this zone, supported by a clear rise in volume — indicating that the market continues to respect this level.
On the daily chart, IndiGo has formed a descending triangle, and at the far end of this structure lies a well-defined demand zone, suggesting that the stock may be preparing for a possible directional move in the near future.
________________________________________
🧭 Support & Resistance
Support 1: ₹5,663 | Support 2: ₹5,523 | Support 3: ₹5,450
Resistance 1: ₹5,855 | Resistance 2: ₹5,928 | Resistance 3: ₹6,058
Price continues to oscillate between a firm demand base and a declining resistance line, reflecting ongoing compression before expansion.
________________________________________
🧠 STWP Technical Note
The internal readings indicate a balanced phase — neither overly bullish nor weak.
Volume behaviour remains steady near the base, with improving momentum signatures.
Several key internal parameters have begun aligning positively, but the setup still awaits broader confirmation. ________________________________________
🎯 Final Outlook
IndiGo currently stands at a critical juncture — price is testing the limits of its descending structure while buyers continue to defend the lower band.
Momentum is beginning to build, and volume expansion near the base reinforces confidence in the demand zone.
As long as price respects ₹5,600 and holds above the demand base, the chart maintains a neutral-to-positive bias, with scope for a gradual shift toward the upper range of the pattern.
________________________________________
⚠️ Disclosure & Disclaimer – Please Read Carefully
This post is created purely for educational and informational purposes and does not constitute investment advice or a buy/sell recommendation.
I am not a SEBI-registered investment adviser. All observations are based on technical studies and publicly available information.
Trading and investing involve risk; please manage position size and stop-loss discipline as per your risk profile.
Always consult a SEBI-registered financial advisor before making trading decisions.
________________________________________
Position Status: No active position in (INDIGO) at the time of analysis.
Data Source: TradingView & NSE India
💬 Found this useful?
🔼 Boost this post if you value clean, structured analysis.
💭 Drop your views — can Torrent Pharma sustain this breakout above ₹3,835?
🔁 Share this with traders who track institutional breakouts.
👉 Follow for more price-action based institutional setups.
🚀 Stay Calm. Stay Clean. Trade With Patience.
Trade Smart | Learn Zones | Be Self-Reliant 📊
________________________________________
Indigoanalysis
INDIGO chart pattern analysisNSE:INDIGO
best entry zone 430 - 450
and stop loss 4280- 4200
target - open
Disclaimer: This analysis is for educational purposes only.
Please assess your own risk tolerance and conslut with a financial advisor before trading.

INTERGLOBE AVIATION-UP FOR SWING TRADEInterGlobe Aviation: CMP:4469; RSI: 69.62
As per Elliot wave analysis, Inter Globe Aviation has completed primary wave-4 formation @ 3780 and motive wave-5 is in its initial phase of expansion. Confirmation of the same will be evident when script give close above 4885 levels on closing basis. A swing trade is poised in the near future with a upside of 15-20%.
Call For Aggressive traders
Buy Zone: 4400-4500
Stop Loss: 4300
Resistance Zone: 4772-4885
Target 1: 5125; Target 2: 5400
Call For long term Investor
Buy above: 4900
Target: 6400 (1 year time frame)
Stop Loss: 4300

No more ruling the skies of the aviation sector!! - INDIGOInterglobal Aviation (INDIGO) has shown several bearish patterns recently, indicating potential downward trends in its stock performance.
Weekly : Bearish Engulfing Candlestick Pattern.
Daily : Three Outside Down with very weak volume
Each candlestick pattern confirms a bearish trend, suggesting a short trade. Additionally, global factors are expected to impact the aviation sector.
Entry: 4425
Stop Loss: 4740
Target: Open/Mentioned.
Let me know if you found this interesting.
Happy trading! 😄

INDIGO - Ready to Fly AgainDate : 24-Dec-2024
LTP : Rs. 4,612.25
Targets: (T1) Rs. 4,788 --> (T2) Rs. 5,035 --> (T3) Rs. 5,780
SL : Rs. 4,193
Technical View:
• NSE:INDIGO is in strong primary uptrend and was recently going through secondary downtrend within primary uptrend.
• After touching a high of 5,035 on 12-Sep-2024, NSE:INDIGO has retraced 24% to 3,830 level.
• NSE:INDIGO has given breakout from it's secondary downtrend with higher than average volume on 24-Dec-2024.
• NSE:INDIGO is trading above 20 DEMA and 50 DEMA since last few sessions. 20 DEMA has also crossed over 50 DEMA.
• RSI is trading at 69.15 and MACD is trading at 58.13.
• Ready to fly again. Fasten your seat belt.
Liked the analysis? Boost/Like this idea and follow my ID for more ideas.
Disclaimer: I am not a SEBI registered analyst/consultant and not recommending anyone to take any BUY or SELL position in stock market. Investing in stock market is risky and one should do a self analysis and validation before investing in stock market. My ideas are published for learning purpose only and are available to everyone at no cost/charge.

INDIGO - Fall PossibleAfter good uptrend past few weeks, stock may be reaching an exhaustion point
4520 - 4580 excellent resistance area
If stock takes a pause here, there is a high possibility of bears taking over again
If happens so, it will be easy for the stock to reach its 1st potential target of 4160
Any close above 4600 will negate the view

Volatility Contraction Pattern | Indigo Paints✅The Volatility Contraction Pattern (VCP) is a price pattern that indicates a potential breakout.
✅How it works:- A stock's price volatility contracts before a significant price movement, which can result in explosive upward momentum.
💡 Indigo Paints Overview
1️⃣Short-Term Outlook
👉Caution Advised: Current indicators suggest short-term caution for investors .
👉Diwali Impact: Potential boost during the festive season as paint stocks typically gain interest
👉Sector Sentiment: Positive investor sentiment in the paint sector may support demand .
2️⃣Recent Performance
👉Stock High: Reached a 52-week high of ₹1,649.1 on October 21, 2024 .
👉Earnings Report: Strong revenue growth, but EPS missed analyst expectations .
👉Insider Activity: Recent share sales by executives raise concerns .
👉Market Position: Stock increased by 5.28%, outperforming the sector .
3️⃣Long-Term Investment Analysis
⭕️Positive Factors:⭕️
Revenue Growth: Increased 18.47% YoY, indicating strong sales
EPS Improvement: Up 12.59% YoY, showing profitability growth
✅Concerns:
✍️Market Underperformance: Stock returned 16.2% over the past year, below the Sensex's 21.4%
✍️ROCE Decline: Latest ROCE at 23.65%, suggesting potential efficiency issues
📌 Conclusion
Indigo Paints has growth potential due to revenue and EPS increases, but investors should remain cautious about market performance and ROCE trends.
✅Check out my TradingView profile to see how we analyze charts and execute trades.
🙋♀️🙋♂️If you have any questions about this stock, feel free to reach out to me.
📍📌Thank you for exploring our idea! We hope you found it valuable.
🙏FLLOW for more !
👍LIKE if useful !
✍️COMMENT Below your view !

Indigo Paints cmp 1654.15 by Weekly Chart since listed*Indigo Paints cmp 1654.15 by Weekly Chart since listed*
- Resistance Zone 1640 to 1680 soon to be Support Zone subject to Breakout made
- Weekly basis Support at 1501 > 1351 > 1174 with Resistance at 1770 > 1905 > 2050
- Back to Back repeat Bullish Rounding Bottoms with the current Resistance Zone and soon to act as Support Zone
- Traded Volumes are needed to sustain Breakout attempt over the Resistance Zone soon to be acting as Support Zone
- Price sustaining well above Falling Resistance Trendline and attempting Breakout above Resistance Zone soon to be Support Zone

Indigo - ConsolidatingStock after long bull run is in a consolidation zone
Preparing for a breakout or breakdown move
Keep in radar

INDIGOIndigo Going to Break Major Hurdle After Soo Long Time with Great Volumes, But Have to wait for reconfirmation about retesting or Breakout - Consolidation - Continuation

long tradeusingharmonic method
buy trigger for target range 2600-50
stop as per comfort
supportive indicator used for this buy entry are
ichimoku, rsi
disclaimer - trade @ own risk

Indigo The Perfect ShortIndigo : Perfect Short
Selling Zone - 1922/1940/1968
SL - 2037 ( Day Closing Basis )
Target - 1600

Indigo 2600 CE or Swing, three daysIndigo : 2600 CE Buy or Equity for swing Buy. Target 2742. SL 2561. CMP: 2617 (Buy only after price crossing above 2645, you may place limit order) Holding period max 3 days after entry. Educational purpose only.

Indigo paint to take longLong indigo paint. Stock trading above 50 EMA on every move. RSI also forms positive divergences. All levels have been marked on the charts. This is for your educational purpose only.

INDIGO LOOKS WEAK | SELL AROUND 2390Indigo looking weak, Sell around 2390 with SL above 2500 for the marked targets on the chart.
To motivate us, Please like the idea If you agree with the analysis.
Happy Trading!
InvestPro India Team

INDIGO IMPORTANT WAVE SUPPORTIF PRICE SUSTAIN ABOVE THIS TRENDLINE THEN INDIGO GO TO UP SIDE MOMENT .
always follow proper risk reward trades

Possible H&S pattern formation in Indigo - daily chartLooking at the price action of Indigo chart on the daily time frame, there is a possibility of Head and Shoulder pattern being formed. This is just an analysis looking at the price trend. The pattern is yet to appear on the charts.
Call it my obsession with H&S pattern, I see it everywhere. These days, even before it is formed. Let's see what the future has in store...

Indigo ConsolidatingExpecting a massive breakout in Indigo Aviation in hourly time frame
Target 2000

INDIGO AT CRUCIAL RESISTANCE ZONE1) the zone is very crucial in short term
2) as price reaches to these zone the volume starts to pick up
3) crude prices are stable
4) I am slightly bullish but concerned over the rising covid cases in the globe.

Indigo 14.2.22INDIGO : LONG 14.2.22
Analysis :
1. Price : HH/HL, near ATH
2. Pattern : W
3. Volume : rising
4. Momentum : GFS
5. Volatility : 15m squeeze opening
6. Trend : bullish (Price and RSI)
7. Trend Strength : +DI / rising
8. Time analysis : nearing full moon 16.2.22 (crossing ATH possible)
Trade Setup : (1HR Chart, Intraday)
CMP : 2265
Entry : 2285
Stop : 2244 (ma)
Points : 41
Target : 2380
Points : 95
RR (P/L) : 95:41 = 2.3:1
Max Loss : 9000
Possible investment scenarios :
CASH :
Number of shares : 220
Investment : 502700
Max Profit : 20,900
Max Loss : 9020
FUTURES : (1Lot only)
Number of shares : 250
Investment : 1,42,000
Max Profit : 23,750
Max Loss : 10,250
Pyramiding (Futures) : Convert to BTST trade from Intraday
In futures you can take 3 lots if you have 5L capital.
1st lot : 2285, SL = 2244
2nd lot : once SL is above 2285
3rd lot : once SL(MA) crosses SL of 2nd lot
Trail SL if prices crosses final target of 2380, this is All Time High

NSE:INDIGO FnO Today's Top Gainer 2NSE:INDIGO
#NSE:INDIGO Today's FnO Top gainer 2
All the details shared, check my profile for complete details.
Top gainer 3 also shared.

Long INDIGO...High Probability SetupINDIGO
Cmp - 2005
Stop - 1950
Expectation -
T1 - 2080
T2 - 2350, Review at 2350
Expected Holding Period - 3 months or earlier for T1, 5 months or earlier for T2
View:- Swing/Investment

IS INDIGO GOING TO BREAK THE SUPPORT TREND LINE?Indigo has already taken support multiple times from this line and it was acting as a strong acceptance zone.
If Indigo breaks the support and starts trading below 1770 we may see marked lower targets on the chart.
In case it takes support again upper marked targets can be seen in coming trading sessions.
To motivate me, Please like the idea If you agree with the analysis.
Happy Trading!
InvestPro India Team
