Indus Towers Ltd – Breakout Trade IdeaIndus Towers has given a breakout from a downward sloping trendline , indicating a possible trend reversal. The move is supported by increasing Put writing and Call unwinding at the 400 strike , showing strong support and bullish sentiment in the options data.
The stock is also backed by good quarterly results , adding strength to the price action.
Trade Setup
Buy: ₹408 (Current Market Price)
Target: ₹450
Stop Loss: ₹390 (Closing basis)
View: Bullish above ₹400
Risk–Reward: Favorable
Industowerstrendanalysis

INDUS TOWER : LongChart Type: Weekly (each candle = 1 week)
Indicators: 20 EMA + RSI (Relative Strength Index)
Pattern Highlighted: Bullish Engulfing near support
Volume: Rising on the bullish candle
Price Action Zone: From ₹320–₹460 range
Support Zone: Around ₹320–₹330
This zone acted as a base multiple times — buyers consistently defended it. A strong bullish engulfing pattern formed at the support, followed by a high-volume breakout above the 20 EMA.
This pattern often signals reversal from downtrend to uptrend.
Price has reclaimed the 20 EMA after several weeks below it — a short-term bullish sign. RSI rebounded from near 40 levels and is now rising toward 60 — confirms improving momentum.
Resistance Levels:
First resistance: ₹430–₹435
Second resistance / target zone: ₹460
🟩 Trading Plan
Entry: Aggressive entry: Near ₹395–₹400 (current level after bullish confirmation).
Conservative entry: On a retest of ₹370–₹380 (if price pulls back to 20 EMA).
Confirm entry on a weekly close above ₹400 with sustained volume.
Stop Loss (SL):
Place SL below ₹340 (below bullish engulfing low and support zone).
Risk per trade ≈ ₹60 (400–340).
Take Profit (Targets):
Target 1: ₹430 → Partial profit booking zone (~8% gain).
Target 2: ₹460 → Previous swing high / full target (~15% gain).
Extended target (if momentum strong): ₹500+ (psychological level).
Risk–Reward Ratio:
Entry ₹395–₹400
Stop Loss ₹340
Target 1 ₹430 → 1:0.6
Target 2 ₹460 → 1:1.3
Good setup for swing trade with clear technical confluence.

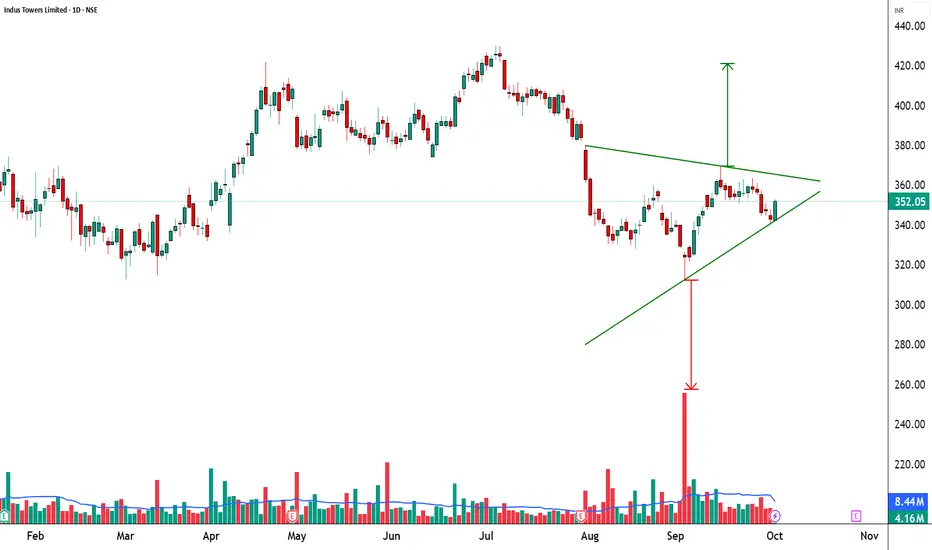
INDUSTOWER - Symmetrical Triangle Breakout Watch🚀 Indus Towers Ltd (NSE: INDUSTOWER) | Symmetrical Triangle Breakout Watch
________________________________________
🏢 Company Overview
Indus Towers Ltd is one of India’s largest telecom tower companies, providing critical passive infrastructure for the country’s telecom operators. The stock recently stabilized after a sharp fall and is now moving into a consolidation pattern that could signal the next big move.
________________________________________
📊 Current Market Snapshot
CMP: ₹352.05
Sector: Telecom Infrastructure
Pattern Observed: 🔺 Symmetrical Triangle
Candlestick Signal: Strong Bullish Candle on support
Strength Rating: ⭐⭐⭐ (Neutral → Bullish Watch)
________________________________________
📈 Price Action & Chart Pattern
The stock is trading inside a symmetrical triangle, formed by higher lows and lower highs. Today’s session shows a strong bounce from the support trendline, hinting at potential momentum buildup.
Support Trendline: ₹340 – ₹342
Resistance Trendline: ₹360 – ₹365
Breakout Zone: Above ₹360 with strong volume
Breakdown Zone: Below ₹340 may trigger fresh weakness
🔍 Why Important? Symmetrical triangles usually lead to explosive breakouts once price exits the structure with volume confirmation.
________________________________________
🔎 Technical Indicators
RSI (14): 50.35 → Neutral, ready for directional expansion.
EMA Support: Price reclaiming short-term EMAs, showing recovery signs.
Volume: Current rally backed by above-average volumes; a 1.5x spike would confirm strength.
The stock shows multiple bullish signals – Bullish Marubozu + Engulfing candle, strong buyer dominance with open = low, and alignment above VWAP suggesting institutional support. A BB squeeze indicates breakout potential, but traders should stay alert for a fake breakdown/liquidity sweep before the real move.
________________________________________
📍 Key Levels to Watch
Immediate Support: ₹340 – ₹342
Immediate Resistance: ₹360 – ₹365
Upside Target (if breakout): ₹390 – ₹400
Downside Target (if breakdown): ₹320 – ₹310
________________________________________
🔮 Bullish & Bearish Scenarios
✅ Bullish Case: A decisive close above ₹360 with heavy volume could trigger a sharp rally towards ₹390+.
⚠️ Bearish Case: Failure to cross ₹360 and a slip below ₹340 could drag the stock back to ₹320 or lower.
________________________________________
📝 STWP Trade Analysis
Entry: ₹352.05
Stop-loss: ₹340.45 (just below trendline)
Risk: 11.60 points
Strength: ⚡ Average but improving with momentum
Demand Zone: ₹350.85 – ₹340.90 | SL: 340.45
📌 Note: Risk-Reward is attractive if played with discipline & volume confirmation.
________________________________________
🎯 Final Outlook
Indus Towers is at a make-or-break stage. Traders should watch the ₹360 breakout level closely. A confirmed breakout can trigger a quick upward move, while failure may resume the prior downtrend. Patience and volume confirmation are key before committing to bigger trades.
________________________________________
💡 Learning Note: Symmetrical triangles often serve as launchpads for trend continuation. Combining price action + volume + risk management helps traders filter false signals and ride genuine breakouts effectively.
________________________________________
⚠️ Disclosure & Disclaimer – Please Read Carefully
The information shared here is meant purely for learning and awareness. It is not a buy or sell recommendation and should not be taken as investment advice. I am not a SEBI-registered investment adviser, and all views expressed are based on personal study, chart patterns, and publicly available market data.
Trading—whether in stocks or options—carries risk. Markets can move unexpectedly, and losses can sometimes exceed the money you have invested. Past performance or past setups do not guarantee future results.
If you are a beginner, treat this as a guide to understand how the market works and practice on paper trades before risking real money. If you are experienced, always assess your own risk, position sizing, and strategy suitability before entering trades.
Consult a SEBI-registered financial adviser before making any real trading decision. By engaging with this content, you acknowledge full responsibility for your trades and investments.
💬 Found this useful?
🔼 Give this post a Boost to help more traders discover clean, structured learning.
✍️ Drop your thoughts, questions, or setups in the comments — let’s grow together!
🔁 Share with fellow traders and beginners to spread awareness.
👉 “If you liked this breakdown, follow for more clean, structured setups with discipline at the core.”
🚀 Stay Calm. Stay Clean. Trade With Patience.
Trade Smart | Learn Zones | Be Self-Reliant 📊
IndusTower Long - Forming Pattern & Entering into consolidationIndusTower - After the decent Breakout Forming Pattern & Entering into consolidation. Its Best buy at Bottom with Stoploss.
Righttime to enter before Breakout.
Do your own analysis before Entering into any trade. NSE:INDUSTOWER
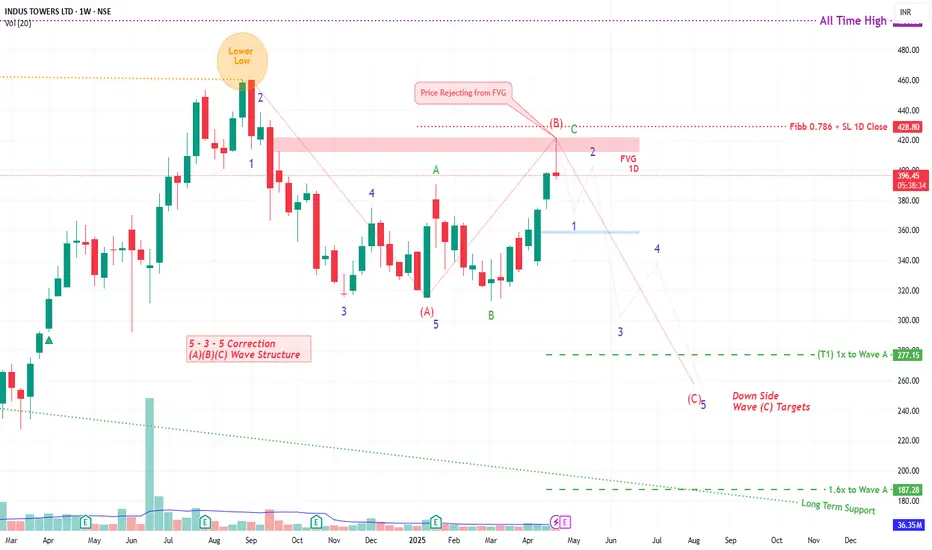
INDUS TOWER By KRS Charts25th April 2025 / 9:40 AM
Why INDUSTOWER??
1. Stock was reached its near ATH level but not able to hold the levels in Sep 2024 . From this point to today it seems like bullishness is getting weaker.
2. Wave Theory is saying Correction Wave ABC is ongoing and C is likely Started .
3. In support of more Correction from here FVG is visible in 1D TF and price are rejected from that level too.
4. Expecting correction from here in 5 Wave Structure towards downside.
Expected Targets and SL are mentioned in Chart
Note: This is Medium to Long Term View
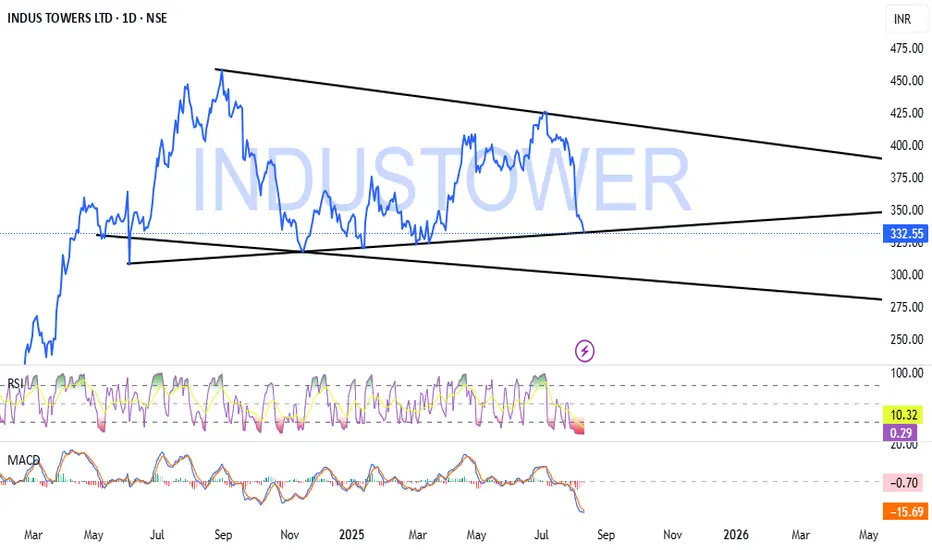
short term trading opportunity in Indus Tower for > 15% upsideHi,
NSE:INDUSTOWER has given a Bullish Flag Breakout on Weekly charts with very good volume.
MACD is also on the bullish side on Weekly time frames. RSI is also on the bullish side on daily, weekly and monthly time frames.
In the current market scenario, I am expecting that the bullish momentum will continue.
Complete price projection like entry, stop loss and targets mentioned on the charts for educational purpose.
Don't Forget to Follow me to get all the updates.
Please share your feedback or any queries on the study.
Disclaimer: Please consult your financial advisor before making any investment decision.

INDUS TOWER LOOKING BULLISHINDUS TOWER LOOKING BULLISH, THERE IS MULTI YEAR TREND LINE BREAK AND FORMATION OF HH AND HL FORMED, IN SHORT TERM IT MAY REACH AROUND 340 THEN 450 LEVELS.
HH = Higher High
HL = Higher Low
LH = Lower High
LL = Lower Low
This is for educational purpose only, do your own analysis before investing and try not to invest more than 5% of your capital.

Indus Towers Flag and Pole Pattern Breakout Above 365Details:Asset: Indus Towers Limited (INDUSTOWER)Breakout Level: Above 365Potential Target: Significant upside momentum expectedStop Loss: Below breakout level or as per risk toleranceTimeframe: Short to medium-termRationale: Indus Towers Limited (INDUSTOWER) has broken out from a flag and pole pattern, and is now sustaining above the 365 level. This breakout suggests a potential bullish sentiment shift, paving the way for a significant upmove.Market Analysis:Technical Breakout: The breakout from the flag and pole pattern and sustaining above 365 indicates strong bullish momentum, likely attracting more buyers.Market Sentiment: Positive market sentiment or company-specific catalysts may be supporting the breakout and the potential for further price appreciation.Potential Target:The potential upside target is not specified but is expected to be significant given the nature of the flag and pole pattern breakout.Risk Management:Implementing a stop loss strategy below the breakout level is essential to manage risk in case of unexpected price reversals.Timeframe:The projected move for INDUSTOWER is based on a short to medium-term outlook, but actual timing may vary based on market dynamics.Risk-Reward Ratio: Consider individual risk tolerance and adjust position size accordingly to maintain a favorable risk-reward ratio.As with any investment opportunity, conduct thorough analysis and consider factors such as market trends, company fundamentals, and risk management strategies before making trading decisions.

BREAKOUT STOCK Weekly & Daily Indus tower and Godrejprop
Industower weekly brekaout & Godrej Prop Daily Breakout.
This weekly both stock are strong breakout stock.
Note - Only for edcation purpose

6 Years Trend Line Broken In Indus Tower6 Years Trend Line Broken
Cmp - 265.7
Buy At Cmp & On Dips
SL - 166 ( Weekly Closing Basis )
Target - 500/800

Indus Towers Analysis(Double Bottom)!!INDUS TOWERS WEEKLY ANALYSIS
Indus Towers has made double bottom at Support Level on Weekly Timeframe
Indus Towers is trading near it's 82 Week resistance trendline
Keep an eye on Indus Towers
Indus towers is trading at it's crucial levels. We can see the price is taking resistance at 82 Weeks resistance Trendline. Now Indus Towers made has Double Bottom Patter at it's support level. If Indus Towers succeeds to break 82 Week trendline then we can see the further bull move towards our projected Target. I did all my analysis on the chart. Please do study it thoroughly, do your all the analysis, explore all the trading platforms, Compare the analysis because no one is 100% accurate but we will have a broader view of trend if we do study all the analysis and explore all the available platforms.
Trading Psychology and Setup=
Entry = Aggressive Entry after Resistance Trendline Breakout, Conservative entry after candle closes above 174.65 after retest
Target = Projected Target will be 234.35
Stop Loss = Below 165.15
Disclaimer = All my analysis are for Educational Purpose only. Before entering into any trade - 1) Educate Yourself 2) Do your own research and analysis 3) Define your Risk to Reward ratio 4)Don't trade with full capital
