KEI – Bullish Continuation Setup with Breakout Potential________________________________________________________________________________
🚀 KEI – Bullish Continuation Setup with Breakout Potential
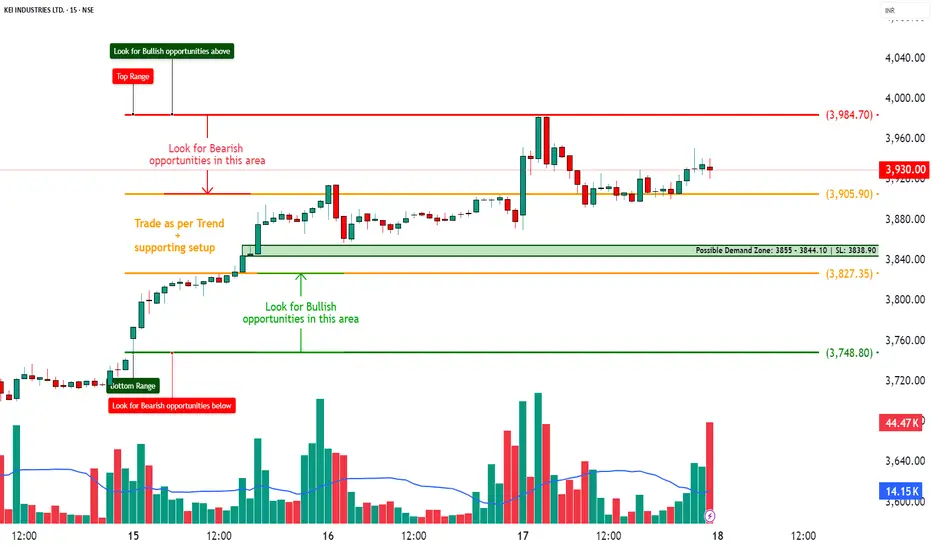
📅 Setup Date: 18.07.2025 | ⏱ Timeframe: Daily
📍 Strategy: Defined-Risk Bullish Spread (Short-Term Swing with OI Confirmation)
________________________________________________________________________________
🔍 Overview
Overall Bias: Bullish with supportive Put buildup
Spot Price: ₹3933.3
Trend: Sustained uptrend with OI buildup on CE/PE sides
Volatility (IV): 40–42%, stable with light compression
Ideal Strategy Mix: Defined-risk bullish strategy like vertical call spread
________________________________________________________________________________
1️⃣ Bullish Trade (Naked options as per trend)
Best CE: Buy 3900 CE @ ₹145.05
Why:
• Highest OI among CEs (7.05L) with strong Long Buildup
• Good volume and premium correction (▼16.32%) = cheaper entry
• Spot just above strike → early breakout zone
• Stable IV (40.34) gives clean delta tracking
________________________________________________________________________________
2️⃣ Bearish Trade (Naked options as per trend)
Best PE: Sell 3850 PE @ ₹82.65
Why:
• Long Buildup (OI ↑10.3%) on PE shows bullish support
• Strike sits just below spot → safety buffer
• IV stable and theta erosion beneficial
• Rich premium for selling with bullish bias intact
________________________________________________________________________________
⚙️ 3️⃣ Strategy Trade (As per trend + OI data)
Strategy: Bull Call Spread → Buy 3900 CE / Sell 4100 CE
Net Debit: ₹145.05 - ₹62.35 = ₹82.70
Max Profit: ₹200 - ₹82.70 = ₹117.30
Max Loss: ₹82.70
Risk:Reward ≈ 1 : 1.42 ✅ Within range
Lot Size: 175
Total Risk: ₹14,472.50
Max Profit: ₹20,527.50
Breakeven Point: ₹3982.70
Reversal Exit Level: Exit if Spot < ₹3879.32 (bullish spread invalidation below support)
________________________________________________________________________________
Why:
• Strong Long Buildup on 3900 CE and 4100 PE creates clean structure
• Risk:Reward = 1:1.42 fits strategy filters
• IV cooling supports call spread entry
• Breakout continuation likely with defined risk
________________________________________________________________________________
📘 My Trading Setup Rules
Avoid Gap Plays
→ Check pre-open price action to avoid trades influenced by gap-ups/gap-downs.
Breakout Entry Only
→ Enter trades only if price breaks previous day’s High (for bullish trades) or Low (for bearish trades).
Watch Volume for Confirmation
→ Monitor volume closely. No volume = No trade.
Enter on Strong Candle + Volume
→ Execute the trade only if a strong candle appears with increasing volume in the direction of the trade.
Defined Risk:Reward Only
→ Take trades only if R:R is favorable (ideally ≥ 1:2).(Safe R:R – 1:1)
Premium Disclaimer
→ Option premiums shown are based on EOD prices — real-time premiums may vary during execution.
Time Frame Preference
→ Trade with your preferred time frame — this strategy works across intraday or positional setups.
________________________________________________________________________________
⚠ Disclaimer (Please Read):
• These Trades are shared for educational purposes only and is not investment advice.
• I am not a SEBI-registered advisor.
• The information provided here is based on personal market observation.
• No buy/sell recommendations are being made.
• Please do your own research or consult a registered financial advisor before making any trading decisions.
• Trading involves risk. Always use proper risk management.
I am not responsible for trading decisions based on this post.
________________________________________________________________________________
💬 Found this helpful?
Drop your thoughts or questions in the comments below ⬇️
🔁 Share this post with your trading community – let them benefit from clean charts, structured setups, and zone-based learning.
✅ Follow simpletradewithpatience for charts, clean setups, and educational content based on price action, zones, and risk-managed trades.
🚀 Trade with patience, trust your charts, and stay clear-headed!
Be Self-Reliant | Trade with Patience | Learn with Charts & Zones 📊________________________________________________________________________________
Industries
KEI: an Amazing Swing Trade Pick!KEI Industries: Powering Up with Strong Trends 🚀
Fueling your trading journey! ⚡📈
Snapshot:
KEI Industries Limited, a key player in power cable manufacturing, is making waves. Serving both retail and institutional sectors, their influence is undeniable.
Technical Breakout:
A double bottom pattern breakout in the daily time frame has caught our attention. This pattern can signal a potential bullish surge ahead.
Stay tuned as we keep an eye on KEI Industries for potential trading opportunities! 📊👀
(Note: This is not financial advice. Always conduct your analysis before making trading decisions.)
#TradingView #StockAnalysis #KEIIndustries #TradeSmart


KEI Industries : Upside Trend
Good day,
Hello Traders,
KEI Industries looking bullish and strong on weekly basis as it can head towards upside in the upcoming Q1 and Q2.
Time Frame: Weekly
It also depends how market behaves.
Chart Self Explanatory.
Disclaimer: I am not SEBI registered analyst; this is for educational purposes.
Please trade as per your risk and do consult with your financial advisor before taking any
trading decisions.
If you really like the analysis, please do comments, LIKE and Follow me.

KEI Industries: Todays Stock Another beautiful Chart of Indian Stock Market, KEI Industries is too eager to cross its 52 Weeks high of 1730.95 and set a new all-time high. On 1 Hour Time Frame, it has already broken the resistance at 1678, with price action after breaking the TREND LINE at 1645. The entry level is 1685 with SL of 1673 and the chart is all set to make a new all-time high while facing resistance at levels 1705 and 1726.
Please Boost my analysis, if I am able to make charts understand, in an easy and interesting way.
Good Luck

Getting Ready with excellent accumulation?Good acccumulation!
Good structure if it breaks on the upside with volume.
Trade only after breakout.

BULLISH on KEI INDUSTRIESNSE:KEI
The price has given the breakout from the Triangle pattern. The prices are trading above the moving averages which shows bullishness. The MACD is also bullish. The RSI is above 50 which shows good momentum. This view is for 1 to 6 months. The Target and SL is given in the charts. The stock is outperforming the NIFTY for 1 year.
Disclaimer : This is my own view and analysis. This is only for educational purposes. This is not a recommendation, call or a tip.

KEI - Ichimoku Bullish Breakout Stock Name - Kei Industries Limited
Ichimoku Cloud Setup :
1). Today's close is above the Conversion Line
2). Future Kumo is Turning Bullish
3). Chikou span is slanting upwards
All these parameters are showing bullishness at Current Market Price
and more bullishness AFTER crossing 1607
#This is not Buy and Sell recommendation to any one. This is for education purpose and a helping hand to learn trading in Market.
# Cloud Trading
# Ichimoku Cloud
# Ichimoku Followers
I hope you all like my analysis.
Please do share your thoughts into comment section.
Please give a like, it motivates me to do analysis.


reliance industriestraingle formation wait for breakout or breakdown
more chance to reversal from here due to
ressistance becomes support zone

Kei Industries-Ascending Channel Pattern Breakout. Kei Industries-Ascending Channel Pattern Breakout Daily Time Frame. Entry Zone-1450/1470 Expect a Target-1700/1750 on This Stock. Stop Loss-1345 Closing Basis. Only Education Purpose.

KEI - Ichimoku Bullish Breakout Stock Name - Kei Industries Limited
Ichimoku Cloud Setup :
1). Today's close is above the Conversion Line
2). Future Kumo is Turning Bullish
3). Chikou span is slanting upwards
All these parameters are showing bullishness at Current Market Price
and more bullishness AFTER crossing 1483
#This is not Buy and Sell recommendation to any one. This is for education purpose and a helping hand to learn trading in Market.
# Cloud Trading
# Ichimoku Cloud
# Ichimoku Followers
I hope you all like my analysis.
Please do share your thoughts into comment section.
Please give a like, it motivates me to do analysis.


KEI INDUSTRIES - Short term BullishKEI INDUSTRIES - Short-term Bullish
1. It forms a double bottom pattern.
2. If it crosses 1200 the double bottom pattern confirms and the target will be 1285.
Note:
1. I’m not a SEBI Registered advisor, my research is personal and for educational purposes only.
2. Always check with your financial advisor and take the trade as per your risk/reward ratio.
3. Follow me for more patterns and like, and share so that we feel it is helpful to many and share more patterns...

reliance industries support- 2442.35
target- 2617.45
next target near supply zone
breakout after long consolidation

reliance industriesmarubozu candle or big bullish candle formation
on support line
follow same support and trend line

reliance industries take support from previous support line and also green candle formation.
70% chance to move upward and 30% chance to move downtrend.
i think price should cross the 200 ema first w should make buy postion.

Reliance industries Due to negative news price has fallen very much which is unexpected.
And as I discussed in previous chart I also give the support and bounce back exact from same level.
But this bounce back is for short term.

reliance industriestrend line support break in previous session.
big and clearly m formation in d1 time frame.
ready to touch next near support
rsi and macd also in negative trend
wait for reversal confirmation then invest.
Note: This is not for trading purpose, i only provide for swing and investment purpose.

KEI Industries - Short term BullishKEI Industries - Short term Bullish
Formed double bottom... target will be 1385-95,
If it breaks 1400 it will be more bullish.
Educational purpose...


KEI FOR SWINGMakkale focus KEI for swing. And kindly don't forget that the market is still on sell on rise, so take trades cautiously with proper risk reward and money management.

ALOK INDUSTRIES -- POSITIONAL -- MARCH 2022ALOK INDUSTRIES -- positional pick on march 2022 ..
1> stock taken support on Daily Chart consecutive 4th time ..on chart seen up 4th up arrow around 21-22 is strong support area from where stock bounce back last 2 sessions.
2> RSI seen double bottom formation at support area
3> Potential upside is 20.30% FROM CMP@23.85 TARGET 27-30-32 with stop loss 20 Risk reward ratio is very good from this level
4> Good volume seen at support level
BUY ALOK INDUSTRIES @ 23.85
TARGET 27-30-32
STOP LOSS 20
** THIS IDEA IS FOR EDUCATIONAL PURPOSE ** TRADE AT OWN RISK !!
** Historical data seen fear is best opportunity to get highest return in stock market .!!
HAPPY TRADING. !!
