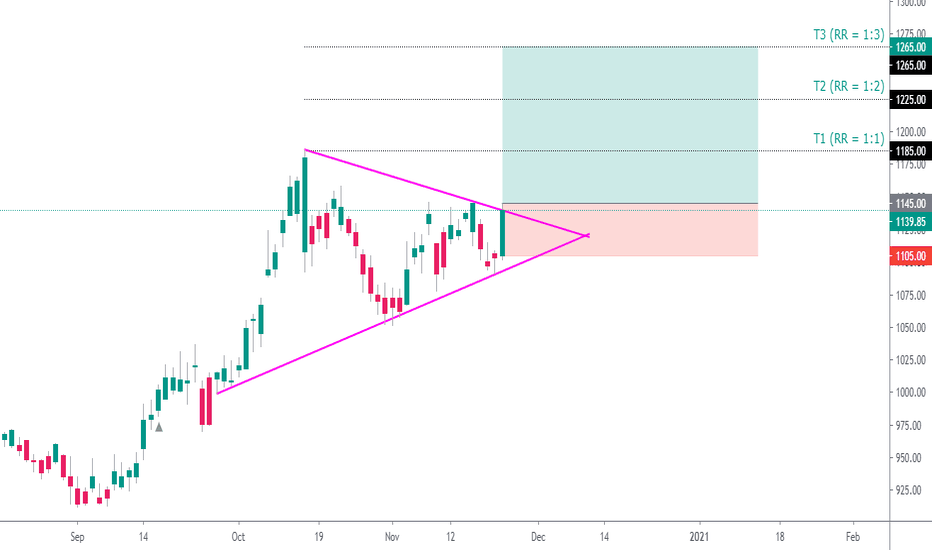
INFOSYS - Ascending channel resistance breakout at monthly TF INFOSYS LTD - Ascending channel resistance breakout at monthly time frame
Always trade what you see, never trade what you feel. Make this a habit, you won't be requiring any seminar, webinar, or mentor, you will be self-sufficient.
Disclaimer : All charts are purely for educational and information purpose only. Invest or Trade at your own risk.
Infosys
INFOSYS (INFY) - SELLERS BECOMING WEAKNSE:INFY
AFTER A LONG RALLY ,PRICE STARTED TO CONSOLIDATE FROM MID OF OCTOBER
FORMED A TRIANGLE PATTERN,WITH STRONG SELLERS INITIALLY
PRICE DID NOT BREAK BELOW REF. POINT A, ALSO IT FORMED KIND OF HIGHER LOW FORMATION,INDICATING SELLERS ARE BECOMING WEAK
PRICE HAS TESTED RESISTANCE LEVEL 1148-1150 FOUR TIMES.
NEW RALLY MIGHT START ONCE PRICE BREAKS ABOVE RESISTANCE LEVEL WITH RELATIVELY HIGH VOLUME
INFOSYS(Swing / Positional Trade) | RR 1:3+ | Type:- Breakout
Reasons To Trade 🤔 :- NIFTY IT(Main Index) + Stock's Triangle Pattern Breakout , Bullish Sector , Uptrend Stock , Above 200DMA.
Entry :- 1145 (Look For Clear Entry)
Stop Loss :- 1105
Targets :- 1stT. = 1185 , 2ndT. = 1225 , 3rdT. = 1265
(Risk Must Be Managed.)
Keep Your Eyes On Index
😜Follow For More ✔
Give Me A Thumbs Up...👍
--Any Suggestions--
INFOSYS: ALGO BUY SIGNALHOW TO FOLLOW ALGO SIGNAL:
Deciding buy/sell
1.Strictly use only on 1 hour time frame.
2.Wait for a ‘X’ sign before mind make up. A red ‘X’ means look for selling opportunity , a green ‘X’ means look for buying opportunity.
Taking a position:
3.Wait for an arrow before entering into any position. A red arrow on upside of a bar pointing downward means open short position. A green arrow below the bar pointing upward means open buy position.
4.NOTE: Only after the the signalling of X , look for arrow. Do not buy/sell if you see any arrow before the signal of X.
5.STOP LOSS should be the most recent swing high/low or most recent STRONG CANDLE’S high/low.
While maintaining the position :
6.The small triangles after the each bar completion tells you to hold the position. The red triangles appearing upside on the bar tells you to hold the short position, whereas the green triangles appearing below the bars tells you to hold the long position.
Exiting the position:
7.After you create a buy position , if you see a green arrow above any bar pointing downward, then you should either book partially/leave the position for sometime. You will get another signal to re-enter.
8.Similarly, after you create a sell position , if you see a red arrow below any bar pointing upward, then you should either book partially/leave the position for sometime. You will get another signal to re-enter.
9.While being in position if you see any X signal which is opposite of your trade , then leave your position immediately.
10.When you see a big red circle dot then you must exit all your short positions. Contrary , when you see a big green circle dot , you must exit all your long positions. And then wait for a X-signal.
No Trading Zone:
11.When you get frequent X-signals in green-red-green-red & that too very close, then its means that stock is going to form a range. One should wait for the range break & move away to another stock. (THIS IS WHERE YOU WILL REQUIRE A PRACTICE TO IDENTIFY THE RANGE)
Wave Count for INFYToday, TCS gave a breakout after years of consolidation, will the things are looking positive for the IT industry ( As per some Management commentary)
I have counted Waves for INFY on the daily chart. I think we are in 5 wave & INFY can rally from here. There is a breakout on the chart, thus you should keep your stop loss tight.
Probably this 1070 should be our next target.
915 should act as strong support.
I have also shown the RS indicator (Benchmarked to Nifty IT)
Infy elliotwave analysis, ready to create new high?DISCLAIMER:There is no guarantee of profits or no exceptions from losses.
Technical analysis provided on the chart is solely the personal views of my research.
You are advised to rely on your own judgments while investing/Trading decisions.
Past performance is not an indicator of future returns. Investment is subject to market risks.
Seek help of your financial advisors before investing/trading.
I may or may not trade this analysis.
-------(((((LIKE & Donate Coins to support my analysis)))))-------
On small time frame of 15 min plotted impulse wave from swing low.
Currently in Wave 4 triangle correction and looks ready for breakout with green Marubozu formed in 2nd last candle.
Targets any of these 1031-1037(in case of wave 5 truncation), 1050
case 1: Weakness in global markets can invite for gap fill 1006 and good support at 1004 which is entry opportunity with 997 SL.
Case 2: Gap up opening and sustainance above 1027 will confirm bullish bias
Case 3: Gap down and violation of 997 this becomes analysis will be invalid


