INFRATEL
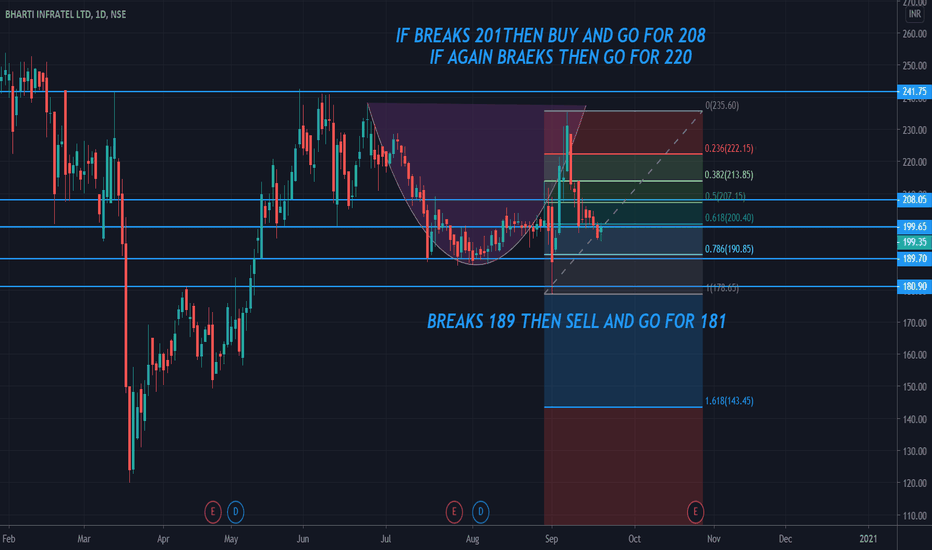
BHARTI INFRATEL CHART ANALYSISTHIS CHART GIVES YOU KNOWLEDGE ABOUT BHARTI INFRATEL CHART ANALYSIS WITH SUPPORT AND RESISTANCE
Infratel looks weak, It can be shorted.Infratel
Intraday
The stock looks weak below 200.
Short below 199
Target - 197, 195
Stop Loss - 201
Note - Market are looking bullish tomorrow, So becareful while shoring. Go with trailling SL.
INFRATEL is Making Descending Triangle Pattern (Breakout Trade)Bharti Infratel Limited ( NSE:INFRATEL ) is Making Descending Triangle Pattern (PATTERN BREAKOUT TRADE).
This can become a very good trade for INTRADAY traders.
Target + StopLoss: There is no target here. You keep the first target as much as the StopLoss you put. And the StopLoss will be the Low/High of the candle that broke this pattern. Or Low/High swing backward inside the pattern.
And as soon as you get a profit of 0.50% of your target, you will trail your StopLoss and bring it to the entry point. And as soon as your first target is hit, you will release half of your total quantity and continue to trail your StopLoss above the last swing Low/High.
Target and StopLoss are never already fixed in the chart pattern.
Thank you.
You always have to trade only by money management, position sizing, StopLoss trailing. This is the way to stay in profit.
Chart Published By Ravinder Sharma
Infratel - Triangle bullish breakoutNote: This is for educational purpose only
There is a bullish breakout with ultra high volume. Moreover, RSI above 60 indicates bullish momentum.
Ascending triangle - price at supportPrice forming Ascending Triangle pattern in weekly time frame, those who love swing trading can enter long with stop loss below the trend line/ previous low. Look for the resistance at the top running all over for years.
Follow the trend and make some good returnsINFRATEL BUY @196 TARGET@220 and SL@186...
consult your advisor before taking a trade, this is only for educational purpose
INFRATEL - DESCENDING TRIANGLEINFRATEL - DESCENDING TRIANGLE
Beware : Please keep in mind and stay away from False Breakout Traps.
Also this is not any recommendation, it is only for educational purpose.
Trade at your own risk.
infratel descending triangleinfratel forming a descending triang which forms a base with a rejecting candle followed by breakout can give a nice up move.
21ST JULY INFRATEL TRADE SETUP, TRIANGLE PATTERNTrade with the drawn support and resistance levels and place your targets and stop loss accordingly.
LONG INFRATEL LONG TREND ANALYSIS & TRADE SETUPTREND ANALYSIS & TRADE SETUP
Follow Chart Instruction.
Do not be Hurry for entry.
Wait for Proper Entry Setup.
Buy/Sell with Best Risk Reward.
Educational Chart Only.
INFRATEL forms Double top chart pattern, Can expect downside!!Double Top Chart Pattern. CMP 190
Enjoy learning nd earning!!
Infratel Intraday 28/6/2020Infratel at support if broken could be a good Short setup for tomorrow. Wait till support range of 218 to 220 broken.
Infratel trading at support levelThe stock is trading at a support level and the stochastic oscillator suggests an upward move. One could buy at current levels and look for a target above 220.
INFRATEL stock configuration:The stock has already taken its support, and now trading near the support there is a price rotation, sellers and buyers both are active this the stock is not able to decide its route.
thus if the stock cross 211.46 it can move up-to 215.70 and still further up move.
Strong support level 206.65, if the price cross this level the stock will be bearish.


