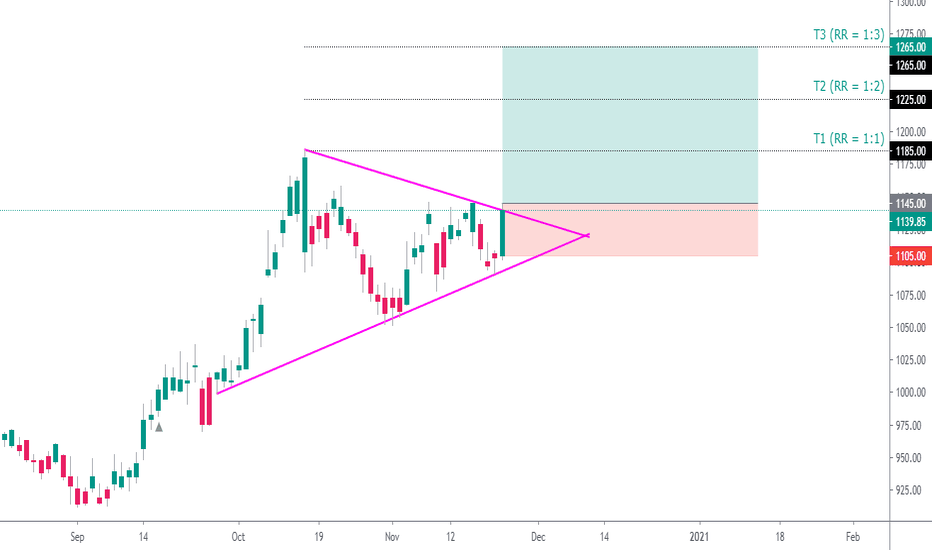
INFY TRIANGLE 1HRINFY is rangebound and forming a traingle pattern in 1hr timeframe. Breakout on either side will result in good momentum. It has been a choppy market for INFY and there are high chances of a breakout on bullish side. You can enter the trade in 15min timeframe as soon as the price crosses high of breakout candle with SL on previous swing low. It can be a postional trade and you can trail your SL alongwith price movement to get maximum profit out of the trade instead of planning a potential target.
INFY
INFOSYS(Swing / Positional Trade) | RR 1:3+ | Type:- Breakout
Reasons To Trade 🤔 :- NIFTY IT(Main Index) + Stock's Triangle Pattern Breakout , Bullish Sector , Uptrend Stock , Above 200DMA.
Entry :- 1145 (Look For Clear Entry)
Stop Loss :- 1105
Targets :- 1stT. = 1185 , 2ndT. = 1225 , 3rdT. = 1265
(Risk Must Be Managed.)
Keep Your Eyes On Index
😜Follow For More ✔
Give Me A Thumbs Up...👍
--Any Suggestions--
Infy : looking good for long above 1145A good move was seen in all IT packs in last session.
Infy is about to give symmetric triangle Breakout.
Good buy above 1145 for the first target of recent swing high 1186
Wsl 1100
Keep trailing your SL if stock comes in your direction
Note : This idea is only for educational purpose
Infosys BullishInverse H&S patter formed in daily chart of INFY and trend reversal seems to have started considering the hammer with small upper wick on 20th Nov 2020. Al though I would have been certain about the trend reversal if the hammer was a green candle, yet it is nor harm keeping a eye on INFY. Breakout above trend line with good volume can continue the uptrend. 0.5 Fibonacci retracement value coincides with the head of pattern and the stock has taken support from there and risen
Please share your views also
INFY Short I hope you can now see how Infy represents an excellent low risk profit entry setup allowing you to trade in the market.Take positions so that the risk/reward is in your favor.
Knowing why, where & when a strong reversal signal is being generated will be the only way to capitalize on your technical analysis .
Disclaimer: It should not be assumed that the methods, techniques, or indicators presented in these chart will be profitable or that they will not result in losses. There is no assurance that the strategies and methods presented will be successful for you. Past results are not necessarily indicative of future results. You should not trade with money that you cannot afford to lose. Examples presented in these products are for educational purposes only and it should not be assumed that these are indicative of ordinary trades. These setups are not solicitations of any order to buy or sell. The publisher assume no responsibility for your trading results. There is a high degree of risk in trading.
Leave a comment that is helpful or encouraging. Let's master the markets together
INFY: Looks bullish | Price Action BasedThe stock seems to be in a general uptrend. My view is bullish/Long.
On 4H time frame
- the stock is forming a triangle pattern.
- It's taking support on its 50EMA.
Most likely to give a breakout on the upper side.
- First Target: 1160
- Second Target: 1185
If the stock breaks the lower side of the triangle, could be a good short(looks unlikely to me)
- First Target: 1074
- Second Target: 1052
I am a beginner in the stock market and any valuable insights into my analysis will be appreciated :)
Infy continues to take support at an important trendlineInfy has taken very good support at the shown trendline (white line drawn).
One interesting point is that the stock has bounced with good volumes from the trendline on the 3 occasions that it was tested.
Next time it falls at towards the trendline and rebounces, it would offer a good opportunity to go long.
Please like and follow. Also, have a look at my other ideas. NSE:INFY
INFY forming a flag patternWhat are the requirements for a flag pattern?
1. There should be a sharp move before the formation.
2. The volumes should contract during the flag formation
What is the outcome of the flag pattern?
1. Continuation of the previous trend, which in this case is upside
2. Infy should be bought now.


