Late night Technical analysis talk - TCS, HCL, INFY👑 Terms used if you don't know :
✣ Contraction pattern: A pattern starting with a broadening high candlestick and low candlestick and converging to a fixed point, these highs and lows created in between them are bulls vs bears fight going on inside the pattern and if it comes to the lower part of it, surely bulls will take it to the topmost point and vice-versa until one of them wins
✣ Structure and trend: Two types of trends that exist in the market today are uptrends and downtrends. Each type of trend tells a different story and has its own impact on a trader's success in the market. While uptrends show a series of higher highs and higher lows, downtrends show lower highs and lower lows
✣Breakout: Breakouts are commonly associated with ranges or other chart patterns, including triangles( HERE WE WILL SEE THIS ONE ), flags, wedges , and head-and-shoulders. These patterns are formed when the price moves in a specific way which results in well-defined support and/or resistance levels. Traders then watch these levels for breakouts
✣ RSI DIVERGENCE: A bullish divergence occurs when the RSI creates an oversold reading followed by a higher low that matches correspondingly lower lows in the price. This indicates rising bullish momentum, and a break above oversold territory could be used to trigger a new long position.
✣ Supply/ Demand: In the supply zone , the prices are higher than the bid price, and in the demand zone , they are lower. The bid price is what a trader is willing to pay for a stock
👑 Important levels - explained well
👑 Comment your thoughts and queries regarding anything on this analysis of mine, feel free buddy :)
⌛ Motivational and psychological area ⌛
✣Trade only if you are in the right mindset, if you have been emotionally weak for some time, take your time and don't trade, trade with a happy and + mindset only.
✣If you want to make money, firstly be prepared to lose it, only that much which you can afford and that much by which you can make a mistake again, learn from them and grow
✣Don't lose hope and keep grinding
✣I have seen my friends on youtube streaming games with watching 10, constantly they streamed for a year or two and now they are buzzing with 1k to 2k watching daily.
✣Focus on the process, you are here to make money not stupid decisions and lose it all
✣No one will help you climb the mountain, few will tell the path, so follow good people, make good mentors and make good decisions and choices in the stock market.
✣Believe in yourself :)
🎓🎓 Some info about me :)
➼My name is Apoorv and I am a 2nd year Engineering student, I want to pursue trading as my career, and thus whatsoever setups or trades I potentially see on my charting platform, I post it here and share them with you all.
➼I hope you will love my simple analysis style.
➼Feel free to suggest your view on this as learning is earning here :)
➼I take my trades on my Zerodha account :)
➼I don't take all the trades I post
➼These charts are my and only my work, my thought process, just from an educational point of view and no calls.
Infyanalysis


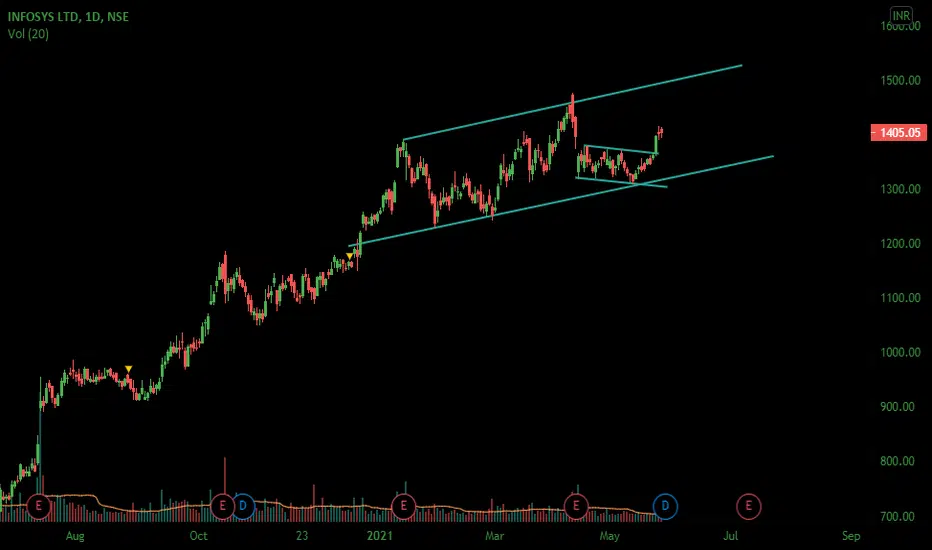
Infosys - Ready to smashInfosys is ready to smash the IT sector as it seems so bullish and now retesting the trend line, so give an entry with appropriate Stop loss
🔴DISCLAIMER
***** It's just for an educational purpose and so you must also follow your own technical analysis before taking up the trade ******
Aggressive traders enter at the breakout and conservative traders may give entry after retracement (Retracement is optional, we cannot expect every stock to take a retest after the breakout, it may also continue to have its bullish pressure after the breakout)
After reaching our targets, trail your stop loss to get maximum profit from the stock in a single trade

INFOSYS, Symmetrical Triangle PatternINFOSYS, always move like its sectoral index.
In very good symmetrical triangle pattern.
Enter on buy side it close above trendline near 1395.

Infy levels for 02/06/2021 and juneNSE:INFY
Major trend is upside
stock started correcting from 9th april onwards.
failed to make LH LL in bigger time frame.(hint for trend change)
1370-1378 is the previous swing high. that level was breached and rallied then it was facing pullback from 27th May onwards.
Currently, the stock faced buying pressure from the confluence of supports.
bottom channel line support of the pullback move.
support of the uptrend line marked.
previous swing high range support.
200ema of 15min.
consolidated in the rectangle range for 2-3 hours and faced buying pressure with good volume.
bullish marubozu engulfing candle in 1hr time frame.
1hr stockastics moving upwards from oversold region.
Major trend is upside.
NiftyIT is also creating a flag and pole pattern.
This is a high probable trade for me. I will be looking to hold as long as possible with SL at 1368.
Can be watched for intraday in the coming days.

Infosys from 29 may 2021The stock is in tight range both side movement possible ... range 1380 - 1420
The upside has a target of 1450
infy can be bought if come down to 1350 ( good support zone )
simple option strategy
sell 1300PE + buy 1240PE with breakeven below 1310 --> very safe strategy
... around 50K premium used get around 2k ---> monthly roi of 4-5% good enough

INFY Analysis- Correction StartsINFY
Sell- Below 1310
SL - 1330
Target- 1280 1260 1220
Go through the chart for more details. I would suggest to avoid buying this stock . If stock corrects to 1200-1220 then will thing to buy in the dip. Till then I will short from the above levels.
Always use alerts for trading.
Note:- I am not SEBI registered . All Views and trade setups are my personal view and my personal trade setup.
Do follow us
Like Us
Share with fellow traders
Also check the below related ideas for other stocks.

INFY best setups to buyINFY have daily demand zone at price range 1284-1259 and good support level at 1230. Both levels will be good zone to buy stock.
According to market movement and sustainability of INFY stock we can buy near these zone for further see a good upside movement.

Infosys Sideways trend capture #Ep1 #LetsMakeMoneyTogetherA good and bullish candle . i.e, prefer a pinbar or an engulfer on 1330 lvls . will establish a buy for the IT giant INFY .... As trend is suggesting .... buy low and sell high in this sideways mkt of infy . For positional purpose : Hold on 1380 lvls to see if it breaks it, educational note : it might note break it in one go but might consolidate there with a pattern .... things will be updated here as per :)
Also if it directly goes and breaks 1380 lvls which is highly unlikely scenario, but if happens go long instantly it might make better money than the sideways trend :)

INFYinfy currently forming channel structure and also announced 4th quarter result so take your position carefully.

INFY ON HOURLY CHARTINFY on hourly chart is sustain above 200 EMA indicating that stock is still in uptrend. Also observing closely we saw that 200 EMA and Fibonacci 61.8% acted as a very strong support for the stocks. Now talking about oscillator, MACD is giving a really good Divergence between price and momentum. Macd divergence with reversal from levels with good volume is indicating that we can look for long setup. Intraday targets are given on chart. Trade at your own risk. Play safe. Strongly maintain your stoploss .

INFY TRADE IDEA | 5/3/21All the reasons for the trade have been mentioned in the image.
----Happy Trading

Infosys - Cup and Handle PatternNote: This is for educational purpose only. Please do not trade in F&O based on this analysis.
There seems to be a cup & handle formation with RSI just crossing 60. Nifty IT is outperforming Nifty Index today as well. Price above 1400₹ should see more upside.
SL: 1315₹

Is Infy going to test 1250 odd levels?The stock seems to form the double top pattern and it may test 1250 levels soon. If it breaks it we would see a further bounce.
To motivate me, Please like the idea If you agree with the analysis.
Happy Trading!
InvestPro India Team

Beginner's analysis. Hey Traders,
Infy made butterfly bearish Harmonic pattern.
We an expect correction here.
Have an eye.
Keep supporting and guide me if there's any mistake or improvement needs to be done.

INFOSYS GAME OVER ???Shooting Star On Monthly Time Frame.
Best Selling Zone 1330-1340, Strict SL - 1400 (Monthly Closing Basis)
If Infosys Breaks & Close Above 1400 Level On Weekly Time Frame In 1st Or 2nd Week Of This Month Than Maintain SL On Weekly Closing Basis.
If Infosys Breaks & Close Above 1400 Level On Weekly Time Frame In 3rd Week Of This Month Than Maintain SL On Monthly Closing Basis.
Target - 10-20-30%

Infosys Ltd- Hourly Time frame- Things may go South before NorthInfy is a "Short" in the smaller i.e. Hourly/15m timeframes and undoubtedly a "Long" in higher TFs.
It seems to have completed (or about to complete) an Impulse 5 move up which is a part of wave 1 of one larger degree which is in-turn a part of wave 3 of the largest degree, if you understand what this means. (Since strangely Trading View doesn't allow you to post 2 charts together, unless you are a premium subscriber, I am unable to post the higher TF charts. You could message me, should you need a copy of the same to be emailed)
Cheers !!
Note : This view would be invalidated if the price crosses 1330 (61.8% ret) with force.

Descending Triangle Pattern in InfosysDescending Triangle Formation has seen in Infosys : Setup looks Bearish, wait for Triangle to broke.


Infysos Short Trade For 15-02-2021 Infysos Trade For 15-02-2021
Trendline And S/R Breakout On 15 Min Chart
For educational Purposes Use Only
Im Not SEBI Registerd

infy view - expected moves given till support is sustainedkeep eyes / stop below support 1254-59 and look for expected upmove given in chart above
reference chart below
