Infosys (INFY): ₹1,636 – The spring coiling for the punch!?NSE: INFY | Timeframe: Daily
Key Technical Observations:
Classic Cup & Handle Formation:
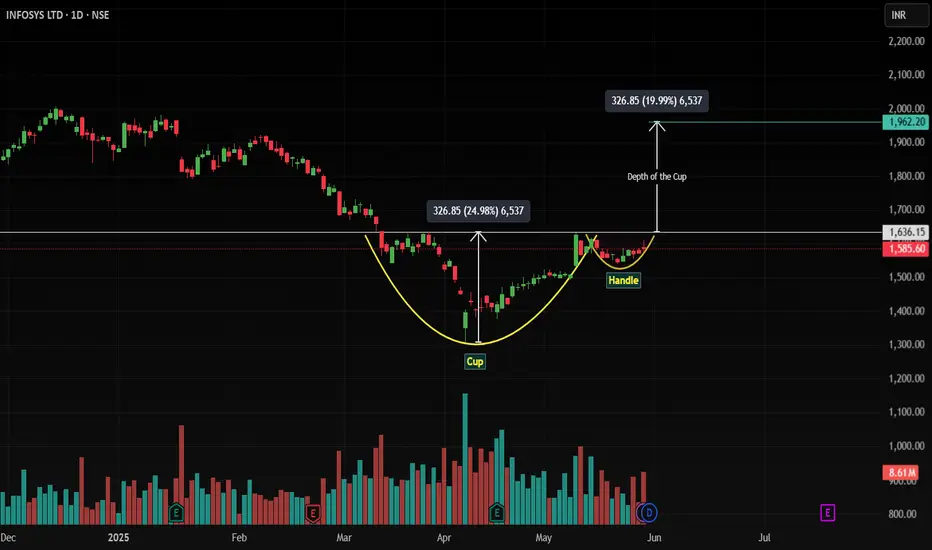
INFY has carved a textbook bullish Cup & Handle pattern on the daily chart, with the "handle" now consolidating tightly near the ₹1,636 resistance.
Price is gathering power for a punchy breakout – reducing volatility and compression signal imminent momentum.
Breakout Trigger at Resistance:
The handle’s consolidation at ₹1,636 shows sellers exhausting, with consistent support from the 50-day EMA.
Watch for a daily close above ₹1,636 to confirm bullish momentum ignition.
Volume-Powered Setup:
Potential surge in volume on breakout would validate the "power gathering" phase.
Trade Strategy:
Entry: Daily close above ₹1,636 (Breakout Confirmation).
Stop Loss: ₹1,530 (below handle low).
Target: ₹1,960 (Measured Move: Cup Depth Projection).
Risk-Reward: 1:3.5 (High-Probability Setup).
Why Trade This?
Pattern Strength: Cup & Handle is a high-probability continuation pattern – especially with 50-EMA confluence.
Sector Alignment: IT index resilience supports INFY’s breakout potential.
Clear Catalyst: Breakout above ₹1,636 opens path for explosive move toward ₹1,960.
DISCLAIMER:
This analysis is for educational purposes only. Not financial advice. Trading involves substantial risk. Past performance doesn’t guarantee future results. Always conduct your own research, consider risk management, and consult a SEBI-registered advisor before trading. Pattern success rates vary based on market conditions.
Infytrend
INFOSYS - POSITIONAL TRADE WITH VERY GOOD R:RSymbol - INFY
INFY is currently trading at 1942 & approaching ATH resistance zone.
I'm seeing a trading opportunity on sell side.
Shorting INFY Futures at CMP 1942
I will be adding more position if 1980 comes & will hold with SL 2025
Targets I'm expecting are 1780 - 1700 - 1580
P.S. : INFY is approaching ATH resistance zone after a long time. ATH resistances are usually hard to break in one go. To break this resistance, INFY must spend some time here (2-3 weeks) before breaking out. Only then we will see more price growth towards the upside. As of know, given modestly high valuations of INFY & overall market, The setup looks more towards negative side & It is highly likely that the price will take resistance from here & change its course to south. I've shorted far month futures already.
Disclaimer - Do not consider this as a buy/sell recommendation. I'm sharing my analysis & my trading position. You can track it for educational purposes. Thanks!

INFY | LOOKS GOOD FOR 1500 - 1510Buy Infy around 1440 - 1450 for the targets of 1500 - 1510 until 1400 is intact on the downside.
To motivate us, Please like the idea If you agree with the analysis.
Happy Trading!
InvestPro India

Long swing trade in infyLong swing trade in infy
Entry above 1513 daily closing basis
SL 1475 daily closing basis
Please refer the image for targets
have a profitable trade everyone.... :)

Infosys Ltd : Target !!!Infosys Ltd : Long Term Target !!!
What are you looking for?
It will go 1900 ?

Infy Short term BuyStrong weekly Close, and Strong Higher high confirms the Short term Uptrend, good to buy cmp and on dips.
Higher ROI and Low risk to higher reward

INFY: Descending Channel and Flag BreakoutINFY is showing *early* signs of breaking out of a weekly flag pattern and descending channel. Keep on watch. This coincides with the CNXIT parallel channel breakout pointed in earlier idea . RSI is high, though volume change is not significant. Big gap resistance ahead.

INFY FOR BREAKOUT AFTER CONSOLIDATIONInfy on Daily TF made long legged Doji/Hammer after gap down
Consolidated in same range for last 13 days
In 1 hr TF gave Breakout with volumes and then sideways consolidation, trading near upper side of Range
Aggressive Traders make entry here else can wait for breakout and Retest of consolidation Zone

INFY Triangle Pattern INFY triangle pattern on daily time frame & as always INFY making range after breakdown everytime same trend seen in INFY Chart now let’s see what INFY do?? wait for pattern to give breakout or breakdown

will infy crash 10% cause of selling in us market?NSE:INFY if #infosys breaks daily support of 1365/1345, then only we can expect a fall till weekly buy area of 1250 range zone, if #infy does open 10% down , then it wil be opening at the weekly buying zone, dont rush to buy or invest unless weekly buy zone holds infy fall, if weekly zone breaks then avoid infy for investing purposes.

Infosys - low risk high reward long Swing trade opportunity
Infosys is currently trading within a robust support zone that is visible on both monthly and weekly time frames.
The stock has already responded positively to the weekly demand zone and formed a bullish engulfing candle on the weekly time frame.
Additionally, selling volume has been decreasing, and a bullish divergence has emerged on the daily time frame as confirmed by the Wave Volume Divergence Indicator.
A strong support line, represented by the purple line plotted on all three time frames, making it a low-risk, high-reward trade opportunity to initiate a long position near that level.
The Daily Time frame displays a 1:2 position, and the first target has been identified. To maximize potential profits from this trade, traders can trail both their Stop Loss and Target.
In conclusion, Infosys is currently presenting an enticing trading opportunity, as it is trading within a robust support zone visible on multiple time frames, and has formed a bullish engulfing candle on the weekly chart. Coupled with a decrease in selling volume and a bullish divergence confirmed by the Wave Volume Divergence Indicator, it appears to be a low-risk, high-reward trade to initiate a long position near the strong support zone.
I am not a SEBI registered individual; my analysis is only for educational purposes.
If you find my analysis helpful, I'd appreciate it if you could like it and follow me on TradingView for more analysis like this.

Infy can rise upto all time high !!Infy can rise sharply
Positive setup
expecting rise till 1900
if cross and close above 1625-1635
NIFTYIT index keep on radar

INFY a good time to BUY / GO LONGInfosys has given a range breakout of Head and Shoulder Pattern , and we have got a closing also outside the range, so this is a good price and time to enter LONG.
Risk Reward should be at least 1:1

infosys a short period bull viewbull for the next few days if nifty performs well.
enter after range breakout

Infosys analysisBO can happen because the volume is supporting the price movement.
Good RR we can catch here.

INFY Looks Bullish Fresh Breakout SeenINFOSYS looks bullish, Fresh Trendline breakout is seen yesterday (20th July 2022) and Today Retested the previous Resistance which acted as support and now ready to head towards higher levels. I am Looking to Go Long on INFY Future around Current Price 1518- 1520 With Stoploss 1495 And Expecting Targets of 1550/ 1580 in the next 1-3 Trading sessions.

Infy - Looks extremely positive As seen on the charts, Harmonic pattern and MA's indicate an correction to 1650 levels.
This is my view and for education purposes only.

#infosys #infy At support NSE:INFY
As we can see Infosys stock at one of major support even RSI Divergence seen on daily time frame, we just need price action conformation for Swing long.
******whatever charts or levels sharing here or on any other platforms are just for educational purpose only, Not A Recommendation To Buy Or Sell. Please do your own analysis before taking any trade on them. We are not SEBI registered.

Infosys - Possible Reversal Coming ? Below are my Observation
1. Harmonic Pattern - 161% correction
2. Good Volume Delivery for 20 day average
Target & SL is as shown on the chart

Things are not looking good for INFY!#INFY has broken down TL support on Monthly Time Frame. Confirmation by Month End.
Next major support: 1540-1545
Best buy zone: 1320-1415 (if BD is confirmed)

NSE:INFY trading @ resistance !!NSE:INFY
#NSE:INFY trading @ resistance, Potential levels marked on chart for LEarning.
Do ping me in case of clarifications.
Details under this chart available.

Infy - Triangle target hit and it will flyInfosys after a long consolidation, meanwhile forms a triangle structure and breaks out to hit the target and moving beyond as with CNXIT

Short Infy 1874 Absolute TOP - RISK REWARD RATIO 1:5Nifty IT is overhyped and euphoric , as it was there in Nifty . Short Infy as it is one of the leader of IT sector after TCS .This will play role in falling of Nifty IT.
Note : This suggestion is Data Backed from Stock Data Science . You can take positions after consulting your Financial Advisor . Please manage your risk accordingly.
