INOX GREEN at the Pull Back Support OR Retest Level.Pullback and retest entry levels are price action strategies where traders wait for the market to return to a broken support/resistance zone before entering. This helps confirm the breakout, avoid false signals, and secure higher-probability entries
🔑 Understanding Pullback vs. Retest
Pullback Entry
1. Occurs when price breaks out of a level and then retraces back toward the breakout zone.
2. Traders enter once the pullback shows signs of continuation (e.g., bullish candles after retesting support).
3. Advantage: Better risk-to-reward ratio since entry is closer to support/resistance.
Retest Entry
1. Happens when price breaks a level and then tests the same level again to confirm it as support/resistance.
2. Traders wait for confirmation (e.g., rejection wicks, volume surge) before entering.
3. Advantage: Higher probability of success since the market validates the breakout.
🧠 Practical Tips for Traders
Wait for confirmation: Don’t jump in on the first breakout candle. False breakouts are common.
Use multiple timeframes: A retest on the 1-hour chart may look like a pullback on the 15-min chart.
Combine with indicators: Volume spikes, RSI divergence, or moving averages can strengthen entry signals.
Set clear invalidation levels: Place stop-loss just beyond the retest zone to minimize risk.
Patience is key: The best entries often come after the market “proves” itself twice.
🎯 Live Example Scenario
In INOXGREEN weekly chart below stock is currently trading at Rs. 200.00 (A earliere neckline breakout of Inverted Head & Shoulder Patter OR simply say earlier resistance breakout levels.)
Stock after neckline / resistance breakout rallied as per pattern process and now retraced / corrected back to its breakout levels now so called resistance turned support levels.
Stock has seen a weekly rejection candle ( last week) exactly near resistance turned support levels showing some signs of bullish activity indicating support & a perfect textbook example to BUY a valid resistance turned support stock.
Stop Loss in such cases are very close offering a low risk high reward ratio.
This strategy example can be used in any stock for any timeframe (Equity / Commodity / Currency / Crypto, etc) based on the theory of Technical Analysis.
Above is just a perfect textbook example on live chart. Same can be applied and tested by traders for their use. (Back testing is important for traders as per timeframes)
INOXWIND
Inox Wind cmp 154.08 by Daily Chart viewInox Wind cmp 154.08 by Daily Chart view
- Support Zone 136 to 146 Price Band
- Resistance Zone 165 to 176 Price Band
- Volumes in good sync with avg traded quantity
- Falling Resistance Trendline Breakout seems sustained
- VCP pattern seems in making process by technical chart setup
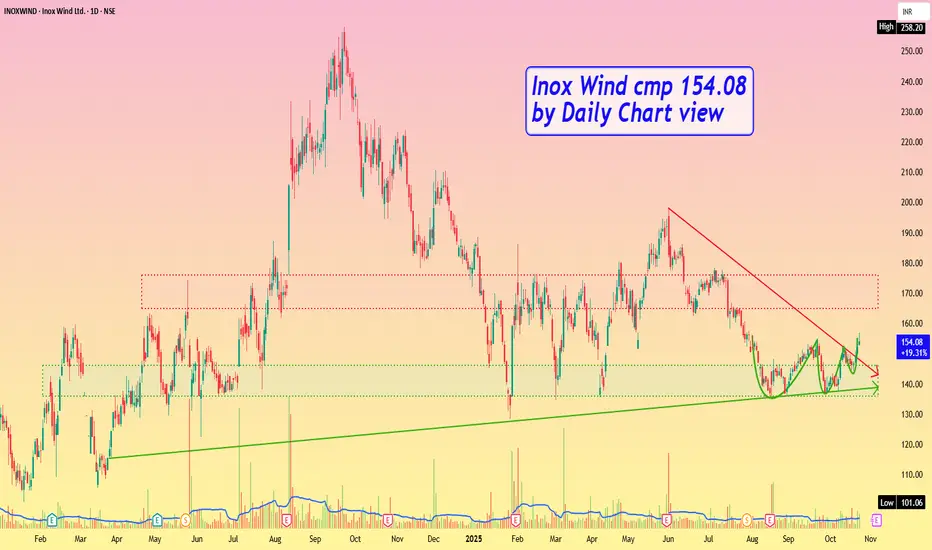
Inox Wind Decisive Break out possible only if stock crosses 196 level on closing basis.
Q 3 Numbers are good.
Lets wait and watch
KPI GREEN IS LOOKING BULLISHKPI GREEN is looking strong at current market price as this area giving strong support to the buyers. Also price rejected multiple times from this area. All views are my personal

A STRONG BREAKOUT STOCK - INOX WINDNSE:INOXWIND
❇️ Strong breakout on weekly chart.
❇️ Flag and poll pattern in 30mint time frame.
❇️ Stock can achive 250-270 targets in upcoming days.
❇️ Short and log terms targets 300+.
❇️ Nearby support 215-220.
❇️ Above 236 we can see a real move🔥
👉🏻 thetradeforecast 🇮🇳

Inoxwind looks ready for a 100% upside in medium termNSE:INOXWIND for short to medium term only.
Buy above 238 ONLY. And that too when it closes above it on daily chart. Don't be in hurry to enter. Be a pro and wait for the levels to come into play.
SL 210.10 on weekly closing basis
Target for Short-term - 345
(44.96% upside potential)
Holding period - 1-2 months
Target for Medium-term - 485
(97.61% upside potential)
Holding period - 3-4 months
🔴 Disclaimer - Not a Buy/Sell Recommendation.


InoxWind Swing | Channel SwingYesterday 10% fall seen as one of promotor has reduced 5% their holding that's why following many traders has sold this and it was at lower price.
But i think in different way as someone has sold 5%, even someone has bought as well 5% and might be more because it was available with discount price then previous day. Basically stock up down is part of stock nature.
So as i believe in chart pattern rather to hold for long term, just wait for your chart pattern and then enter and exit with profit of your framework.
Current chart pattern has build channel bottom which looks good for swing reverse and can go up to 175 back. According we can plan for this swing.
This is my view for this stock but you can define your own risk reward according to your analysis and then take trade. its not my recommendation to anyone to buy directly.
Regards

Barrish on InoxwindI'm Barish on Inoxwind.
Because
1. Tripple Top
2. RSI Strong Diversion
3. Price is same but RSI Level is Down and Breaking old low

SUZLON looking bullish from 38Observe These levels in SUZLON as there is very strong demand zone near to current market price

INOXWIND - Ichimoku BreakoutStock Name - Inox Wind Limited
Ichimoku Cloud Setup :
1). Today's close is above the Conversion Line
2). Future Kumo is Turning Bullish
3). Chikou span is slanting upwards
All these parameters are showing bullishness at Current Market Price
and more bullishness AFTER crossing 240
#This is not Buy and Sell recommendation to any one. This is for education purpose and a helping hand to learn trading in Market.
#CloudTrading
#IchimokuCloud
#IchimokuFollowers
#Ichimokuexpert
I hope you all like my analysis.
Please do share your thoughts into comment section.
Please give a like, share & subscribe for daily analysis.

Inox Wind soars 9%, hits 7-year high on MondayInox Wind soars 9%, hits 7-year high on Monday; what's driving the rally?
Shares of Inox Wind hit their highest level since July 2016 after its customer, NTPC Renewable Energy, announced the successful commissioning of 50 MW out of 150 MW Dayapar Wind Energy Project

Weekly view - Inoxwind - Oct 9, 2023Inoxwind's weekly chart is displaying significant strength and appears to have ample upward potential. After maintaining lower levels for nearly 80 days, it has now formed a bullish weekly candle.

INOXWIND - Bullish Swing ReversalNSE: INOXWIND is closing with a bullish swing reversal candle supported with volumes.
Today's volumes and candlestick formation indicates strong demand and stock should move to previous swing highs in the coming days.
The stock has been moving along the horizontal support for the past few days which is indicating demand.
One can look for a 8% to 12% gain on deployed capital in this swing trade.
The view is to be discarded in the event of the stock breaking previous swing low.
#NSEindia #Trading #StockMarketindia #Tradingview #SwingTrade

INOX WIND will give good returnswe see in the chart that the stock changing its momentum
we will see that the stock will give good returns on the monthly chart
Central resistance zone between 235 to 310 rs approx.(+-5)...above 233 will see a sudden change in north direction...book profit at 300 rs and if broke 310 monthly then the stock will show further momentum
first target:235
second target:305 approx.
sl:165 rs on a closing basis
views are personnel...we are not sebi registered...

INOXWIND - Ichimoku BreakoutStock Name - Inox Wind Limited
Ichimoku Cloud Setup :
1). Today's close is above the Conversion Line
2). Future Kumo is Turning Bullish
3). Chikou span is slanting upwards
All these parameters are showing bullishness at Current Market Price
and more bullishness AFTER crossing 216
#This is not Buy and Sell recommendation to any one. This is for education purpose and a helping hand to learn trading in Market.
# Cloud Trading
# Ichimoku Cloud
# Ichimoku Followers
I hope you all like my analysis.
Please do share your thoughts into comment section.
Please give a like, share & subscribe for daily analysis.


INOXWIND - Ichimoku BreakoutStock Name - Inox Wind Limited
Ichimoku Cloud Setup :
1). Today's close is above the Conversion Line
2). Future Kumo is Turning Bullish
3). Chikou span is slanting upwards
All these parameters are showing bullishness at Current Market Price
and more bullishness AFTER crossing 203
#This is not Buy and Sell recommendation to any one. This is for education purpose and a helping hand to learn trading in Market.
# Cloud Trading
# Ichimoku Cloud
# Ichimoku Followers
I hope you all like my analysis.
Please do share your thoughts into comment section.
Please give a like, share & subscribe for daily analysis.

Inox Wind Breakout Analysis Stock has given massive BO with huge volume spike forming round bottom pattern, follow chart for proper support and resistance levels.

INOXWIND - Ichimoku Bullish Breakout Stock Name - Inox Wind Limited
Ichimoku Cloud Setup :
1). Today's close is above the Conversion Line
2). Future Kumo is Turning Bullish
3). Chikou span is slanting upwards
All these parameters are showing bullishness at Current Market Price
and more bullishness AFTER crossing 135
#This is not Buy and Sell recommendation to any one. This is for education purpose and a helping hand to learn trading in Market.
# Cloud Trading
# Ichimoku Cloud
# Ichimoku Followers
I hope you all like my analysis.
Please do share your thoughts into comment section.
Please give a like, share & subscribe for daily analysis.

INOXWIND - bouncing backNSE:INOXWIND
After a recent downtrend from NOV, INOXWIND seems to be bouncing back from support levels.
We can clearly see an increase in volumes, above all the moving averages.
Also, Daily RSI is increasing, which is above weekly and monthly.
Also stock closed above the previous Week and Monthly Highs.
Add to watchlist - next target will be 128 and then 154 levels.

Inox wind ltdIt is change into choch and after that it takes inducement and going for the breaking the structure and making new high

swing trade setup 15% gainsLOGIC,LEVEL AND TARGET WELL MENTIONED IN THE CHART
NOTE -The above interpretation from the chart is my personal view and doesn't guarantee any success.
(Do talk to your financial advisor before making any investment decisions)
please like, share and comment if you have any suggestion regarding this analysis.
