Descending Triangle Breakout with Institutional Volume | STWP💹 Intellect Design Arena Ltd (NSE: INTELLECT)
Sector: IT – FinTech Solutions | CMP: ₹1,133.50 | View: Bullish Momentum Breakout Setup
📊 Price Action:
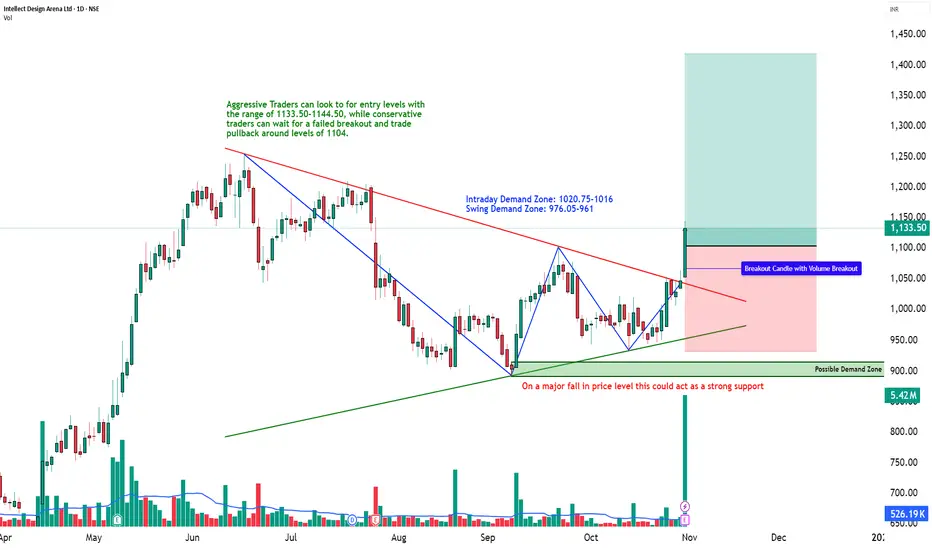
Intellect Design Arena has delivered a strong bullish breakout from its multi-month descending trendline, marking a structural shift from a consolidation base to a clear uptrend.
The stock reversed sharply from the ₹890 swing low and confirmed momentum above the ₹1,100–₹1,120 zone with an explosive 10x volume expansion.
The wide-range bullish candle and sustained higher close suggest institutional breakout participation and trend continuation toward upper resistance zones.
💼 HNI Trade Levels (STWP Setup):
Aggressive Entry: ₹1,114.50 | Stop Loss: ₹1,044.35
Low-Risk Entry: ₹1,076.5 | Stop Loss: ₹1,019.5
HNI and institutional activity is visible through heavy delivery-based volume and strong follow-up momentum.
The bullish structure remains intact as long as price sustains above ₹1,075–₹1,080, where short-term demand has been confirmed.
📉 VCP Analysis:
Intellect displays a multi-stage Volatility Contraction Pattern (VCP) — 8 visible contractions as per the VCP dashboard.
Each contraction narrowed with decreasing volume before the final 20-day breakout candle confirmed a volatility expansion phase.
This marks the beginning of a trend acceleration stage, aligning perfectly with RSI, MACD, and Supertrend confirmations.
📈 STWP Trading Analysis:
Entry: ₹1,114.50 | Stop Loss: ₹1,044.35
The breakout candle exhibits strong momentum with 5.42M volume vs an average of 0.52M, indicating institutional footprints.
The price is now sustaining above short- and medium-term EMAs, with all major timeframes (Daily–Weekly–Monthly) confirming an uptrend alignment.
Holding above ₹1,095–₹1,075 will maintain the bullish bias, keeping momentum setups active toward ₹1,175–₹1,255 zones.
📏 Fibonacci Analysis:
From swing low ₹890.25 to swing high ₹1,255.0:
61.8% @ ₹1,115.7 → Confirmed breakout level.
78.6% @ ₹1,176.9 → Next momentum target.
100% @ ₹1,255.0 → Swing resistance.
A daily close above ₹1,116 validates the Fibonacci continuation path toward ₹1,255–₹1,285, with an extended potential to ₹1,354 (Fibo 127.2% projection).
🧭 STWP Support & Resistance:
Resistances: ₹1,167.5 | ₹1,201.5 | ₹1,255.0
Supports: ₹1,076.5 | ₹1,019.5 | ₹985.5
The ₹1,076–₹1,020 zone acts as a key accumulation pocket, while the ₹1,255 area marks a significant swing barrier.
Structure indicates strong base support with progressive higher demand, suggesting buyers remain dominant on dips.
📊 STWP Volume & Technical Setup:
Today’s session recorded 5.42M shares vs 0.52M average, a 10x volume surge, confirming institutional breakout participation.
Indicators show bullish MACD crossover, RSI momentum above 70, and Stochastic strength across all timeframes.
The breakout is also validated by Bollinger Band expansion, signaling volatility release.
Trend Direction: UPTREND | Volume Confirmation: Strong Institutional Activity
🧩 STWP Summary View:
Final Outlook:
Momentum: Strong | Trend: Bullish | Risk: High | Volume: High
Intellect Design Arena has transitioned into a confirmed bullish continuation phase with institutional footprints and multi-indicator confirmation.
Holding above ₹1,075 keeps the pattern valid for a potential rally toward ₹1,175–₹1,255 levels.
The setup remains technically clean, high-volume backed, and trend-aligned — favoring bullish bias continuation in the near term.
⚠️ Disclosure & Disclaimer – Please Read Carefully
The information shared here is meant purely for learning and awareness. It is not a buy or sell recommendation and should not be construed as investment advice.
I am not a SEBI-registered investment adviser, and this analysis is based on chart observations, technical patterns, and public data.
Trading involves risk; market movements can be sudden, and losses may exceed invested capital.
Past performance or setups do not guarantee future results.
Please evaluate your risk management and suitability before taking any trading decision.
Consult a SEBI-registered financial adviser before acting on any trade idea.
Position Status: No active position in (INTELLECT) at the time of analysis.
Data Source: TradingView & NSE India (Past Chart Reference).
💬 Found this useful?
🔼 Give this post a Boost to help more traders discover structured learning.
✍️ Drop your thoughts, queries, or setups in the comments — let’s grow together!
🔁 Share this with fellow traders and learners to promote structured analysis.
👉 “If you liked this breakdown, follow for more clean, disciplined setups with patience at the core.”
🚀 Stay Calm. Stay Clean. Trade With Patience.
Trade Smart | Learn Zones | Be Self-Reliant 📊
Intellectdesign
intellect design idea#INTELLECT Add to swing watchlist, Hourly timeframe
Inside bar setup active will be active only above 817
Resistance of 860
Can add on dips till 790
happy trading!!!
The stock's ratio of 45.06x is currently trading slightly above its industry peers' ratio of 41.27x, which means if you buy Intellect Design Arena today, you'd be paying a relatively sensible price for it.

Intellect Design symmetrical triangle breakoutNSE:INTELLECT Beautiful Chart Structure and Symmetrical Triangle Breakout. A Swing Towards R1 and R2 is Possible.
📌Thank you for exploring my idea! I hope you found it valuable.
🙏FLLOW for more
👍BOOST if useful
✍️COMMENT Below your views.
Meanwhile, check out my other stock ideas below until this trade is activated. I would love your feedback.
Disclaimer: This analysis is intended solely for informational and educational purposes and should not be interpreted as financial advice. It is advisable to consult a qualified financial advisor or conduct thorough research before making investment decisions.

Intellect Design Arena lImitedAs per my analysis we can buy intellect design around 750 for the targets of 1327 and 1916 nothing new in this analysis, so i am defining less

Intellect Design is the new Idea trading above moving averages after a good consolidation retracement, this will give a new short term high soon.
R/R is mentioned in the picture.
Learn and earn

Intellect Design - Golden Opportunity to InvestBuy in 475-530 Range
Support at 410
Target 1 - 750
Target 2 - 1310

Intellect Design is in strong momentumEarnings impact has made NSE:INTELLECT a very clean chart with great upside. I have simplified the chart for everyone by removing the noise. Keep a target of 850 with a stop loss at 610. Go Long.

Intellect Design Wave 2 Intellect Design has a impulse rise in wave 1 & has now pulled back to 40 EMA average holding this on closing basis will be important for next powerful Wave 3 rise.

INTELLECT Daily looking bullishINTELLECT Daily has inverted head n shoulder breakout with 200 ema support on daily candle.
Good to buy at retracement near 500 for targets of 588,631 with sl below 478

Long term idea on Intellect designI daily make educational content videos for swing / positional trading

#Intellect Design will hold BO or not !Stock has given strong BO with massive volume spike forming round bottom pattern, follow chart for proper entry and exit levels.

#IntellectDesign#IntellectDesign good breakout after 27 week's consolidation. CMP 531 seems ready for good upside. Can be added on every dip for 30% upside from here.

Corrective Phase about to completeThe structure indicating that the scrip in last leg of corrective phase - wave 2
Crossing Swing highs would make a valid Inverted Head & Shoulder Pattern - as the move in head was a clean 5 wave structure. A probable Trend reversal on long term chart.
We would be looking to have a starting position on green closing (daily TF) and add as and when the swing high breaks.
Invalidation point for our trade would be 393

Intellect Design This Stock has done a golden ratio correction of the rise from Covid bottom & we have seen a 5 Wave rise from lows.
The rise from covid lows to highs was a clear impluse & correction was in 7 Swings which makes it a ideal Wave 2 ending exact at 61.8% levels so if the stock is starting Wave 3 we might see this stock do a 5x.
I am not a SEBI Registered analyst chart shared for education purpose.

Intellect designIntellect design is in a downtrend and has given another breakdown closing after a long consolidation, if it start sustaining below PDL, we may see further downside target here.

Intellect Design for Next Few DaysNSE:INTELLECT
Analysis after 9th dec 2022 closing
Wave Count - Last leg for C wave is remaining.
Berish Revered Divergence - which indicates buyers exhausted.
Weekly TF - Last week closing was formed bearish engulf candle for Weekly TF.
What if Analysis,
Next T. Day if Huge GAP UP wait for to break 420 Rs support for confirm Entry.
Target
~334 rs

Intellect Design - 1:20 RRIntellect Design - 1:20 RR - Can target 1000
Superp and multiple support at 580 levels.

Expecting a Bullish Momentum in INTELLECTAs per the 2 Hour Chart of INTELLECT, we have witnessed the Formations of a “Bullish Harami” Pattern backed by a confirmation candle.
Therefore, we are expecting to witness a bullish momentum in the stock in the upcoming trading sessions. Wherein, the stock is being expected to face a resistance initially at around the levels of 808.85, 828.30, and 846.70. Whereas, on the other hand, on the downside levels, the stock may face a support at the level of 766.90, on closing basis.
Closing Price (as on 02.05.22) : 788
Disclaimer: No financial information whatsoever published here, should be construed as an offer to buy or sell securities, or as advice to do so in any way whatsoever. All matter published here is purely for Educational and Information purposes only and under no circumstances should be used for making investment decisions. Viewers must consult their personal financial advisor before making any actual investment decisions, based on information published here. Any Investor or Trader taking decisions based on any information published here, does so entirely at its own risk. Investors and Traders should bear in mind that any investment in Stock Market is subject to unpredictable market-related risks.

Intellect Design Chart Breakout !!📈 Intellect Design 📉
It broke out from Resistance Zone of 780-800 and also closed above high of July 2021 with strong green candle. So I am biased on long side.
On Buy Side I am looking for Targets of 1000 and 1100.
StopLoss should be kept at 810.
It offers 1 : 2 Risk Reward.
All Important Supports and Resistances are drawn in chart. All levels are on closing basis.
Please have a look and revert back if you need some more study on it.
Disclaimer : Consult Your Financial Advisor Before Taking Any Decision On This Analysis.

Intellect Design long side targetsNSE:INTELLECT
here we are using harmonic for long side target in positional trade one can long till target one for swing as well.
if find reversal at target 1, one can short as well and ones find support then go for target 2 again if find reversal at target 2 go for short again.
******whatever charts or levels sharing here or on any other platforms are just for educational purpose only, Not A Recommendation To Buy Or Sell. Please do your own analysis before taking any trade on them. We are not SEBI registered.


INTELLECT GOOD ABOVE 750 KEEP EYESTRADE OR INVEST wisely.
WE CAN JUST PREDICT.
Disclaimer: I am not a SEBI registered advisor , so before entering on my view plz ask your SEBI Registered Advisor . Profit is your and loss is your.
PLEASE LIKE AND SHARE IF YOU AGREE WITH THE IDEA

Intellect Design ArenaIntellect Design looks really good at these levels and a stop loss at 815 can be maintained as the stock goes for a new lifetime high.
