Market Correlations & Intermarket Analysis1. Market Correlations: Definition and Importance
Market correlation refers to the statistical relationship between the price movements of two or more assets. Correlation is measured on a scale from -1 to +1:
+1 correlation: The assets move perfectly in the same direction. If one rises 1%, the other rises 1%.
-1 correlation: The assets move perfectly in opposite directions. If one rises 1%, the other falls 1%.
0 correlation: No discernible relationship exists; movements are independent.
Why correlations matter:
Risk Management: Portfolio diversification relies on understanding correlations. Assets with low or negative correlation can reduce overall portfolio volatility. For example, stocks and bonds often have low or negative correlations, helping stabilize returns during market turbulence.
Trading Strategies: Correlations help traders identify potential hedges or pairs trading opportunities. For example, if gold and silver are highly correlated, movements in one may predict the other.
Market Sentiment Insight: Correlations reveal the behavior of market participants. Strong correlations between equities and commodities may indicate risk-on or risk-off sentiment in the broader market.
2. Types of Market Correlations
Positive Correlation:
Examples include:
S&P 500 and Nasdaq: Broad stock indices often move together due to overall market trends.
Crude Oil and Energy Stocks: Rising oil prices generally boost energy sector equities.
Negative Correlation:
Examples include:
Stocks and Bonds: In periods of stock market decline, investors often seek safety in government bonds.
US Dollar and Gold: Gold often rises when the USD weakens, as it is priced in dollars globally.
Dynamic or Time-Varying Correlation:
Correlations are not static. They change over time due to macroeconomic events, policy shifts, or market cycles. For instance:
During financial crises, correlations between stocks tend to increase, a phenomenon known as “correlation breakdown” in diversification.
Cross-Asset Correlation:
Beyond traditional assets, correlations also exist across asset classes. For example:
The price of oil may influence the Canadian dollar because Canada is a major oil exporter.
Interest rate changes in the U.S. impact emerging market equities and currencies.
3. Intermarket Analysis: Concept
Intermarket analysis is the study of relationships between different financial markets to forecast trends and confirm signals. The approach was popularized by John J. Murphy, who emphasized that no market moves in isolation. Intermarket analysis identifies leading, lagging, and coincident relationships between asset classes.
Key principle: Asset classes often react to the same economic forces but in different ways. By analyzing these reactions, traders can anticipate movements and make informed decisions.
4. Key Intermarket Relationships
Stocks vs. Bonds
Bonds are traditionally considered safe-haven assets, while stocks represent growth.
Rising interest rates usually depress bond prices and may negatively impact stock valuations due to higher borrowing costs.
Conversely, falling rates can boost equities while raising bond prices.
Stocks vs. Commodities
Commodity prices, such as oil or metals, impact inflation and corporate profits.
Higher oil prices may benefit energy stocks but hurt sectors sensitive to input costs.
Precious metals like gold often act as hedges against equity market volatility.
Commodities vs. Currencies
Commodity-exporting nations’ currencies often move in sync with their key exports.
Example: Canadian dollar vs. crude oil, Australian dollar vs. iron ore and gold.
Traders monitor these relationships to anticipate currency fluctuations.
Stocks vs. Currencies
Strong domestic currency can negatively affect exports, impacting companies’ earnings.
Conversely, weak currency can boost exporters but may increase import costs.
Interest Rates vs. Stocks
Rising interest rates increase the cost of capital, generally slowing equity growth.
Declining rates often create a favorable environment for stocks.
Sentiment & Risk-On/Risk-Off Relationships
In risk-on environments, equities and commodities rise while safe-haven assets like bonds and gold may decline.
In risk-off periods, the opposite pattern occurs.
5. Using Correlations in Trading
Practical applications:
Hedging Portfolios
Traders hedge exposure by taking positions in negatively correlated assets. For instance, long equities may be hedged with long bonds or gold.
Pairs Trading
Traders exploit temporary divergences in highly correlated assets. For example, if crude oil and energy stocks usually move together but diverge, a trade may profit from the eventual reconvergence.
Leading and Lagging Indicators
Certain markets act as leading indicators. For instance:
Bond yields often lead stock market trends.
Crude oil price changes may precede moves in commodity currencies.
Confirmation and Divergence
Correlations can confirm trends. For example, a rising stock market accompanied by declining bond yields may confirm a strong growth environment.
Divergences often signal caution. For example, equities rise while bonds and gold also rise, possibly indicating market stress.
6. Measuring Correlations
Statistical Measures
Pearson correlation coefficient: Measures linear relationships.
Spearman’s rank correlation: Captures monotonic relationships.
Rolling correlations: Show how relationships change over time.
Visual Tools
Correlation matrices are widely used to quickly identify relationships between multiple assets.
Intermarket charts plot asset classes together for comparative analysis.
7. Limitations
Correlation is Not Causation
Just because two assets move together does not mean one causes the other to move.
Dynamic Nature
Correlations change during market stress, economic cycles, or geopolitical events, sometimes reversing.
Over-Reliance Risk
Traders relying solely on historical correlations may be blindsided by sudden structural changes in markets.
8. Modern Intermarket Trends
Globalization has increased cross-market linkages.
Algorithmic trading exploits subtle correlations in milliseconds.
ETFs and derivatives amplify correlations across markets.
Central bank policies now have a global ripple effect, linking currencies, equities, and commodities more closely than ever.
9. Conclusion
Market correlations and intermarket analysis are indispensable tools for understanding financial markets. They help investors manage risk, identify opportunities, and anticipate market movements by analyzing how assets influence each other. While correlations offer quantitative insights, intermarket analysis provides a broader perspective, considering macroeconomic forces, market sentiment, and asset class interactions. Successful traders and investors integrate both approaches to create resilient portfolios and informed strategies, recognizing that markets are interconnected webs rather than isolated instruments.
In essence, understanding intermarket relationships allows one to see the market’s hidden signals, predict trends, and manage risks more effectively, making it a cornerstone of professional trading and investment analysis.
Intermarketanalysis

Intermarket Analysis: A Complete GuideIntroduction
Intermarket Analysis is the study of relationships between different financial markets—such as equities, bonds, commodities, currencies, and interest rates—to understand the overall direction of the global economy and financial markets. Instead of analyzing a market in isolation, intermarket analysis assumes that all markets are interconnected and that price movements in one market often influence or predict movements in another.
For traders and investors, this approach provides context, confirmation, and often early warning signals. It is especially useful in identifying trends, risk-on/risk-off environments, sector rotation, and major market turning points.
Core Philosophy of Intermarket Analysis
The foundation of intermarket analysis rests on three key ideas:
Markets are globally connected
No market operates independently. Economic growth, inflation, monetary policy, and capital flows affect all asset classes.
Money flows between asset classes
Capital constantly shifts between stocks, bonds, commodities, and currencies based on risk appetite, interest rates, and economic expectations.
Leading and lagging relationships exist
Some markets move ahead of others. For example, bond yields often lead equity trends, and commodities often signal inflation before it appears in economic data.
The Four Major Asset Classes
1. Bonds (Interest Rates)
The bond market is often considered the smart money because it reacts quickly to changes in inflation, growth, and central bank policy.
Rising bond prices → Falling yields → Economic slowdown or risk aversion
Falling bond prices → Rising yields → Economic expansion or inflation expectations
Key Insight:
Bond yields often lead stock market trends. A sharp rise in yields can pressure equity valuations, while falling yields can support stocks—especially growth stocks.
2. Equities (Stocks)
Equities reflect expectations about corporate earnings, economic growth, and liquidity.
Strong stock markets → Economic expansion, risk-on sentiment
Weak stock markets → Economic contraction, risk-off sentiment
Intermarket analysis helps identify which sectors will outperform:
Rising yields → Banks, financials outperform
Falling yields → IT, FMCG, defensive sectors outperform
3. Commodities
Commodities are closely tied to inflation and economic demand.
Rising commodities → Inflationary environment, strong demand
Falling commodities → Deflationary pressures, weak demand
Important relationships:
Crude oil ↔ Inflation & transportation costs
Industrial metals (copper) ↔ Global growth
Gold ↔ Inflation, currency weakness, uncertainty
Copper is often called “Dr. Copper” because it acts as a barometer for global economic health.
4. Currencies (Forex)
Currencies reflect capital flows, interest rate differentials, and economic strength.
Strong currency → Capital inflows, higher interest rates
Weak currency → Capital outflows, inflation risk
Key relationships:
Strong USD → Pressure on commodities and emerging markets
Weak USD → Commodities and emerging markets outperform
In India’s context, USD/INR movements directly impact:
IT stocks (benefit from weaker INR)
Oil marketing companies (affected by stronger USD)
Classic Intermarket Relationships
Bonds vs Stocks
Falling yields usually support equities
Rising yields can hurt equity valuations
Sharp yield spikes often precede equity corrections
Commodities vs Bonds
Rising commodities → Inflation → Rising yields
Falling commodities → Disinflation → Falling yields
Gold vs Real Yields
Gold rises when real yields fall
Gold struggles when real yields rise
USD vs Commodities
Strong USD → Commodities fall
Weak USD → Commodities rise
Economic Cycle and Intermarket Behavior
Intermarket analysis aligns closely with the economic cycle:
1. Early Expansion
Bonds bottom, yields start rising
Stocks begin rallying
Commodities start stabilizing
2. Mid Expansion
Stocks strong
Commodities rising
Yields rising steadily
3. Late Expansion
Commodities peak
Inflation rises
Central banks tighten policy
4. Recession
Stocks fall
Bonds rally
Commodities decline
Gold often outperforms
Understanding where the economy stands helps traders position correctly across markets.
Sector Rotation Using Intermarket Analysis
Capital rotates between sectors depending on intermarket signals:
Rising yields → Banks, capital goods, PSU stocks
Falling yields → IT, FMCG, pharma
Rising oil → Energy stocks outperform
Rising metals → Metal and mining stocks outperform
This approach is widely used by institutional investors to allocate capital efficiently.
Intermarket Analysis for Traders
For Swing & Positional Traders
Use bond yields to confirm equity trends
Watch USD index before trading commodities
Use gold as a hedge during volatility
For Intraday Traders
Pre-market global cues (US bonds, crude oil, Asian markets)
Currency movement impact on index futures
Risk sentiment from US markets
Advantages of Intermarket Analysis
Provides big-picture context
Helps avoid false breakouts
Improves trade confirmation
Identifies early trend reversals
Enhances risk management
Limitations of Intermarket Analysis
Relationships are not fixed forever
Short-term noise can distort signals
Requires understanding of macroeconomics
Not ideal as a standalone trading system
Best Practice:
Use intermarket analysis alongside technical analysis, volume analysis, and price action.
Conclusion
Intermarket Analysis is a powerful framework that helps traders and investors understand why markets move, not just how they move. By studying the interaction between bonds, equities, commodities, and currencies, one can gain deeper insight into economic conditions, capital flows, and market psychology.
In modern markets—where global events, central bank decisions, and capital mobility dominate—intermarket analysis is no longer optional. It is an essential skill for anyone aiming to trade or invest with confidence, discipline, and a long-term edge.

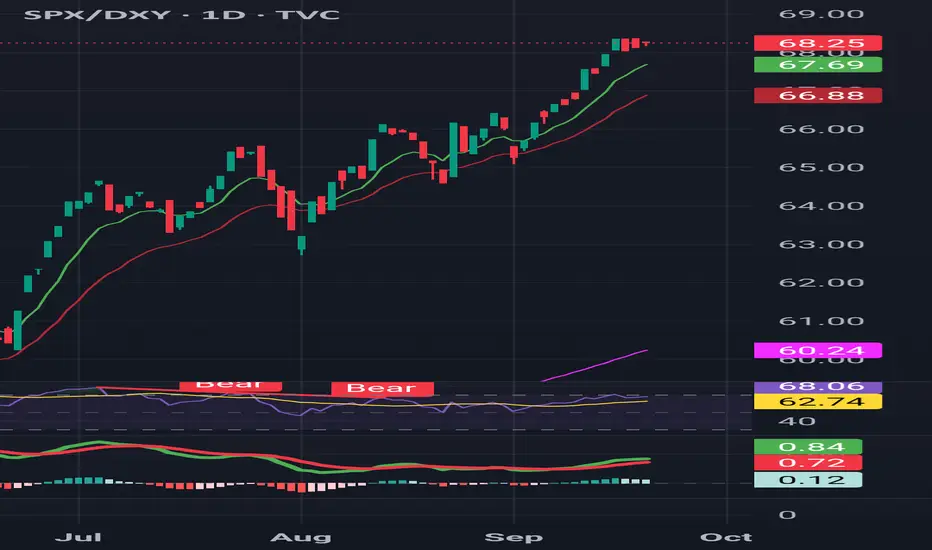
SPY/DXY RATIOSPX/DXY remains at elevated highs, supported by bullish EMA alignment. But RSI has started rolling over, and MACD momentum is flattening.
⚠️ This suggests equities’ relative outperformance over the Dollar may be losing steam. Risk of a near-term pause or pullback is rising.
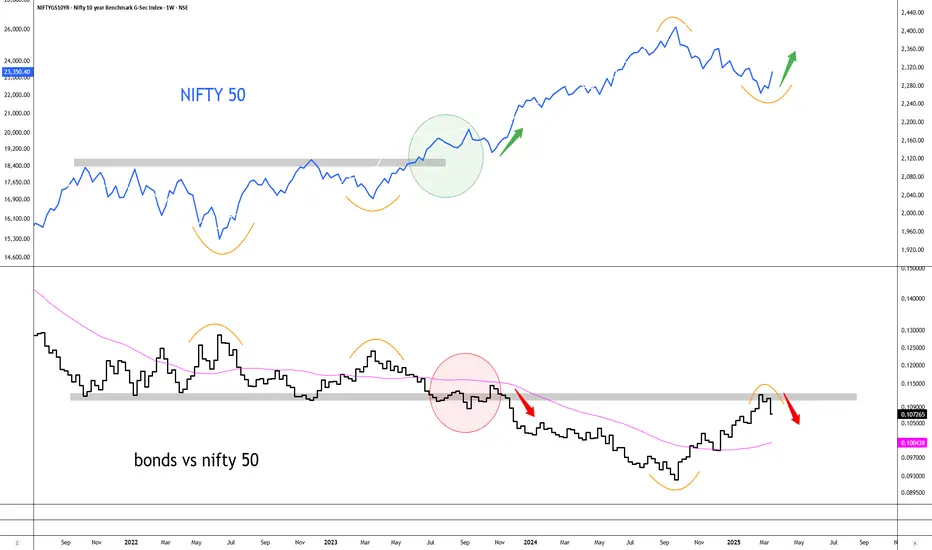
INTERMARKET on niftyclearly there is an inverse relation between the 2 charts , my bet is if the lower line is hitting a potential resistance and a rollover is coming , then nifty has made some type of bottom for now . i am open for a retest of 21800 but for now looking for LONGS has more merit than SHORTS.
Midcap ETF forming Dual Rounding PatternThe ICICI Prudential Midcap ETF is currently exhibiting a technically significant dual rounding pattern on its chart, with one smaller rounding top pattern nested within a larger, longer-term rounding formation. The 21 level has emerged as a strong support zone. A breach of this level would likely activate the smaller rounding top pattern, potentially leading to a further decline toward the 19 level.
The ETF initially displayed a bullish structure characterized by higher highs and higher lows, but has now shifted to forming lower highs and lower lows, a common early indicator of a trend reversal from bullish to bearish. This suggests that while the market is in the early stages of this reversal, it's too soon to definitively call the transition.
Volume analysis plays a crucial role in confirming price action, as volume tends to be a more reliable indicator. In the recent chart movement, a clear volume divergence was observed during the last upward move, indicating weakening buying interest. Conversely, there has been volume agreement during the recent price decline, further supporting the possibility of a bearish shift. Close monitoring of volume trends will be essential in confirming this potential reversal and avoiding any price manipulation signals.
****Nifty Midcap forming same pattern but we analyze this because we will do Price Volume Analysis***

Nifty Small Cap Index signaling Risk On/ Outperformance BiasAttached: Nifty Small Cap 100/ Nifty 50 Daily Live Market Chart
A Possible Trend Change in this Ratio as there is Breakout
And now Small Caps are set to Outperform Large Caps for the coming few weeks
This is Risk On behavior, something has clearly changed on this Chart

GLENMARK- Relative Strength says Buy!Attached: Glenmark/ Nifty 50 Weekly Chart as of 31st March 2023
This Relative Strength (Ratio) Chart clearly shows the Outperformance of Glenmark over Nifty 50 has Started!
The Ratio Chart has given an Inverted Head & Shoulders Breakout with this Week's Candle Close
If you compared Glenmark and Nifty 50 both on a Year To Date basis for 2023, then we get:
Glenmark= Up 9.56% YTD
Nifty 50= Down Down 4.12% YTD
What this Means is that:
Going forward expect Glenmark to keep Outperforming Nifty 50
Your Money is better off Invested in an Outperforming Stock instead of Index Nifty 50
Glenmark Pharma can be one of the Leading Stocks for 2023
This has clear BULLISH Implications for the Stock Price
.................
Refer to my Related Ideas to see the Analysis of Glenmark's Price Chart which also has Bullish Implications like this Ratio Chart

INTERMARKET DIVERGENCE NIFTY & NIFTY METAL While NSE:NIFTY has made new low as compared to Dec 22.
NSE:CNXMETAL Index has not broken the Dec 22 lows.
This Inter Market Divergence again signalling strength in Broad Market stocks.
Historically it leads to Bullish trend reversal.

NIFTY AND CNXAUTO INTERMARKET DIVERGENCENSE:NIFTY and NSE:CNXAUTO are showing Inter market Divergence again.
Last time Divergence occurred in June 2022 when Nifty gave reversal. Will the Divergence work again.
Chance are High. We need to wait for follow up Buying though.

INTERMARKET DIVERGENCE CRUDE & NIFTYInter Market Divergence btwn CURRENCYCOM:OIL_CRUDE and NSE:NIFTY suggesting we are nearing the end of corrective phase.
A Bullish Trend reversal likely ahead. As per Elliott Waves and Inter Market Analysis.
#Elliottwave

INTER MARKET DIVERGENCE NIFTY & BANKNIFTYInter Market Divergence btwn NSE:NIFTY and NSE:BANKNIFTY suggesting we are nearing the end of corrective phase. We should be heading for Rally. Buying opportunities here.
#Elliottwave

Nifty Budget Rally DueNSE:NIFTY
Completed Triple Zigzag Correction form High near 19000
Broader Market stocks are showing strength. Rupee strengthening.
All factors pointing out Budget Rally is on cards.

New Low in Bank Nifty not confirmedClassic dow theory states that a new low in one index not confirmed by others indicates a potential trend reversal on cards. Nonconfirmation amounts to inter-market divergences that are bullish or bearish. In this situation, the new low in bank nifty today over the last few days is not confirmed by the Nifty. Even more, the outperformance of the Midcap 100 index below compared to the large cap indices shows that the broad market is not participating in the recent fall. All signs of bullish divergences. Ahead of the Union budget, the market is shaking out weak hands. The near triple bottom in Nifty is an interesting setup for the weeks ahead.

NIFTY MIDCAP DIVERGENCENSE:NIFTY NSE:CNXMIDCAP NSE:CNXSMALLCAP Diverging for couple of days. Ideally the broad market shall start picking up.
While Nifty is getting selling pressure near the Highs today. Midcap and Smallcap Index getting buying near support zone.
Midcap and Smallcap shall start picking up from here on.
The Broader Market Indices must converge with the Mainstream Index Nifty 50.
Inter-market Divergence is not sign of healthy trend. Longer the time the divergence prevails it leads to trend reversal.
As Nifty and Bank Nifty are near the Highs along with other Indices. Broader Market Indices and stocks shall pick up the trend now.

The Inter market divergence Between Nifty and S&P has continuedThe two Indices Dow and Nifty have moved in opposite directions for months Now or most of 2021 and that pattern continues. So it comes no surprise to me that we are up and the Dow is down on this chart.

