16th Nov ’23 Nifty Postmortem - Almost breaks 19776 resistanceNifty Weekly Expiry Analysis
Between the last expiry and today, Nifty50 has gained 359pts ~ 1.85% and broken 2 important resistance levels. We almost took out the 19776 resistance today but for a strong red candle @ 14.15.
Nifty Today Analysis
Recap from yesterday: “On the 1hr chart, the next target to break will be 19776 which is just 100pts away. Something that is easily possible if SPX holds its ground today. Since most of the market participants are long-only, any upsurge will sweep in more market participants.”
Nifty opened inline and then was steaming ahead, As we discussed yesterday it took out the 19776 with so much ease. The 3 5mts candles between 11.00 to 11.10 showed how the momentum picked up right before the resistance zone which kind of indicated that the rally was not going to slow down. By 13.55 we picked up more pace, quite visible by the FII participation on the BUY side. We hit an intraday high of 19875 by 14.45 and then something unplanned happened. We dropped 153pts in the 25 minutes, we will explain that in detail during the BankNifty Analysis below.
On the 1hr chart, we closed slightly below 19776, the 14.15 hourly candle is well-lit like a beacon. I am still continuing my bullish stance in the hopes that 19776 will get taken out during the forenoon session tomorrow. If not, I will be changing my stance to neutral and will update it via tradingview minds.
Intraday

Jubilant Foods - Time To WatchAs it is clear from the charts, the price is coming to the lower level of the channel. if bounces from these levels, may go bullish, Expected target may be 520 or even 580.
The setup fails if doesn't sustain above 497 on a closing basis.
This is only for learning and sharing purposes, not trading advice in any form.
All the best.

#USOIL intraday long trade setup Greetings Folks,
today I have prepared a setup of USOIL on TVC
the analysis is as follows-
-the price currently broke out of a range of equal highs, this is a good sign of bullish momentum
- the price is retracing right now, either it can take support from the 50% of retracement or respect the support zone i mentioned in chart
- the safer trade would be the latter one, i have marked the take profits also or you can also use pivot point indicator for exit
don't play with fire, always use a predefined stoploss

Major Resistance Breakout In VedantaStock gives breakout on a daily timeframe and consolidating in resistance area .
CMP : 322
Target : 334
Stoploss : 314
This is not a buy or sell call, this analysis is shared for educational purpose.

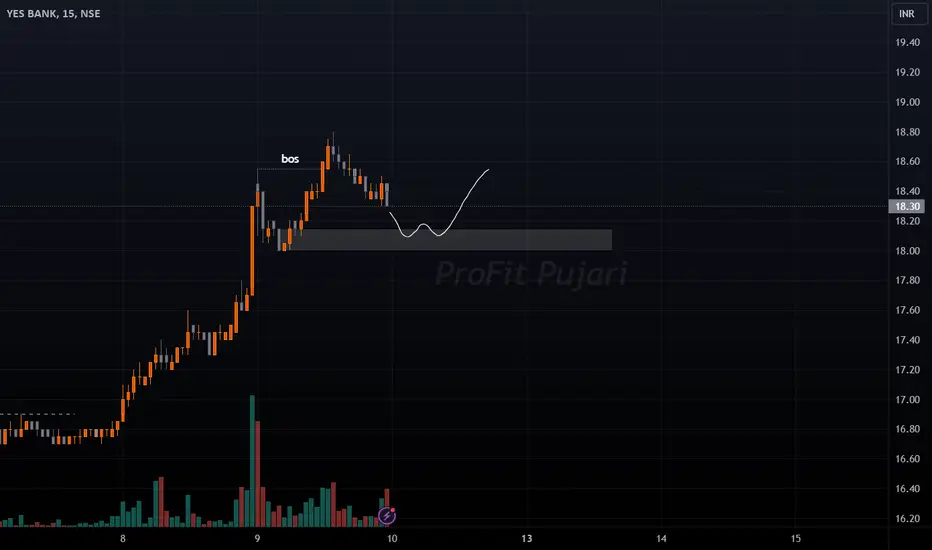
#YESBANK LONG TRADE IDEA SETUPGreetings Folks,
today I have prepared a setup of YESBANK on NSE
the analysis is as follows-
- the price is on a roll right now, making good structure along with new higher highs
- the market was slow today, hoping for a retracement for the price to gear up for the next bullish leg
- it CAN retrace deeper than the zone depicted in the chart if index opens negative tomorrow
don't play with fire, always use a predefined stoploss
#SUZLON LONG TRADE IDEA SETUPGreetings Folks,
today I have prepared a setup of SUZLON on NSE
the analysis is as follows-
-the price recently broke out of a bullish pattern
- its currently respecting a static resistance, which will get break in next trading day
- The price respected the previous high as a resistance, price is building up momentum to break past it
- either trade the breakout of high or when price submits to a support zone of BSL as mentioned or the trendline support
don't play with fire, always use a predefined stoploss

#PNB LONG TRADE IDEA SETUPGreetings Folks,
today I have prepared a setup of PNB on NSE
the analysis is as follows-
-the price recently broke out of a bullish pattern
- The price is kinda stretched right now, can use some temporary support for more momentum
- i have marked the most immediate strong support zone
- this trade setup might play in 2-3 days as the support zone is not in reach of price right now
don't play with fire, always use a predefined stoploss

#IFCI LONG TRADE IDEA SETUP Greetings Folks,
today I have prepared a setup of IFCI on NSE
the analysis is as follows-
- The price broke past the previous higher high
- now the price is spectating in a minor, just above the breakout area
- the most immediate minor high failed to break past the previous minor high indicating temporary weakness
- it would be better if the price would consolidate sometime in this minor range and then breakout
don't play with fire, always use a predefined stoploss


#SUZLON LONG TRADE IDEA SETUPGreetings Folks,
today I have prepared a setup of SUZLON on NSE
the analysis is as follows-
-the price recently broke out of a bullish pattern
- its currently respecting a static resistance, which will get break in next trading day
- the above resistance marked is the previous high, if price breaks pass through it the same day, this would indicate that the bullish trend still has power left, if it takes 2-3 trading days to breakout the previous high, dont set the target more than 4-5 % for safety
don't play with fire, always use a predefined stoploss

#NIFTY50 LONG TRADE IDEA SETUPGreetings Folks,
today I have prepared a setup of NSE
the analysis is as follows-
- the price is consolidating in a minor range
- breakout trade is very optimal for such scenario
- if breakout with good volume, can enter without retest, but safer entry will always be waiting for a retest
- there is chance that the trade can go south, so dont get your adrenaline in control
don't play with fire, always use a predefined stoploss

#RPOWER LONG TRADE IDEA SETUPGreetings Folks,
today I have prepared a setup of RPOWER on NSE
the analysis is as follows-
- The price is on a good bullish trend
- its retracing right now for another bullish leg, let the price settle on the support zone, then you can initiate the trade
- be alert about the volume when it approaches the support zone, it should be big buying candles for confirmation
don't play with fire, always use a predefined stoploss

Info Edge - Keep WatchingThe setup is simple to understand by the chart itself. The stock has bounced back from the lower support of the parallel channel. if the momentum continues, may go to 4250/4450 or even a lot more. In a bullish rally, it may go to 5300.
Sustaining below 3960 will show the weakness on the charts. it should travel inside the channel if considering a long setup.
This is only an indicative illustration for learning and sharing purposes, not a piece of trading advice in any form.
Wish you luck.

#IDEA LONG TRADE IDEA SETUPGreetings Folks,
today I have prepared a setup of IDEA on NSE
the analysis is as follows-
- The price is on a good bullish trend
- The price is making a famous triangle pattern
- wait for breakout with good volume, if breaks down then wait for price to settle on the support below
don't play with fire, always use a predefined stoploss

#ALKEM LONG TRADE IDEA SETUPGreetings Folks,
today I have prepared a setup of ALKEM on NSE
the analysis is as follows-
- The price is on a good bullish trend
- its time for price to retrace a little to refuel its momentum
- i have marked the immediate support below
- you may also do counter trade short but it would be require high cautiousness
don't play with fire, always use a predefined stoploss

#IDEA SHORT TRADE IDEA SETUP Greetings Folks,
today I have prepared a setup of IDEA on NSE
the analysis is as follows-
- The price has been on a good uptrend, now in my opinion i think price has to retrace to recharge its momentum
- i have marked the nearest support zone for price to settle, but just for safety i have marked another support zone below
- be very cautious if you want to counter trade the trend
don't play with fire, always use a predefined stoploss

#IFCI LONG TRADE IDEA SETUPGreetings Folks,
today i have prepared a setup of IFCI on NSE
the analysis is as follows-
- the price was in a minor downtrend, its now trying to pick bullish momentum
- there is good volume buildup in past trading sessions
- if nifty opens positive tomorrow, then we can
look to buy this after breakout
don't play with fire, always use a predefined stoploss

#INDHOTELS LONG TRADE IDEA SETUPGreetings Folks,
today i have prepared a setup of INDHOTELS on NSE
the analysis is as follows-
- The price is trying to establish a good support, taken support around 371.
- i am hoping for the price to retrace till the BSL, then it can either breakout or continue the bearish trend
don't play with fire, always use a predefined stoplos

#IRFC LONG TRADE IDEA SETUPGreetings Folks,
today I have prepared a setup of IRFC on NSE
the analysis is as follows-
- the price is speculating in a minor range right now
- my current bias is bullish so i will not be looking any short trades
- 2 possible entries are given in chart, the breakout and retest one is more probable
- if the market opens negatively, wait for price to settle on the below support
don't play with fire, always use a predefined stoploss

#MAHABANK LONG TRADE IDEA SETUPGreetings Folks,
today I have prepared a setup of MAHABANK on NSE
the analysis is as follows-
- price is currently facing a static resistance which has been tested earlier
- its very probable that tomorrow it may end up breaking this resistance
- wait for retest before entering as it may also be a bull trap by institutions
don't play with fire, always use a predefined stoploss

#IOB LONG TRADE IDEA SETUPGreetings Folks,
today I have prepared a setup of IOB on NSE
the analysis is as follows-
- The price was in a bearish leg
- its trying to pickup bullish momentum through a minor choch
- have mentioned 2 entries, use according to the tomorrow's market
don't play with fire, always use a predefined stoploss

#RPOWER LONG TRADE IDEA SETUPGreetings Folks,
today i have prepared a setup of RPOWER on NSE
the analysis is as follows-
- the price is looking to break the static resistance anytime now
- however i still would prefer the price first to breakout and retest rather than an aggressive entry, it can also breakout down side too
- if the price goes down, leave the setup
don't play with fire, always use a predefined stoploss

intra buytrend line break based intraday trade
looking for tgt range 864-871
stop as per comfort
disclaimer - trade @ own risk
