Nifty - intradayToday market will be goes flat or 50 points up and down afternoon we expect big move up or down
Intraday

#NIFTY50 #Banknifty- Daily #Intraday analysis 6th jan 2023Important levels and data we checked. Kindly check.
All the best.

BANKNIFTY TOMORROW PREDICTION...BANKNIFTY analysis for tomorrow. In my opinion the market will be GAP DOWN tomorrow. If the market cross 42481 then we can go for PE(PUT) in banknifty for tomorrow... First target 42378, second target 42234 and third target 42085. if the market goes UPSIDE we should BUY CE(CALL) in banknifty above 42756. First target42905. second target 42973 and third target 43135...

consolidation in small rangestock is consolidating from 7 days . it will give a massive breakout so you can enter on breakout or taking rejection from upside so both side potential . intraday , 15min , follow your risk management

intraday time frame :15min . a great closing then you can enter for long side by putting a logical stop loss.
follow your risk management

intradayonly for short side. time frame :15min . a great closing then you can enter for short by putting a logical stop loss.
follow your risk management

BANK NIFTY TRADE PLAN FOR 05-01-2023Bank Nifty is at Crucial Support of 43000 Zone. In my view, Bank Nifty is more Bullish than Nifty in the Long term.
1. Bank Nifty Closed below 43000, But is still in the Support Zone. We can plan Buying based on Price action today and we can achieve a Good RR Ratio of more than 1:2 and 1:3.
2. If Bank Nifty sustains below 43000 and breaks the support trendline, I will plan to sell on Proper Retest. 42500 Zone will be Big Support in my view because Bank nifty is forming inside candle patterns in Daily TF and the Low of Mother Candle is 42500.
ps: Budget Session is ahead - Trade with Proper Risk Management.


NIFTY 50 TRADE PLAN FOR 05-01-2023NIFTY is at Crucial Support of the 18000 zone and today is the weekly expiry. Therefore we can expect volatility in the market and there can be Fake Breakouts.
1. Nifty closed at 0.5 FIB Zone and if it sustains there and crosses 0.382 FIB along with the resistance trendline, Will take a bullish entry on a proper retest.
2. If Nifty breaks the 18000 zone and Important hourly support trend line. My view will be bearish for the short term. The next support will be 17800. There are many GAPS pending below 17800 and I think market will fill those gaps, once 17800 is broken
ps: Budget Session is ahead - Trade with Proper Risk Management.

#NIFTY50 #Banknifty- Daily #Intraday analysis 5th jan 2023Important details were discussed in this video. check and trade safely.
Wish you all the best.


SCHNEIDER ELECTRIC - DAY CHART - 04.01.2023 - BAHAVAN CAPITALSCHNEIDER ELECTRIC as per Day chart Analysis
Stock ABOVE 174 TARGET 178
Today there had been a big sell of from FII 2620.89 Cr and DII Net Buying is 773.58 Cr.
Nifty can take a support at 17835 or 17771 Level.
Bank Nifty can take a Support at 41951 Level.
Happy Profitable Trading to All...

BTST trade for BHELNSE:BHEL price target and stop loss is mentioned on the chart
Do like and follow if you take this trade and make a profit

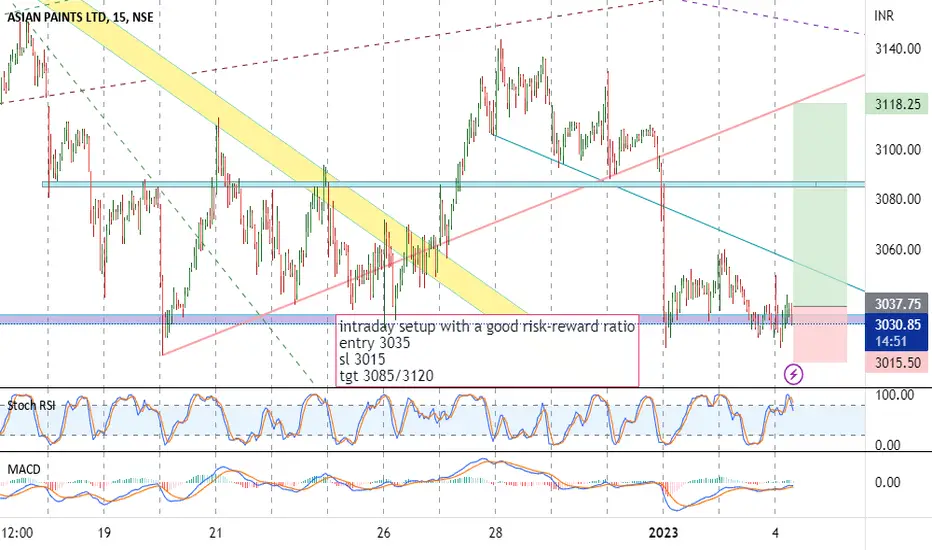
Asian Paints - intraday setupAn intraday setup with a convenient risk-reward ratio.
All levels are mentioned on the charts.
Only for learning and sharing purposes, not a piece of trading advice in any form.
All the best.
Jindal Steel - intraday SetupThe chart is self-explanatory. As long as the stock is trading above 585-586. chances to go to the levels of 600 are there.
Only for learning and sharing purposes. not a bit of trading advice in any form.
All the bwst.


intradayhead and shoulder pattern only short side , follow your risk management and do your own analysis

Bajaj Finance - Intraday set up All levels are mentioned on the chart. This setup is to understand supports and resistances according to trend lines.
Only for learning and sharing purposes. Not a bit of trading advice.
All the best.

Fin Nifty 2 hour chart. Breakout above 19100 can buy 19000 CEFin Nifty 2 hour chart. Breakout above 19100 can buy 19000 CE
If it sustains above 19100 in first 15 minutes Time frame, we can buy 19100 CE for small profit.
Since it is expiry, SL is must with 25 points as max. Risk


consolidation in small rangeambuja cement is consolidating in small range from last three days. it has potential for both side. follow your risk management .
timeframe : 15min
intraday

consolidating from 3 daysadani ports is consolidating in a range from last three days so it has potential for bothside . intraday

Dogecoin buy-Inverted head and shoulder formingHappy new year guys,I wish this year we all can fulfill our dreams of becoming successful traders.
So Here is another trades for you.Dogecoin is making a bull setup with a inverted head and shoulder pattern in 1h time frame.There is a strong resistance zone in the neckline of the pattern(0.07091-0.07158 level) which dogecoin is trying to break.A breakout candle is already seen in the chart but because of the strong resistance it can reject another 2-3 times.If it breaks,a buy trade can be initiated from here.It may take a retest after reaching the first resistance level(0.07448).
So keep an eye on this trade.You may have hold the trade for 1-2 days.Happy trading.
